

Determining what the charts say is usually pretty easy. Determining when central bankers will hit the panic switch is considerably harder.
When the markets melted down in Feb-Mar 2020, some very important support levels were tested. The Dow, for instance, was propped up precisely as it arrived back at post-2016 election levels — fortunately for Trump. One of the most consistently effective tools in propping up stocks has been hammering vol into submission. The algos and everything which keys off them – about 90% of daily trading volume – pay very close attention to VIX. It’s not an overstatement to say that VIX is the tail that wags the market’s dog.
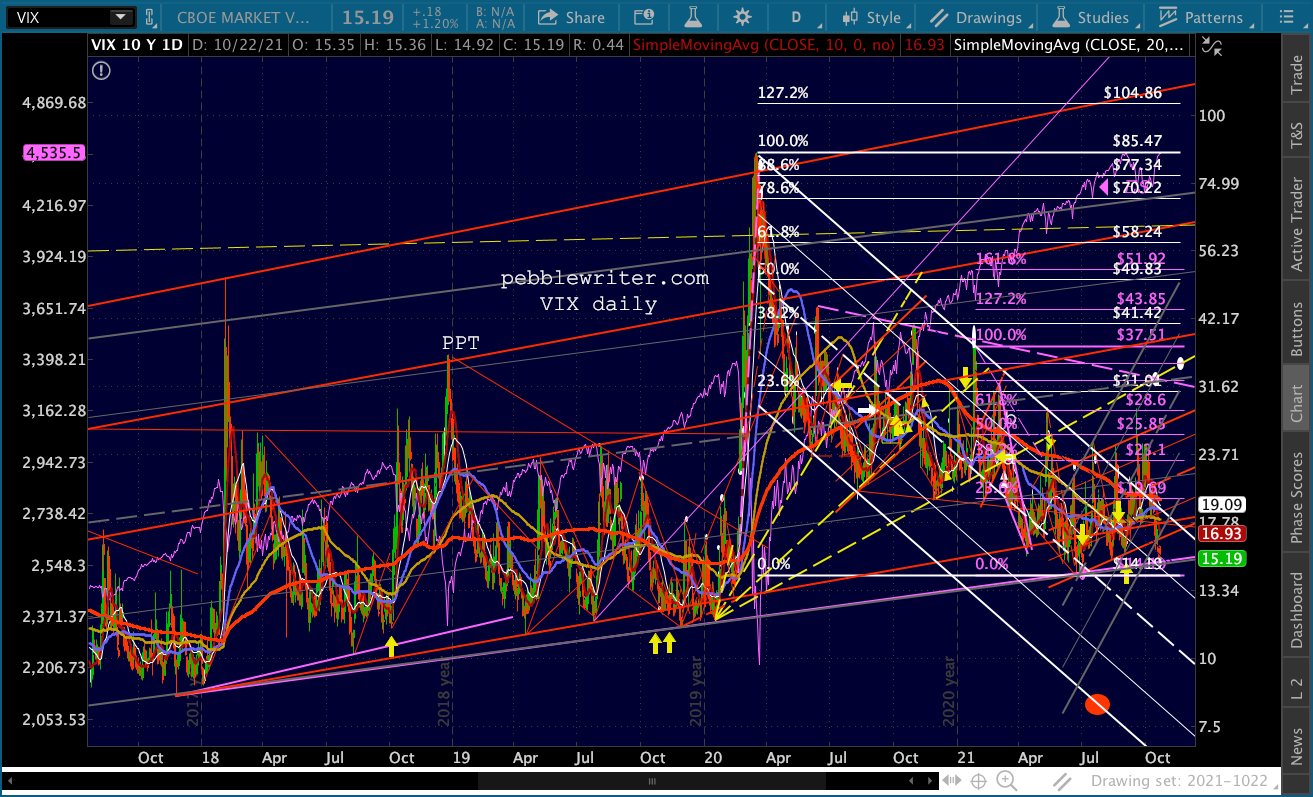
VIX had soared from the low teens in late 2019 to 85 by Mar 18, 2020. On that day, two days before stocks bottomed out, it began a punishing journey back to its former lows which continues to this day.
The falling white channel below is testament to its precision, particularly once the Jan 27, 2021 high was in place. The subsequent highs all represented turning points, with VIX collapsing at the top of the channel each and every time — until Sep 20.
 This time VIX not only poked above the channel top, but remained up there for 13 of the 17 subsequent days. Not only that, but its chart supported/signaled a rise to 32.
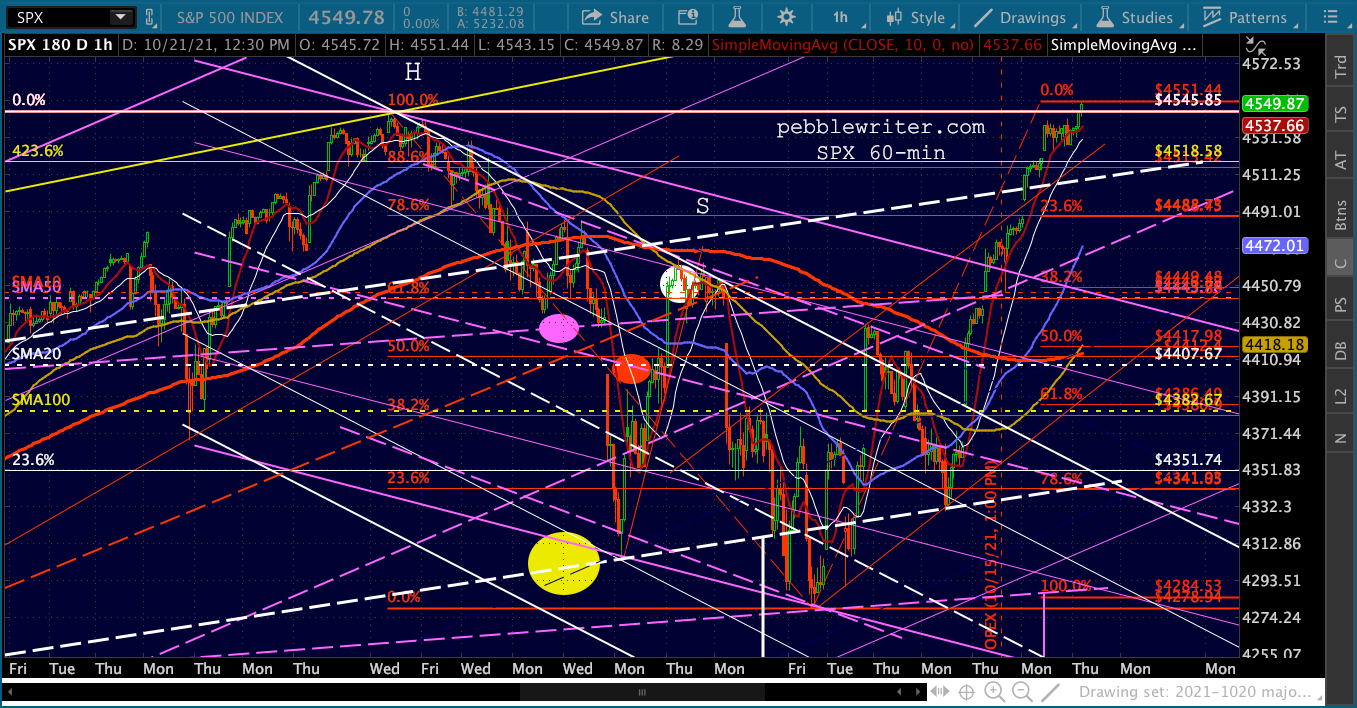
 The move was logical in that SPX’s rapidly rising 200-day moving average was almost within 10% of its recent highs and was aligned with the bottom of a channel which had guided the index higher since mid 2020.
Since SPX had fallen through its SMA50 for the first time in a year, it seemed as though central bankers had tacitly agreed to allow an actual correction, a 10% drop to the 200-day moving average and channel bottom.
 On Sep 20, however, someone pushed the panic button. Since then, VIX has been sliced in half and has fallen back into the falling white channel from which it broke out. Furthermore, it is threatening to break down below a trend line of support dating back to 2017.
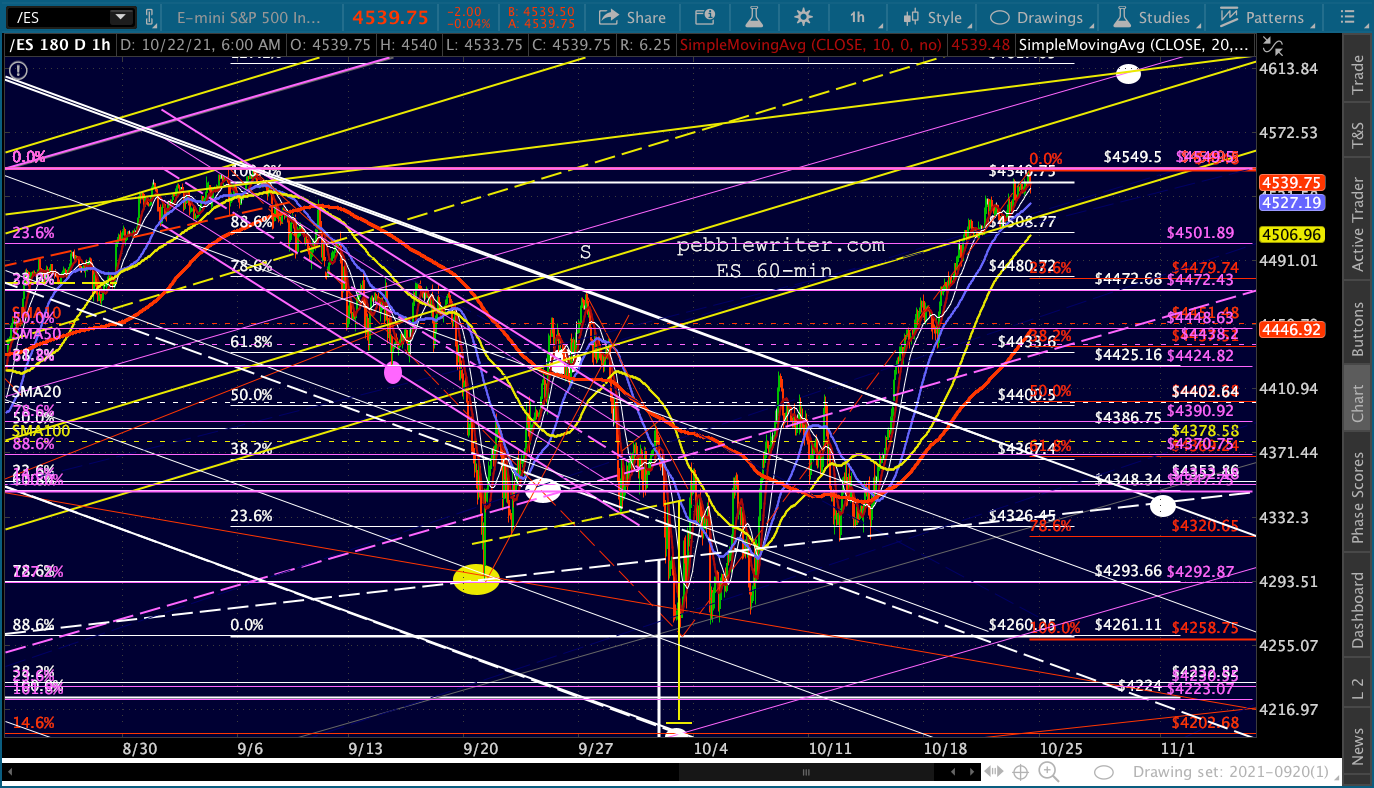
As a result, SPX broke out of its bearish patterns and made a new all-time high yesterday. ES joined it today. From a charting standpoint, this busts many — though not all — of the bearish scenarios. I emphasize this is merely a charting or technical analysis perspective. There are obviously a number of fundamental and arguments for higher prices, not to mention TINA, FOMO and BTFD.
continued for members…
I’ll get the obvious counterpoint out of the way first. SPX had broken out to new highs when it popped through the 2.618 extension at 3047 on Nov 1, 2019. It didn’t hold, and the market plunged back through all that support, including the SMA200, on Feb 27. Such things remain a risk, particularly if COVID were to come roaring back this winter.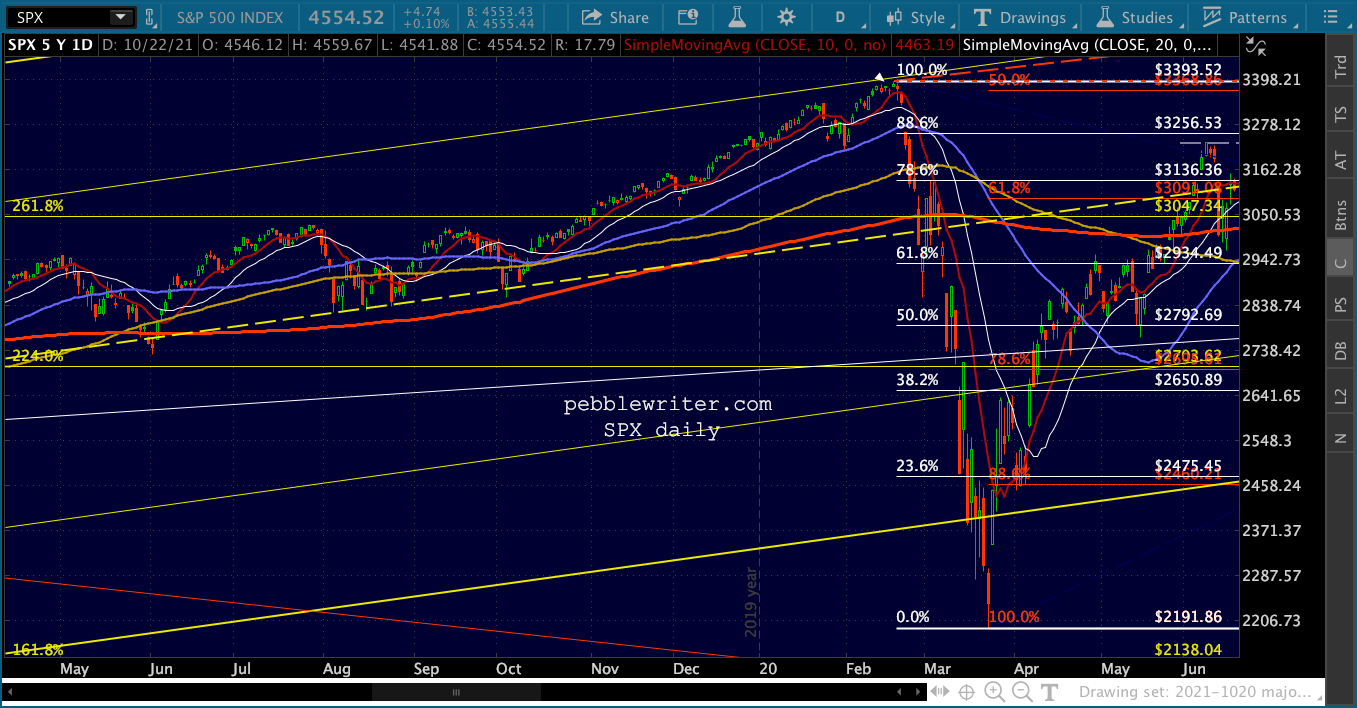
I mention this because there remains a decent possibility that we’ll zigzag much like in 2015-2016. We’ll want to keep an eye on those former highs, the rising SMA200 (tagging it at a higher low would be okay), and of course the VIX purple TL.
As long as the September highs hold, the downside case is much less likely. The upside case, particularly as we edge into the end of the year, reflects a supportive set of factors. Markets seem not to care about inflation, debt, bubbles or anything else as long as the effects play out slowly and deliberately (think boiling frogs.)
VIX remains in a place where it can easily break down. It could be a big breakdown, but I rather suspect it would be similar to late 2019 when it was a little bit at a time.
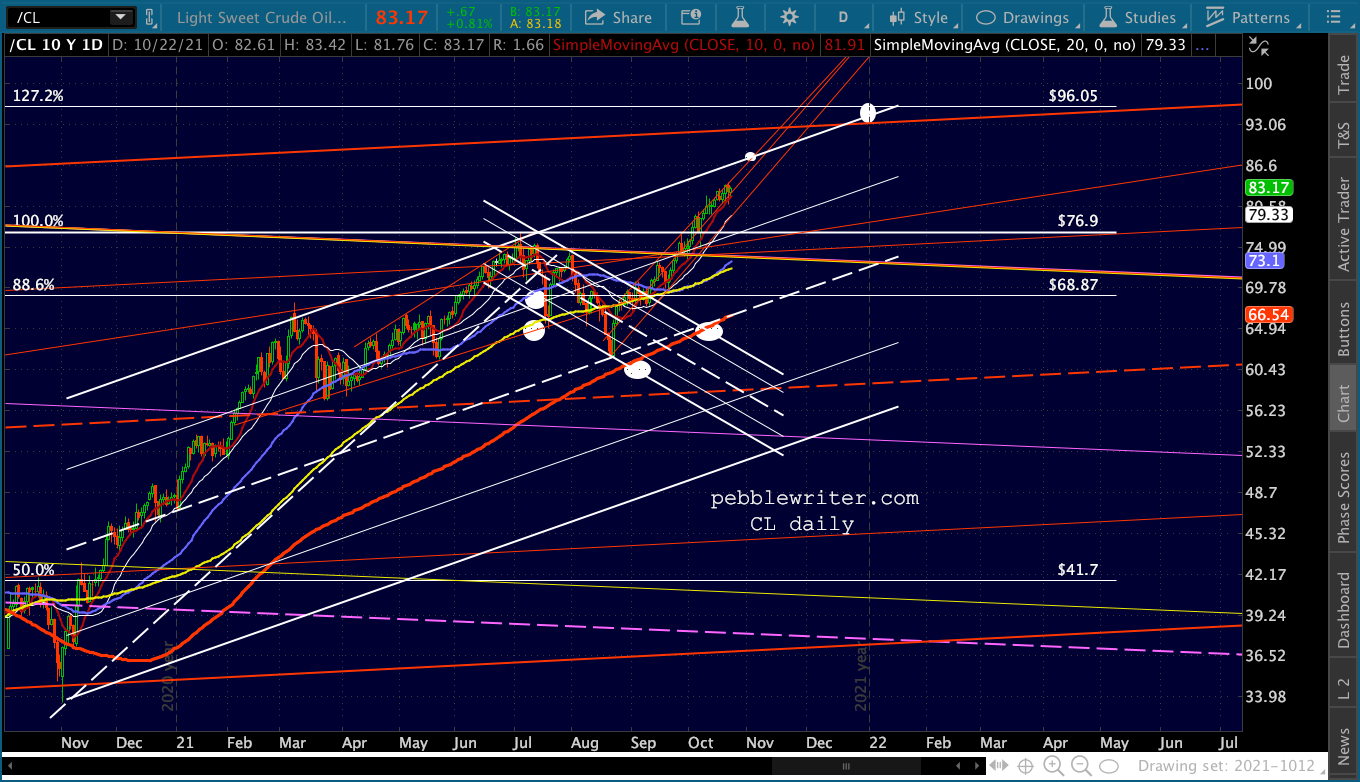
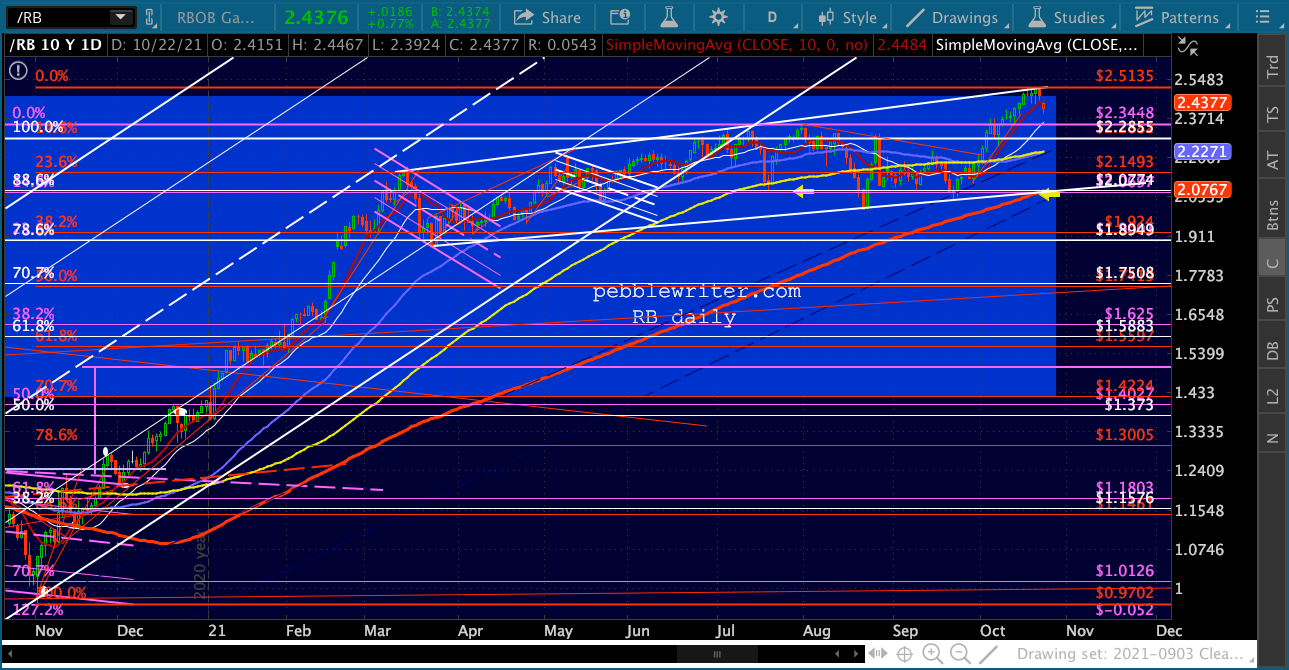
 If it does, CL would be able to settle lower if needed in order to produce the “right” CPI data. RB seems to have already started down.
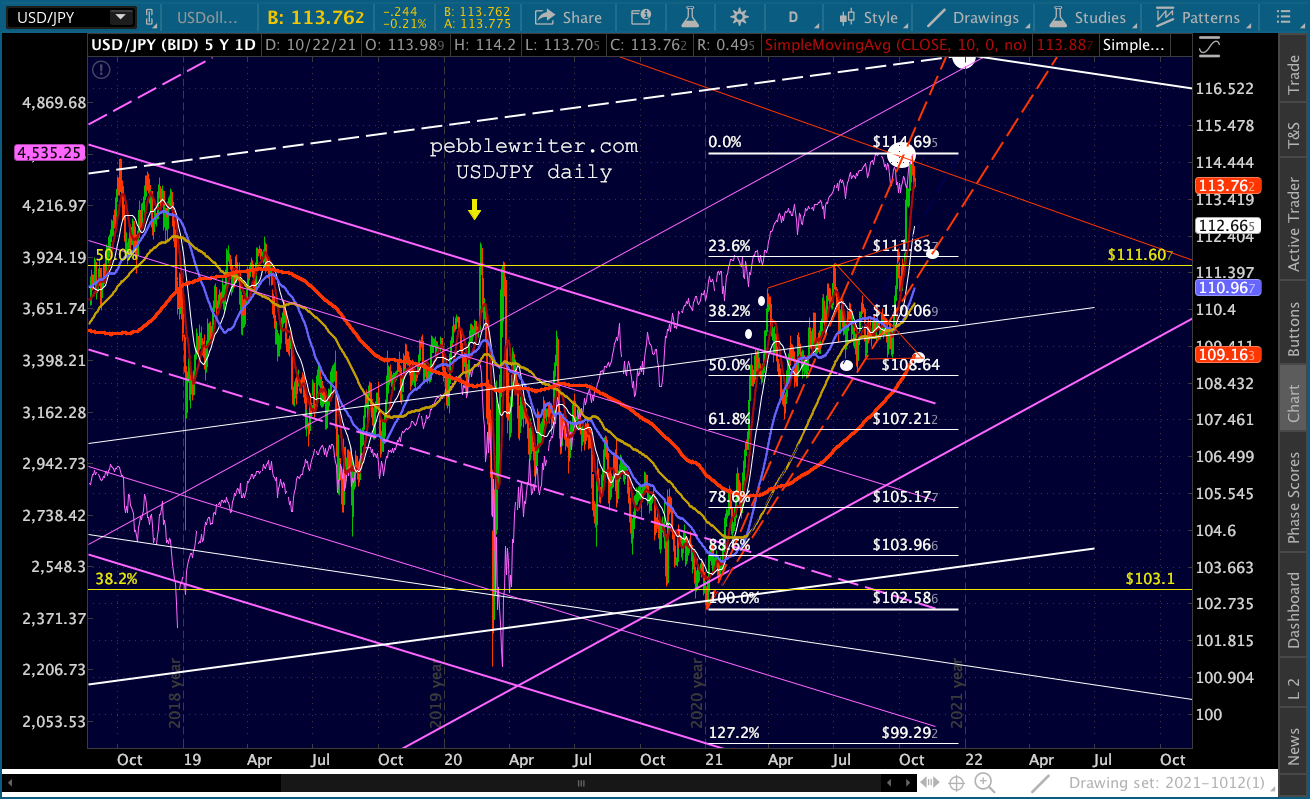
 As we’ve discussed, USDJPY is also at a potential reversal point and could retest a number of support levels in order to recharge for the next step up, or it could simply continue to melt up.
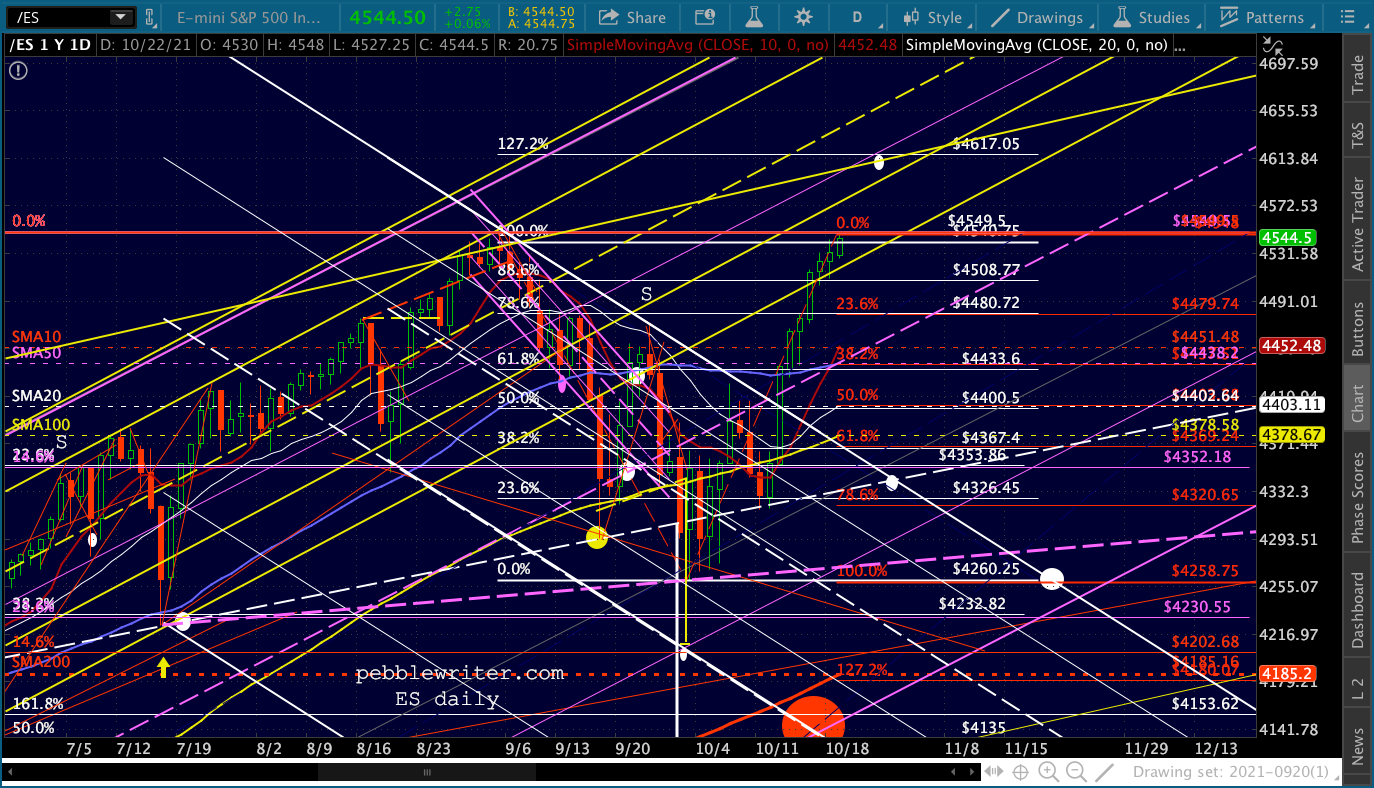
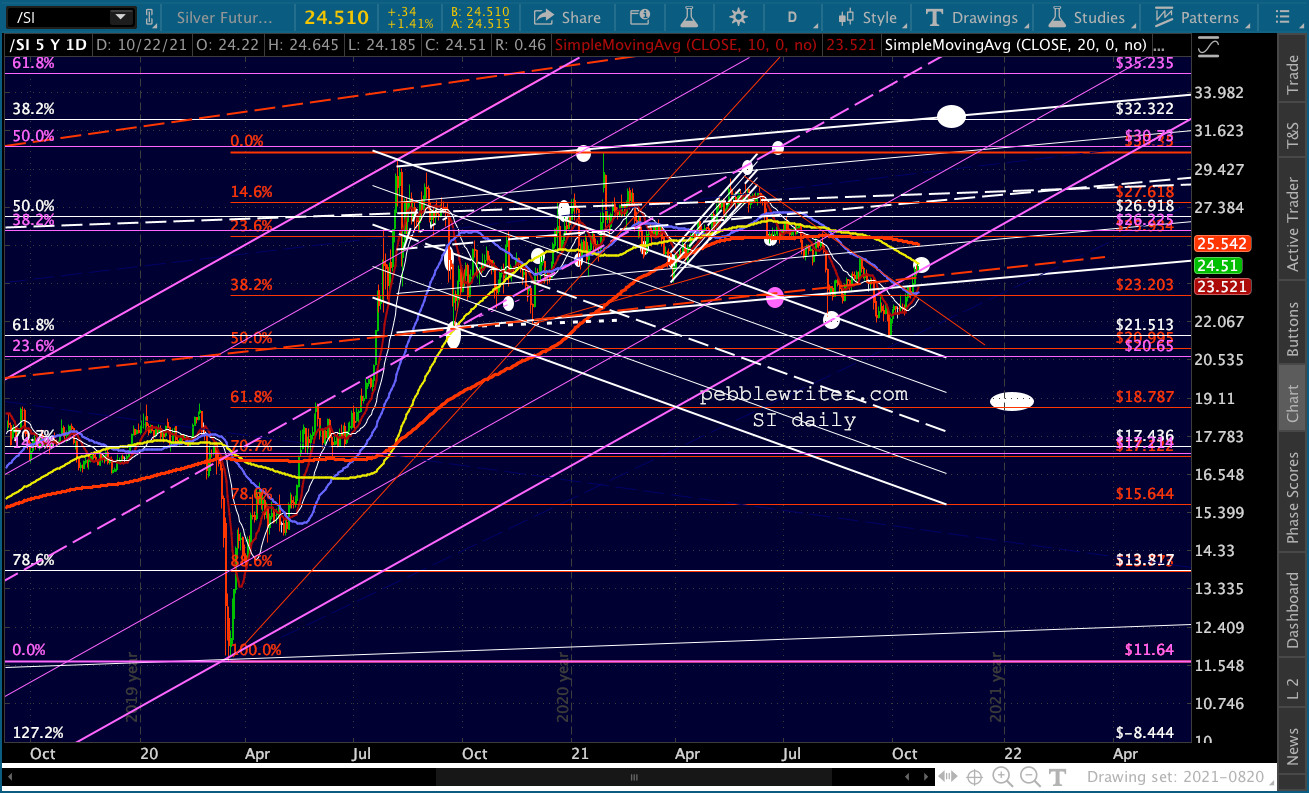
 The rest of our charts… Note that rising channel tops and Fib extensions will come into play again. I’ll work on some specific targets over the next few days.
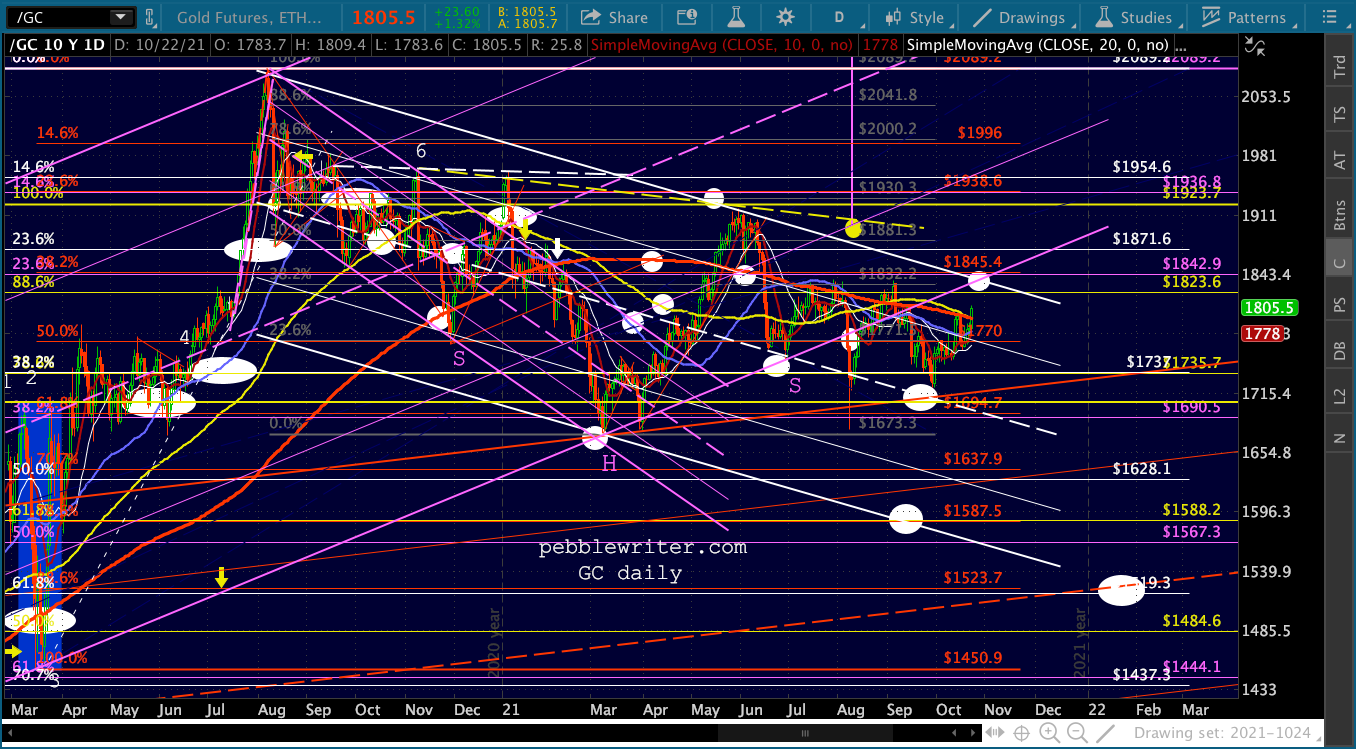
 The inflation data will be a bit of a wild card, as GC’s breakout above its SMA100/200 this morning indicates.
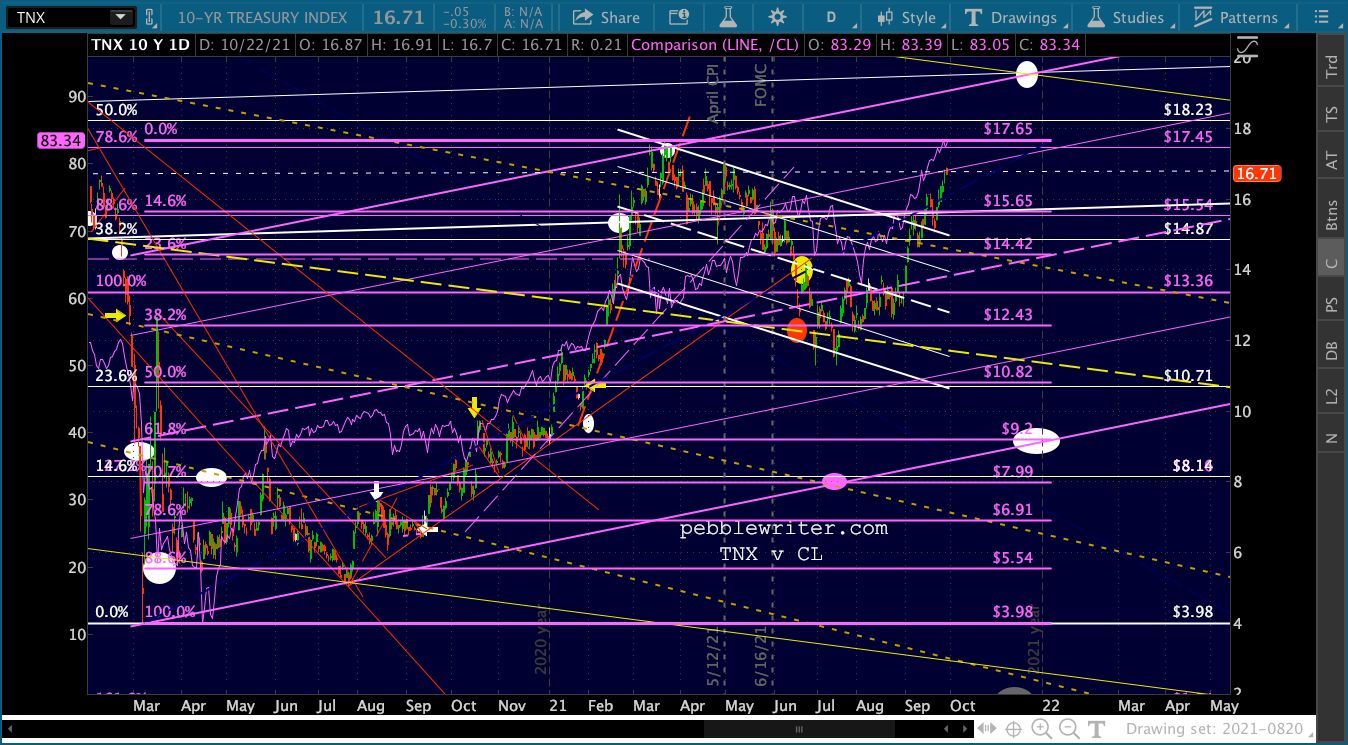
 The 10Y remains tied to CL…
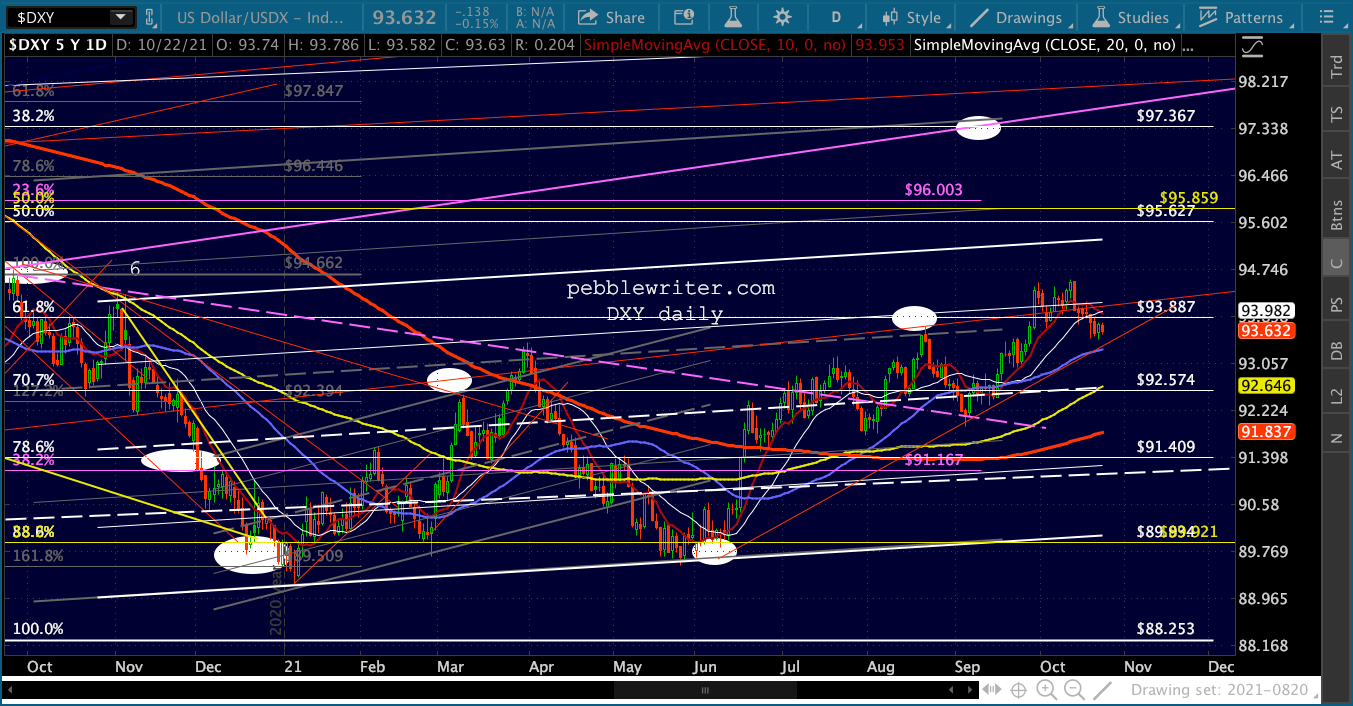
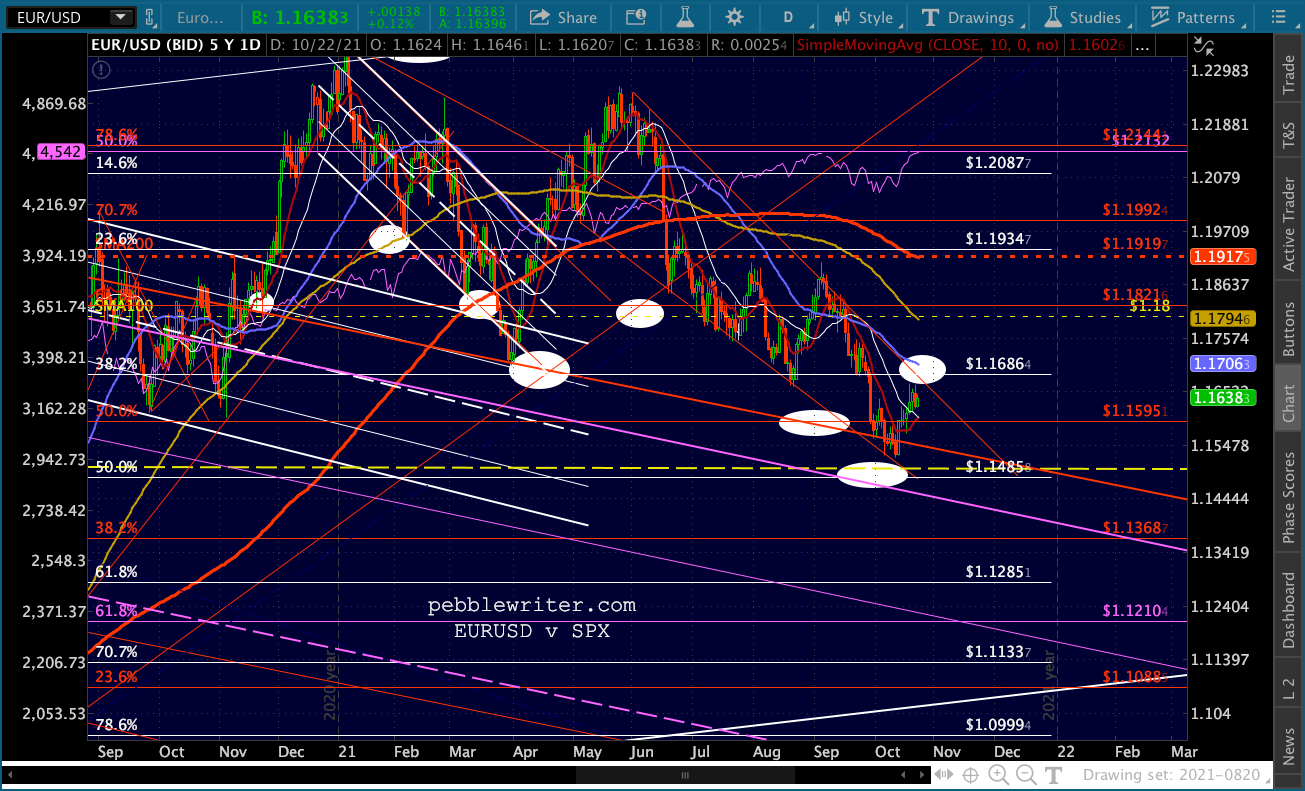
 …and DXY is still on the bubble, with USDJPY seemingly pulling back and EURUSD coming up to a decision point.
 I’ll be back in the office on Monday. I wish everyone a great weekend.