Year: 2016

  • More Trouble for Mr Market

    SPX managed to hold the key 2138 level yesterday, going into meltup mode following release of the Fed minutes and closing just above it at 2139.18 — but, just below the SMA100, thus triggering a short position.

    Hawkish minutes will almost certainly result in lower prices, with downside targets of 2126.06, 2116.61 and 2102.56…any sustained drop through the SMA100 at 2138.57 should be shorted.

    But, that was before USDJPY broke down, CL dipped overnight (to tag our 49.50 target) and DB continued selling off after reaching our 13.98 target [see: Deutsche Bank: Will it Survive?]

    2016-10-13-cl-60-0610Even USDJPY is falling after a failed breakout that finally saw it tag a key midline.  There’s no doubt 2138 will be severely tested again today.  Will yesterday’s initial downside target of 2126.06 hold or will we see new lows?

    continued for members(more…)

  • Next Steps

    We’ve been watching a triangle form for over a month, wondering whether/when it would break out or break down. Yesterday, we got our answer.

    After coming within .40 of our 2170-2173 target on Monday, the triangle broke down — despite vigorous intraday ramping in USDJPY and CL.  Tuesday’s initial downside target at 2150 was taken out without any difficulty.

    New market-health-indicator Deutsche Bank, which reached our 13.98 target (+18.7%) from our bottom call on Sep 27, is wavering.  Having briefly pushed through resistance, it’s now clinging to support.2016-10-12-db-60-0600What’s next for stocks?

    continued for members(more…)

  • Watching & Waiting

    We’ve had multiple target tags the past few sessions, with the latest being CL – which just reached our upside target.  The chart below, from our Oct 3 Update on Oil, illustrates the timing issue TPTB face with CL’s rise from February.

    As discussed yesterday in Welcome to Peak Oil continued rise will certainly help support equities, but it would result in higher year-over-year inflation measurements — which would strengthen the argument for higher rates.2016-10-11-cl-daily-0543So, from here on we’re on breakout/breakdown watch.  CL, USDJPY, VIX, DX…they’re all in a position to do one or the other.  And, don’t forget about DB, which reached our 13.88 target yesterday: the 61.8% retracement of its latest plunge.2016-10-11-db-60-0632continued for members(more…)

  • Welcome to Peak Oil

    The term “peak oil,” per Wikipedia, is the point in time when the maximum rate of extraction of petroleum is reached, after which it is expected to enter terminal decline.

    To yours truly, it refers to the point in time at which oil prices must begin to decline lest their effect on inflation become problematic. Today is that day.

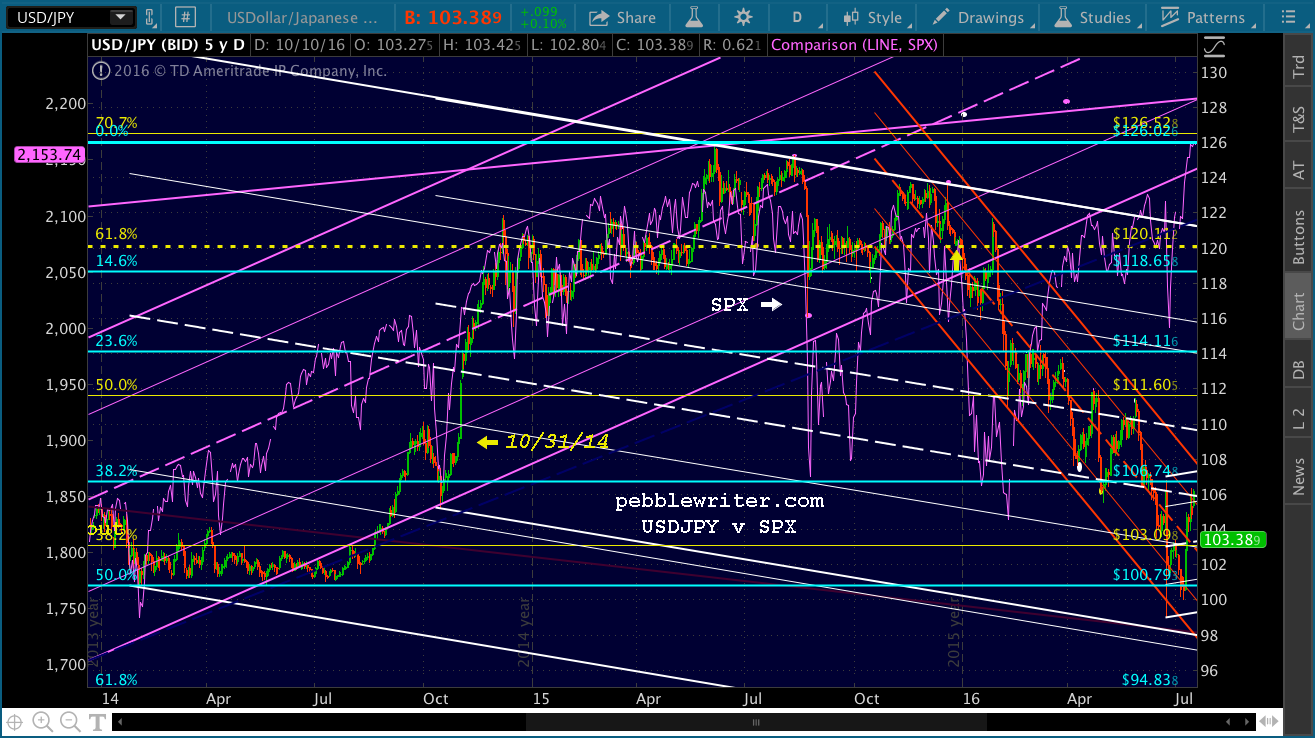
    To understand the significance, we have to go back to Jul 2014. USDJPY, the primary driver of stock prices via the yen carry trade, broke out (yen declined) after a protracted consolidation [for more: see What Really Drives Stock Prices?]  Having the yen rapidly drop in value might have produced inconvenient inflation in Japan, which imports all of its oil.

    Fortunately, there was one simple way to cope with it: crash the oil market. As the chart below shows, the two events were simultaneous. CL plummeted from 107 in Jun 2014 to 26.05 in Feb 2016 as USDJPY shot higher.

    2016-10-10-cl-v-usdjpy-big-0548

    When USDJPY reached 126, however, it ran into overwhelming overhead resistance and began a precipitous decline. Stocks, which had relied on an ever-rising USDJPY, were not amused.

    In fact, every time USDJPY dipped below the critical 120.11 level (dotted yellow line below), SPX fell off a cliff.   The Powers That Be needed a new way to prop up “markets.”2016-10-10-usdjpy-v-spxTo TPTB’s delight, they discovered they could manipulate the price of stocks as easily with CL as they had with USDJPY.  Remember, a dropping USDJPY means the yen is appreciating.

    So, rising oil prices were acceptable to both Japan and the US which, given the recent declines, had plenty of leeway to allow prices to “recover.” Indeed, a recovery was necessary in order to prevent another round of bank failures.

    On Feb 11, CL bottomed as expected at 26.05 and nearly doubled over the following four months.  Stocks also recovered sharply, even as USDJPY dropped like a rock.

    By now, you might be thinking “this is all well and good, but what does it have to do with peak oil?”

    Simply put, today marks the one year anniversary of the beginning of CL’s last plunge: from 50.92 on Oct 9, 2015 to 26.05 on Feb 11, 2016.  Given where CL is now, every tick higher will theoretically manifest in higher inflation (year-over-year.)  Now, consider where it would need to go in order to avoid such inflation.  That’s right, back below 30 (not likely, as it would crash equity markets all over again.)

    2016-10-10-cl-daily-big-pictureAgain, inflation would be a most inconvenient development for central banks which have used the threat of deflation to justify quantitative easing and other unprecedented intervention in financial markets.2016-10-10-cl-v-usdjpy-0532From here on, TPTB must either: (1) resign themselves to higher inflation going forward, which would ultimately necessitate higher interest rates and thus crash equity markets; or, (2) rev up the yen carry trade again; or, (3) find a new carry trade to keep equity prices on the rise.

    Is it any surprise that USDJPY recently broke out of the falling red channel it’s been in since Oct 2015?2016-10-10-usdjpy-daily-chnlWe remain long from 2147.65 on Oct 4, with last week’s upside target price unchanged.

    GLTA.



  • How Long Will This Go On?

    The short answer: not much longer, as I’ll explain below.

    Our forecast remains on track, despite the unnerving chop and deteriorating news flow.  The latest: the British pound, which flash crashed yesterday despite the supposed control of TPTB.2016-10-07-eurgbp-daily-0554We remain long from 2148.63 on Tuesday.

    continued for members(more…)

  • Charts I’m Watching: Oct 6, 2016

    Running a little late this morning, so two quick charts right up front.  Everything I posted yesterday still applies.

    2016-10-06-cl-daily-0515continued for members(more…)

  • Charts I’m Watching: Oct 5, 2016

    Just a quick post this morning.  Yesterday, ES nailed our downside target from Monday, meaning SPX slightly overshot its at 2144.01 vs 2147.65.

    The drum I’ve been beating this week still resonates this morning.  CL topped its Aug 19 highs.  This suggests a break out, though it’s still early in the day.2016-10-05-cl-daily-0543continued for members(more…)

  • The Most Important Chart

    Last chance to nab an Annual Membership at a 62% discount. And, we still have a few discounted Monthly Memberships left.  For details and to sign up now CLICK HERE.

     *  *  *  *  *

    Today, it’s all about oil — which reached our next upside price target yesterday.  I know, I know. Most investors are focused on how the ECB and German government will bail out Deutsche, or what Evans and Lacker might have to say, or even the NY ISM data.  And, I’d be shocked if oil even makes any headlines, today.

    Still, it’s the most important chart I’m watching at the moment.  As I noted in yesterday’s Update on Oil, whether or not it breaks out or reverses at this point will determine not only where stocks go for the next few months, but whether or not the economy is able to muddle through.

    2016-10-04-cl-v-spx-daily-0600

    continued for members(more…)

  • Update on Oil: Oct 3, 2016

    In our last update [see: Aug 30, 2016 Update on Oil] I noted that CL had bounced prematurely, leaving the channel it had broken out of without a backtest.  It was at 46.20 at the time.

    …the delay left the falling white channel without a backtest… To further complicate things, DX and USDJPY just broke out.  Is it possible the yen carry trade is being resuscitated and CL will be allowed to decline further?2016-08-30-cl-daily-cu-1600

    If so, then we’ll likely see it drop down to 43ish over the next several weeks (the red dot in mid-September) to tag the white channel bottom and, potentially, the white .618 Fib at 43.07.

    As it turned out, the yen carry trade was resuscitated.  USDJPY rallied over 4% between Aug 26 and Sep 2.  This left CL free to decline without seriously dinging stocks.

    CL did more than backtest the white channel by mid-September.  It dropped through the channel top, tagging 43.07 (actually 43.00) only two days later.  As expected, it got a tremendous bounce at that point — gaining 11% in the next week.

    Not surprisingly, not one client complained that the forecast came together so quickly!  But, the rapid rebound left me with a charting quandary.  By coming when it did, the bounce left CL without a solid tag of the rising channel from Feb 11.

    Fortunately, there was a solution: another tag on Sep 20 — this time at 43.06.  By coming back for another swipe at it, the rising channel bottom was tagged, too.  With that nicety out of the way, the next rebound was even more impressive: 13.8% as of earlier today, when it tagged our 48.64 upside target from last week [see: Don’t Worry, Be Happy.]

    2016-10-03-cl-60-1500

    For those who’ve played along in CL, congratulations.  You’re up about 35% (unleveraged) in the past five weeks alone.  This, on top of the 120%+ that came since our Feb 11 bottom call [see: USDJPY Finally Relents.]

    For those who haven’t, I encourage you to give it some thought.  Charting CL has been easier than charting equities — especially since I came to understand that CL was being used as a tool with which to drive equity algos.

    With that said, let’s look at the path forward.  Today’s high marked an incredibly important inflection point.  Where it goes from here will likely be the most important determinant of equity prices for the remainder of the year.

    continued for members(more…)

  • Welcome to October

    A reminder: today is the last day ever to sign up for a Charter Annual membership.  It’s priced at 57% off the usual annual price and protects you against future price increases for the life of the site.  At the equivalent of $70.83/month, it’s a deal.  And, for commitment-phobics out there, we’re offering a $150 rebate on the first month of monthly recurring subscriptions.  For more details and to sign up now, CLICK HERE.

     *  *  *  *  *

    October: it’s the month of some of the nastiest markets in history.  Recently, however, it’s been the month of some of the most impressive interventions (remember Kuroda’s Halloween surprise in 2014?)  Which will this October be?

    On the one hand, we have another potential global financial meltdown brewing.  Deutsche Bank’s 18% rally off last week’s must-hold bottom [see: Deutsche Bank: Will it Survive?] is in danger of faltering, as the rumor of a deal with the DoJ is turning out to be nothing more than a rumor.  Who would do such a thing!?

    2016-10-03-db-60-0615

    On the other hand, several of the most powerful algo drivers have been coiling for the past month, signaling a potential break out.

    continued for members(more…)