Year: 2016

  • September 2016 Results

    September came in better than August, totaling +14.44% compared to the S&P 500’s  0.04% loss.  This brings our monthly average for 2015 and 2016 to 16.45% versus SPX’s 0.31%.

    2016-09-monthly-perfThe month started off as a continuation of August’s extremely low volatility.  In fact, through September 7, volatility in the Dow (trailing 40 sessions) was the lowest it had been for over 100 years.

    With the S&P 500 having finally topped its 2015 highs and the critical 2138 Fib level, it was on a mission to hold its gains. There was very little in the way of positive economic or geopolitical news to justify it.  As if that really mattered…

    2016-10-02-spx-v-cl-daily-1400Central banks went back to the well with well-timed ramps in oil (26%, 11% and 12% starting on Aug 19, Sep 1 and Sep 20 respectively) and USDJPY (+4.8% between Aug 16 – Sep 2) to goose the algos whenever necessary.

    And, the Fed rediscovered its fondness for VIX, repeatedly monkey-hammering the (former) risk indicator whenever stocks needed a little help.  The drop from the post-Brexit 26.72 to 11.02 in early August was one of the steepest declines ever.  Having been so successful in staving off Armageddon, VIX was utilized frequently to prop up SPX.

    2016-10-02-vix-v-spx

    This sometimes left us twisting in the wind during August and September.  I’d see SPX break down through support towards a perfectly logical downside target and recommend a short position, only to see VIX suddenly plunge by 20-30 cents — sending SPX higher or, at least delaying its decline.  Trade advices were affected a whopping 27 times last month.

    It happened most often at the end of the day — the purpose being to make bears think twice about staying short overnight.  After being suckered into it a couple of  times, I recognized the pattern and opened up to more frequent overnight positions — staying long or short 6 times overnight for an average gain of 10 points (about 1/2%.)

    As regular readers know, I almost always include the proviso to hold long or short overnight only when you’re able to hedge or watch your position, or are an experienced swing trader.  In my opinion, swing trading has become nearly impossible, with over half the sessions featuring a gap up or down.  In September, it happened 17 times in 22 sessions.

    2016-10-02-spy-gapsIn the end, our forecasting went well.  The dip to 2138 I forecast on Aug 19 was supposed to happen on Sep 12, but occurred a day early.  And, the rally I forecast based on the expectation that the BoJ and the FOMC would hold rates steady went off without a hitch.  From the day before:

    The BoJ and FOMC [should] both stand pat, with the BoJ possibly increasing equity purchases (but shifting to TOPIX from NKD) and the FOMC pounding the table on a December rate hike to help prop up the USD.

    If all you had done was play the Sep 9 breakdown and the BoJ/FOMC decisions, you’d still have made 8-9% in an unleveraged trading account [more for those who use margin,  options or futures.]  It’s a good reminder that you needn’t follow every trade advice in order to do alright. 2016-09-daily-perfSome of you would be perfectly happy placing a few trades per month rather than per day.  If this describes you, I encourage you to study the Big Picture posts and the 60-min and daily charts [our last was What to Expect on Sep 20.]  I posted a compilation of them in August, available HERE, and I have to say they’ve performed extremely well.

    The fact is I prefer swing trading.  But, given the gap and VIX issues pointed out above, it continues to be incredibly difficult.  The number of formerly successful hedge funds which have closed up shop these past few months is truly staggering.

    Regardless of your orientation, I’ll continue to pare down the number of trade advices issued each day.  Lately we’re running about half of what I put out a few months months ago, and I’ll continue trying to reduce the total.  Most of you seem to be happy with the change.

    The next few months are certain to be interesting.  Deutsche Bank, with its $47 trillion in derivatives, is on the ropes.  Oil, misunderstood by nearly everybody, continues to enjoy spurious 10%+ rallies.  Currencies bend to the will of central planners rather than market forces.  There’s an important election in the US in about five weeks.  And, there are more central banker decisions to come.

    However it unfolds, I’ll do my best to make sure that you see it coming.

     *  *  *  *  *

    We’re trying something a little different with memberships this month.  I’ve never been a big fan of trial memberships.  Too many folks sign up in order to get the info they need that day, then turn around and cancel a few days later.  But, I recognize the value of knowing what you’re getting into.

    The next 25 new members will get the first month of a Renewing Monthly Subscription for an effective $100 (normally $250.)  If it’s not for you, simply cancel.  If you like what you see, you can continue at the regular monthly rate or upgrade to a Charter Annual membership at the currently discounted price of $850 within the first 30 days.

    We’re phasing out Charter Annual memberships, in which the subscription price is guaranteed never to increase, on Oct 3 (existing Charter Members can continue to renew at their old prices.)  So, this is a great way to get an inexpensive peek and still enjoy big savings longer-term.

    For details and to sign up now, CLICK HERE.


  • Update on COMP: Oct 1, 2016

    awesomeEveryone’s heard of a double-top, or the even more rare triple-top.  How about an octo-top?  When it comes to the NASDAQ composite, the embodiment of “everything is awesome, so buy-buy-buy!” it seems it can’t get enough of its 5132 high from October 2000.

    This is one of those indices that shouldn’t even be charted anymore.  Its charts are that silly.  But, for those who are curious, read on.

    When we last examined it on May 16, COMP had undergone only 7 failed attempts to retake 5132.  It was hurtling southward in a reasonably well-formed falling channel, shown below in yellow.  But, it wasn’t as bad as it might have been.  At least the huge H&S Pattern targeting Armageddon hadn’t played out.

    The old expression “rising crude light lifts all boats” certainly applied here.  When CL bottomed and began its doubling on Feb 11, COMP caught fire.  The ensuing 18% rally, however, wasn’t able to break out of the falling yellow channel.  Caught between a rock and a bearish place, COMP was heading south, again, destined for an important test: the midline of a very large rising white channel.

    If they can hold it above the white midline, then the next upside targets are the bundle of moving averages at 4815ish, followed by the yellow channel top at 4950.  If it can break out, then new highs aren’t that far away.

    2016-05-16-comp-daily-hsIf, on the other hand, COMP breaks down below the white channel midline at 4673, the next support is the yellow midline around 4500, ideally in mid-June, followed by the red neckline at 4440-4480 and the previous low and white channel .236 line at 4116.

    As luck central planning could have it, the white midline held.  COMP bounced at 4678 (versus 4673) a few days later, and took another shot at breaking out of the falling yellow channel.  This one didn’t work either.  It shot up 11 points higher than it had in April… then plunged back below the white midline following the Brexit vote.

    In so doing, it almost reached the 4500 target we’d anticipated. It certainly would have made sense, as that was also the yellow midline, the red midline, and the (red) .618 retracement of the rise from 4209 to 4980.  Like I said, things are just silly with COMP.

    Apparently, everyone agreed that the departure of one of the largest and few remaining stable members of the EU simply wasn’t all that important.  Just as quickly, they decided that the midline breakdown didn’t matter.  COMP leaped back above the midline, the yellow channel top, and — drum roll please — the 2000 highs.

    continued for members...

    2016-10-01-comp-daily-1800To add insult to insanity, it went so far as to backtest 5132 in both August and September.  A backtest is supposed to be the final farewell as things hurtle skyward to unimaginable heights.  At 5312, COMP is 3.6% higher than the former highs.  So, presumably its new all-time highs will hold.  At least, that’s their story.

    What will it take for them to stick to it?  No exploding iPhones, for starters.  AAPL makes up almost 10% of COMP.  Throw in MSFT, AMZN, FB, GOOG and GILD and you’re up to over 25%.  In other words, if this very small cadre of stocks with PE ratios in nosebleed territory lose momentum, COMP will test 5132 again.

    Given that most of the gains since June were a function of higher oil prices and VIX suppression, COMP faces the same issues as SPX, DJIA, etc.  How will they keep all these plates spinning?

    Stay tuned.


  • A New Leading Indicator

    Our membership promotion has been extended through Oct 3.  Annual memberships, ordinarily $2,000, are available for only $750.  It’s a huge $2,250 discount off a year of monthly payments.  A Charter Annual membership, a little more at $850, guarantees your rate will never increase.  BTW, this is the last time we’ll be offering Charter Memberships. We’re also toying with the idea of reverting to monthly memberships only.  So, take advantage of this great pricing while it’s available.  To sign up now, CLICK HERE.

     *  *  *  *  *

    SPX reached our second downside target yesterday after the rising channel from Tuesday broke down at 1960.  It was clearly headed for 2138 when DB intervened.

    This is not a gimme, and is complicated by the fact the we have lots of potential support between here and there: e.g. the white .786 and .886 at 2148.20 and 2145.09.

    It got a reversal and 15-pt bounce on Deutsche Bank’s recovery back above 11.45, confirming DB’s role as a new leading indicator for stock prices.2016-09-30-db-5-0620

    Futures fell another 8 points after the close, only to recover 16 points as DB, CL and USDJPY all bounced after hours.  What real live investors took away, overnight, low-volume ramp jobs have once again restored.  Is this a great “market” or what?

    USDJPY, for example, dropped to our red TL, but not until after the close (and rallying 80 pips into the Japan open.)2016-09-30-usdjpy-5-0600

    This morning, ES is up 5 points, leaving SPX in limbo.

    continued for members(more…)

  • Timely Coincidences in the Markets

    With investors anxious over the meltdown of some of the biggest and systemically riskiest banks in the world, the “markets” needed some distractions.  First, Deutsche Bank rescue rumors started circulating, offering a little hope re our 2178 upside target.

    DB is up 7.7% off its lows, and 4.7% since our bottom call, so everything must be okay.  If CL and USDJPY cooperate by breaking out of their triangles, it will be.

    But, stocks were still slipping.  Perhaps investors questioned the DB deal, since Merkel had sworn, the day before, that Germany wouldn’t rescue it.  About that time, the EIA crude inventory report was released.

    After an initial spike, oil broke down through the bottom of its triangle.  I considered pulling the plug on our SPX upside target, but settled for revising it down to 2171.

    Then, quite by coincidence (not), the WSJ flashed a headline that the oil ministers meeting in Nigeria had a deal.

    “OPEC reached an understanding that a production cut is needed to lift petroleum prices…but, the Cartel will wait until November to finalize a plan to tackle a supply glut that has lasted longer than expected.”

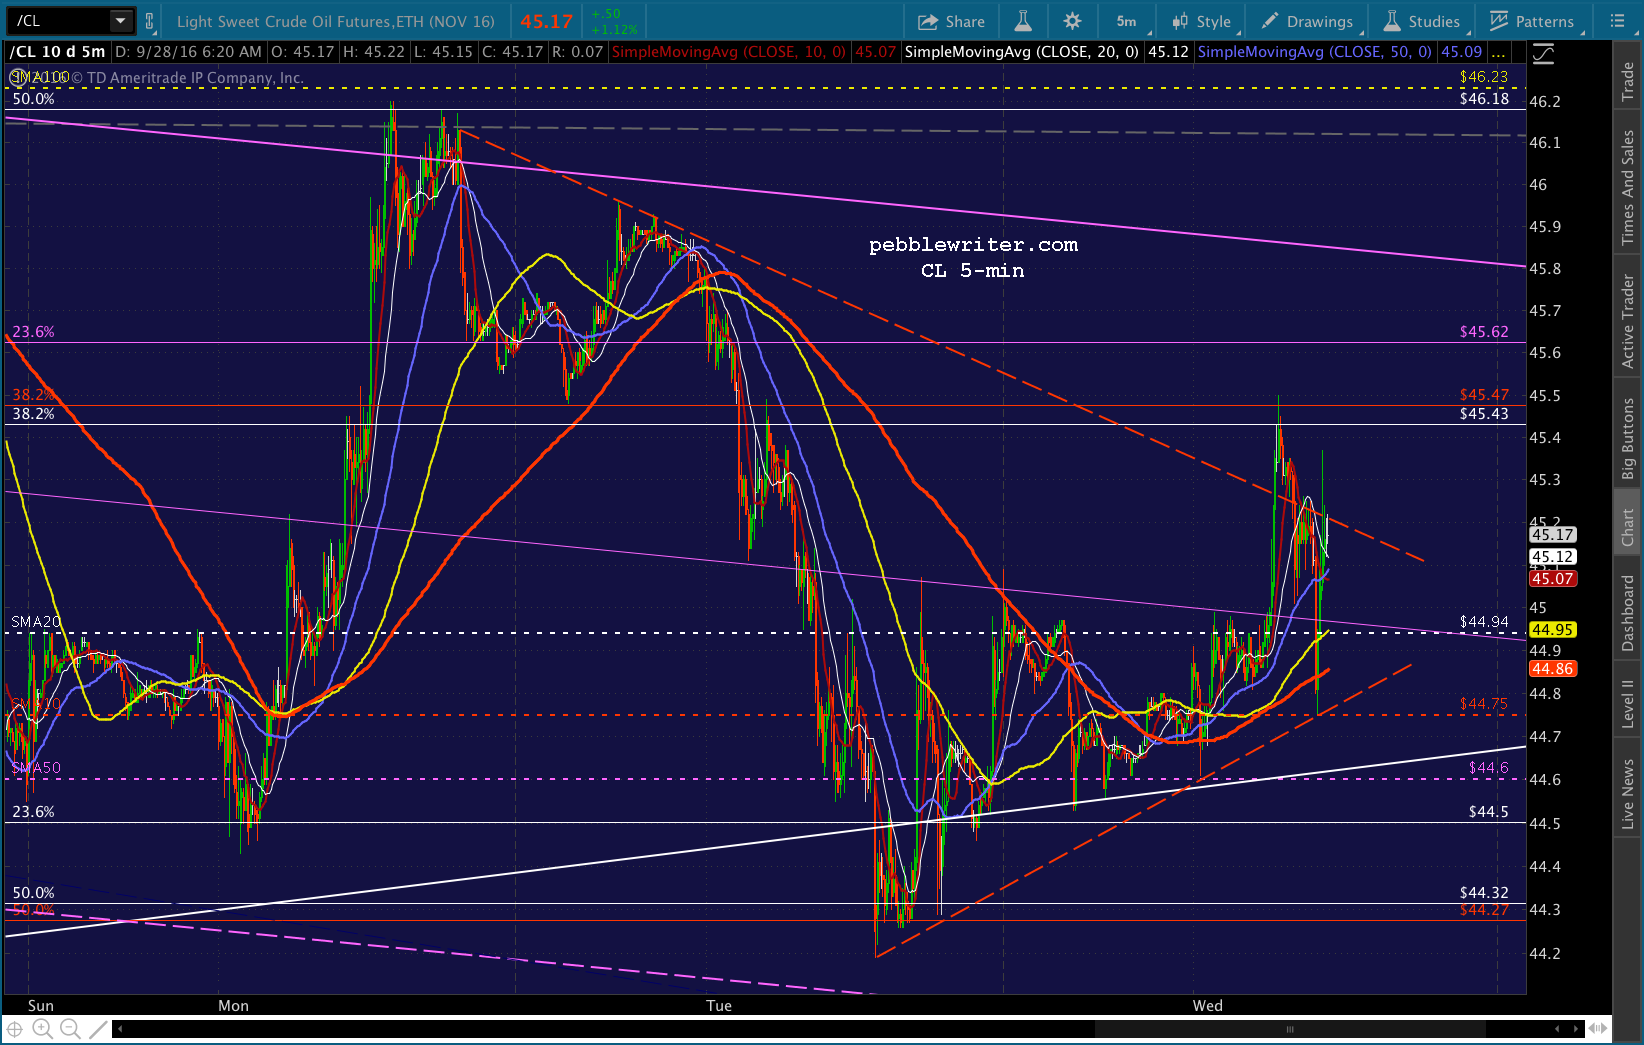
    2016-09-29-cl-5-0530Any formal agreement?  No.  Firm production limits?  No.  Timeline?  No.  The deal is about as solid as a New Year’s resolution to spend more time at the gym or cut back on drinking.

    But, the algos love this kind of stuff.  CL popped almost 7% off its lows, and SPX went up and tagged 2171 seven minutes before the close.  All’s well that ends well.  Or is it?

    continued for members(more…)

  • Don’t Worry, Be Happy

    With Deutsche Bank soon to be the beneficiary of both a fire sale and a government bailout, and the Saudi’s reportedly having become besties with Iran, last night’s 10-pt swoon in the futures has been erased.

    DB is up 7.7% off its lows, and 4.7% since our bottom call, so everything must be okay.  If CL and USDJPY cooperate by breaking out of their triangles, it will be.2016-09-28-cl-5-0605

    continued for members(more…)

  • Deutsche Bank: Will it Survive?

    We’ve talked about DB’s dangerously leveraged position.  From yesterday’s Trouble Brewing:

    Deutsche reported OTC (not total) derivatives in its 2015 annual report of €41.9 trillion, about $47.3 trillion in USD.  With Tier 1 capital of  €48.7 billion, this works out to a multiple of derivatives to Tier 1 capital of 861, or a wipeout ratio of approximately 0.11%.  In other words, a minuscule 0.11% decline in the value of DB’s OTC derivatives portfolio would wipe out all of its Tier 1 capital.

    Like every other bank, they’ll tell you the exposure isn’t that great, that almost all of their positions are offset by other positions — what they call “netting.”  Of course, we learned from Lehman, AIG and Bear Stearns that netting out the exposure for balance sheet purposes isn’t the same as eliminating the exposure.

    For a sense of scale, €41.9 trillion in 100 euro banknotes laid end-to-end would almost reach Mars.  So, it’s a relatively big number.  As I’ve shown in previous posts, DB isn’t exactly an outlier amongst its TBTF peers in this respect [see: Banks’ Wipeout Ratios.]

    But, I try not to pay too much attention to fundamentals.  In fact, in my 35 years of investing, I’ve never seen a bigger gulf between fundamentals and price action.  Let’s look instead at DB’s charts, which aptly illustrate the importance of the current stock price.

    Special thanks to consulting client A.C., which asked me to evaluate DB and authorized me to share these charts very quickly after delivering them.

    The close-up daily chart shows support at the bottom of a falling channel (in red) that dates back to Feb 9, about the same time that oil bottomed.  Makes me wonder what their oil exposure is…2016-09-27-db-daily-cu-0836

    If we pull back a little, we can see a larger falling channel (in purple) that contains the red channel.  Its bottom is much lower than current prices.  It’s not an outstanding fit, except for the fact that we have two good tags on its top and several on its midline — including the last downturn on Sep 9.  This is the channel TPTB don’t want to see play out.2016-09-27-db-daily-mcu-0838Last: the big picture, which illustrates how critical holding this morning’s low of 11.23 is.  If this channel dating back to 1998 breaks down, all bets are off.  The purple and gray channels take over, and DB goes the way of Lehman.  Of course, if that should happen, it won’t be the only bank going down the tubes.  Lots of counterparties amongst that $47 trillion in derivatives.2016-09-27-db-wkly-0840

    So, to answer the question “will Deutsche Bank survive” we have to ask:

    1. Are TPTB paying attention to these charts?  Based on the fact that every previous approach to the channel bottom resulted in a bounce, I’d say yes.
    2. Are they willing to do what it takes to allow a bounce here?  We got a hint, today, when stocks were slipping toward the May 2015 highs (yes, again) and a well-timed blurb appeared in the financial press stating that the $14 billion fine might be reduced if DB “cooperated.”   The algos love that kind of stuff.

    Fifteen years ago, I took some time off from Wall Street to try my hand at writing and producing film.  It might seem thoroughly unrelated from technical analysis, but it’s not.  I’m firmly convinced that much of what happens in the “markets” these days is scripted.

    If you want to know what’s going to happen next, it often helps to ponder what you would do if you were charged with propping up the markets — the unwritten mandate about which central bankers care most.

    I don’t think it’s overstating matters to say that Deutsche Bank’s failure would create another Great Financial Crisis.  I’m pretty sure the Fed, ECB, BoJ, BIS, and SNB know this.  And, I’m pretty sure people at each of those organizations have shown charts similar to mine to their respective bosses [if not, might I humbly suggest a subscription?]

    So, I’m pretty darn sure TPTB will step in and prevent DB from making new lows.  This makes it a “buy” here at 11.23, but with tight stops for obvious reasons.  Initial price target: 12.42 (+5.4%), followed by 13.02 (+10.5%) and 13.98 (+18.7%.)

    Stay tuned.

  • Important Support Just Below

    SPX nailed our first target yesterday, and came within inches of our second.  After the close, the futures collapsed and finished the job, only to soar after the debate results suggested that FOMC members didn’t necessarily need to start polishing their resumes.

    However, the news cycle came roaring back overnight.  Deutsche Bank apparently didn’t go away.  Oil producers have no interest in capping production.  And, Japan is still a mess.

    SPX is likely to tag our next downside target without any difficulty.  The question is whether or not it will stop there.

    continued for members(more…)

  • Trouble Brewing

    All eyes are on Deutsche Bank and Turkey this morning.  It’s been a while since I calculated wipeout ratios [see: Banks’ Wipeout Ratios], but DB is in worse shape than any of the other banks I looked at last year, with the possible exception of Goldman Sachs.

    wipeout-ratio

    Deutsche reported OTC (not total) derivatives in its 2015 annual report of €41.9 trillion, about $47.3 trillion in USD.  With Tier 1 capital of  €48.7 billion, this works out to a multiple of derivatives to Tier 1 capital of 861, or a wipeout ratio of approximately 0.11%.  In other words, a minuscule 0.11% decline in the value of DB’s OTC derivatives portfolio would wipe out all of its Tier 1 capital.

    Like every other bank, they’ll tell you the exposure isn’t that great, that almost all of their positions are offset by other positions — what they call “netting.”  Of course, we learned from Lehman, AIG and Bear Stearns that netting out the exposure for balance sheet purposes isn’t the same as eliminating the exposure.

    Turkey’s downgrade…what can you say?  Turkey’s a perfectly nice country with lovely people…and, an evil crackpot at the helm.  As we discussed in July [see: Turkey Sinks to New Lows], this was only a matter of time.

    This latest action, however, will turn the markets on Erdogan.  With no one to bully, hold accountable or throw into jail until he gets his way, this will cost him dearly.  Unfortunately, it will be the citizens of Turkey who ultimately pay the price.

    With the futures off 10 points and USDJPY and CL testing support again, one gets the impression that the rally is hanging by a thread.  That might be a slight exaggeration – but, only slight.

    continued for members(more…)

  • Update on USDJPY: Sep 23, 2016

    On Aug 30, with USDJPY at 102.47, we put a target of 104.24 on it, noting that it represented the top of a well-established channel and a key Fib level.2016-08-30-usdjpy-60-0600

    USDJPY obliged by tagging our target three days later, then reversing as expected.  At the time, there seemed to be considerable downside potential.  A client who actively trades the USDJPY asked for downside targets, and I posted this chart on the 6th.

    We were almost immediately rewarded with a drop to 101.19, “d” on the chart below.  The subsequent backtest came very close to tagging “c.”  Everything was going really well.2016-09-06-usdjpy-targets-1436

    Then, all of a sudden, it didn’t.  Nothing was happening.  USDJPY headed in the general direction of target “e”, but reversed on the 12th at a point that created a new, rising channel.  For another week, USDJPY angled higher, buoyed by suggestions that the BoJ would increase its easing.

    I didn’t’ believe the suggestions, as the BoJ has painted itself into a corner with respect to NIRP and currency devaluation.  As the latest policy meeting approached, I added some downside targets that equated those original targets “e” and “f.”

    The announcement was as obtuse and delusory as anything Draghi might have dreamt up.  But, cutting through the BS, there would be no additional easing — only an attempt to steepen the yield curve.  As it loves to do, the BoJ forced USDJPY higher in a self-congratulatory spasm, breaking out of the extension of its original falling channel.

    Holding short during that 30-minute, 1.77 spike would have required nerves of steel.  And, that was the point, right?  Stopping out those of us who saw the downside case as being obvious?

    By the time the dust settled, those price levels were as accurate as could be — even if it took a little longer than expected.  Total move, from 102.47 up to 104.24 and down to 100.09: 5.92.  A very nice 3-week return.  And, though it took more than a little patience, it was worth every sleepless night.2016-09-23-usdjpy-60-1047

    With the ECB, BoJ and FOMC all having trotted out their brilliant plans for a recovery (what’s the hurry…it’s only been 9 years?) we’ll take a look at what to expect next.

    continued for members(more…)

  • Catch Up Friday

    With our latest forecast well on its way to proving its worth, I’m going to take the day to catch up on some of the secondary charts that have been woefully neglected.  Today, the focus is on oil.  Will there or will there not be an agreement to cap production?

    Reuters suggested overnight that it was practically in the bag as long as Iran played ball.  This morning, we’re hearing that Iran has no interest whatsoever until their production has reached pre-sanction levels — if then.2016-09-23-cl-daily-0615

    After tagging our downside target twice in the past several weeks, oil is making a bid to break out of its latest falling channel.  Since it’s integral to our equity forecast, I’d keep a close eye on it today.

    Here’s a quick roundup of the other charts I’m watching.

    continued for members(more…)