Year: 2016

  • Charts I’m Watching: Nov 3, 2016

    SPX came within a couple of points of our next downside target yesterday, continuing to sell off in advance of the election and in response to oil’s and USDJPY’s swoons.  Futures are marginally higher this morning as the latest polls show a slight Clinton rebound.

    continued for members(more…)

  • What Works in Forecasting

    I’m traveling today, so there won’t be any intraday market commentary.  SPX hit our 2103 target yesterday and got an nice bounce.  All of our additional downside targets originally posted on Oct 13 [see: More Trouble for Mr Market] remain in place.

     *   *   *   *   *

    There are 100,000 new MBAs minted every year in the US.  We all read the same textbooks.  We all heard roughly the same lectures.  We all learned the same formulae.  So, where’s the collective groan over the disconnect between stock prices and, well, practically everything we were taught should matter?

    In 2011, all that great information began to matter less and less.  New, intrusive methods were used to prop up markets — and, I’m not just talking about QE.  I’d like to share with you today what happened, and why I think central planners are painting themselves into a corner from which escape will be difficult if not impossible.

    We have a lot of new members, so I’ll start from the beginning.  If I showed you a chart like this, would you have any trouble believing the target will be hit?  Of course not.  A trend line is the simplest and most reliable of all chart patterns.2016-10-31-tlWhat if, instead of a perfectly straight line, prices oscillated between two parallel lines — a channel?  It’s probably not too hard to accept, either.2016-10-31-chnl A rising, consolidating pattern of incrementally smaller price increases seems, on a gut level, to represent an impending top — which is exactly what a rising wedge portends.2016-10-31-rwLikewise, the failure of a stock to make a new high on the third try and subsequent dip below the trend line supporting it — a head & shoulders pattern — is considered a reliable bearish signal.2016-10-31-hsHarmonics takes more of a leap of faith.  But, after you’ve seen it work a few hundred times, it’s hard not to believe.  The Gartley Pattern promised a reversal at the .786 Fibonacci level based on the earlier reversal at the .618 retracement of the drop from 1576 to 666.  It worked nicely.

    2016-11-01-gartleySo did the Butterfly Pattern that played out at the 1.618 extension of the 2007-2009 drop.

    2016-11-01-butterflyIf we put harmonics together with other chart patterns, we can see how they work together to offer important clues as to market direction.2016-11-01-togetherThen, there’s my favorite chart pattern: the analog.  The 2007 top wasn’t that different from most.  The turning points came at logical places, and I’ve labeled them as to how many days prior to or after the 1576 top they occurred.

    2016-10-31-2007-08-analogAs everyone remembers, it resulted in a sharp downturn that lasted 17 months and sliced 57% off the S&P 500.2016-10-31-2007-2009Imagine my surprise when, in June 2011, I saw the same pattern setting up.  It suggested a repeat performance that, were it to play out the same, would have meant new lows for stocks.

    At the very least, it suggested a big drop, which I detailed in a series of posts leading up to the big event [see: Analogs.]  On July 21, I wrote: “1347 might be the last best chance at an excellent short.”  It topped at 1347 exactly, and 13 sessions later reached 1101.54.2016-10-31-2011-analogIt was both exciting and unnerving, as all those formulae and all those lectures never touched on anything like this- this- what the hell was it?  Black magic?  Witchcraft?

    Of course, I owe pebblewriter.com’s creation and subsequent success to this analog playing out and making a lot of people a lot of money.  But, there was a dark cloud behind the analog’s success.  It broke.

    2016-10-31-2011-analog-bustedI wish I could say I knew right away why it broke.  But, it would take me many months before I fully understood the mechanism and the degree of manipulation involved.

    Back then, even using the word “manipulation” was enough to make people slowly edge away from you at cocktail parties.  Talking about the yen carry trade would get the door locked behind you when you stepped outside for a moment.

    For the uninitiated, the yen carry trade might be explained from the BoJ’s standpoint thusly:

    You can borrow all the money you want at near 0% interest, and you can pay it back at a steep discount.  In the meantime, you can invest those borrowings in stocks that we guarantee will appreciate — because we’re buying them, too.

    yen-carry-tradeIt took a while to get going, but it worked like a charm.  When the USDJPY bottomed and started to break out, the analog was busted.  As USDJPY rose from 75 to 100, SPX ratcheted up to new all-time highs.

    There was a problem, however, with USDJPY’s continued rise.  Remember, as the yen gets cheaper, it buys less of those things that Japan imports — especially food and oil.  Oil was particularly a problem, as it’s priced in US dollars and the country had shut down all its nuclear reactors in the wake of the Fukushima disaster.

    2016-10-31-usdjpy-v-spx-birthSo, isn’t it a coincidence that oil began crashing on August 14, 2014 and USDJPY broke out on August 18, 2014?  The yen’s subsequent 25% depreciation was easily offset by oil’s 61.8% plummet.  And, it wasn’t even done.

    to be continued


  • October 2016 Results

    October continued the market consolidation that began in August.  Key considerations this past month included oil topping out, in line with our expectations [see: Welcome to Peak Oil], and USDJPY finally breaking out after nearly a year in the same falling channel.  And, of course, the upcoming election has had everyone on edge.

    Our theoretical long/short SPX portfolio came in at 11.28%, a 13.22% pickup over the S&P 500’s 1.94% loss. Our average since Jan 2015 now stands at 16.62% per month, versus 0.21% for the S&P.

    screen-shot-2016-11-01-at-10-52-32-amWe were able to continue decreasing the number of trade advices, averaging less than one per day for the first time in many months.  As I wrote last month, this will continue to be an emphasis for us.

    screen-shot-2016-11-01-at-10-24-35-amHopefully the market will cooperate.  One difference versus previous months was the reduced number of large overnight gaps.  We did a pretty good job of anticipating those that did occur.2016-11-01-spx-daily-plainToday marks the last day of our membership promotion, and is also the last day we’ll be offering annual memberships — at least, for a while.  To learn more and to take advantage of the discounts being offered, CLICK HERE.


  • Treading Water

    Final 24 hours for our membership promotion.  Beginning in a few days, we’ll offer only monthly memberships — currently sale priced at $150/month.  So, for the price of about 7 months, you can enjoy full access to pebblewriter for an entire year.  To sign up now, CLICK HERE.

     *   *   *   *   *

    CL nailed yesterday’s downside target and is getting a bounce, which is enough to trick the futures into a 5-pt gain just ahead of the open. 2016-11-01-cl-60-0600The questions are how big the backtest will be, and how long it will last.  We remain short from 2139.23 on Oct 27 [see: Distress Call] and yesterday’s downside targets remain unchanged.

    continued for members(more…)

  • A Dangerous Game

    When markets are propped up for an extended period of time, the risk doesn’t go away.  In fact, the postponement increases the tension such that the unwinding — the eventual return to stasis — is often more violent than would otherwise have been the case.

    With the US elections only a week away, we have to wonder what the unwinding will look like this time.  Combined with a changing of the guard in carry trade leadership, the next week should be quite interesting.

    We got a taste on Friday, when SPX nailed each of our downside targets — just, with a 14-pt rally thrown in the mix.

    SPX appears to have broken down.  The obvious levels to watch are the red .618 at 2130, the white midline at 2126, and then the red .786 and .886 at 2123 and 2119.

    Kudos to anyone who had the nerve to hang on to our initial short position.  We remain short from 2139.23 on Oct 27 [see: Distress Call.]

    2016-10-31-spx-5-0926continued for members(more…)

  • The Magic Fun House Market

    The economy is either growing rapidly or slowly.  Inflation is either spiking or disappointingly low.  Earnings are just great — except when they’re not.  Today’s “market” is like one of those carnival fun houses, complete with the curvy mirrors that distort reality — just, without the giggles.

    Futures sold off sharply after the close yesterday, and have since rebounded to a small gain that, at this moment in time, represents a backtest of the stubborn TL that served as support for two long weeks.2016-10-28-es-60-0559continued for members(more…)

  • Distress Call

    Yesterday started off well, with great calls early on (off a downside target of 2132.91, we went long at 2132.66 and took profits at 2145.65; the top was 2145.73.) The rest of the day was an aimless mess, as traders couldn’t make up their minds whether oil’s collapse or the barrage of bad DB news was more important than USDJPY’s incessant rise.

    Today, we have more of the same.  USDJPY is making new highs on no particular news other than the usual: SPX needs help.2016-10-27-usdjpy-60-0615 continued for members(more…)

  • The Big Picture: Oct 26, 2016

    Oil broke down as expected yesterday, leading stocks lower after a week of trying to retrace losses from earlier this month.  It occurred despite an impressive spike in USDJPY, which should be concerning to central planners.

    Since oil first peaked on Oct 10, equities have had a tough time of it.  As we discussed in Welcome to Peak Oil, it will continue to be a problem.

    2016-10-26-cl-v-es-60-0615

    We’ll take a look at why, and what it might portend for equities over the coming weeks.

    continued for members(more…)

  • A Day in Review: Oct 26, 2016

    This is an excerpt of the intraday comments and trade advices from The Big Picture posted on Oct 26, 2016.  I’m posting it here for those interested in how the site works and the types of information offered each day. 

    It was a good day — not the best, but not the worst.  We capitalized on a short opened the previous session at 2145.54, covering at 2132.66 for 12.88 points.  We rode the subsequent long position 12.99 points higher to 2145.65.

    Next came two attempts to play bounces at support that didn’t hold.  These cost us 0.91 points.  And, we closed out the session with a gain of 5.26.  All together: 30.22 points or 1.41% in our theoretical, unleveraged portfolio mirroring the S&P 500 index.

    Read on for details…


    Oil broke down as expected yesterday, leading stocks lower after a week of trying to retrace losses from earlier this month. It occurred despite an impressive spike in USDJPY, which should be concerning to central planners.

    Since oil first peaked on Oct 10, equities have had a tough time of it. As we discussed in Welcome to Peak Oil, it will continue to be a problem.

    2016-10-26-cl-v-es-60-0615We’ll take a look at why, and what it might portend for equities over the coming weeks.

    continued for members

    Today’s initial target: look for SPX to sell off to the purple .886 at 2132.91 this morning. Though, the channel bottom at 2131ish looks like a slightly better fit.2016-10-26-spx-60-0600CL is backtesting the falling white channel top, but has an EIA inventory report coming out at 10:30. 2016-10-26-cl-60-0600 And, USDJPY is trying to transition from the falling red channel into the rising white channel.2016-10-26-usdjpy-60-0605

    UPDATE: 9:37 AM

    SPX reached the .886, but could have a little further to go. I’d go long here with relatively loose stops. Targets: SMA10 at 2139.21, SMA100 at 2143.89, the white .786 at 2157.86, and the SMA50 at 2158.70.2016-10-26-spx-60-0636USDJPY has reacted off the rising purple TL — also the rising white channel midline. If it slips, the SMA10 is just below at 103.94.2016-10-26-usdjpy-60-0640Note that CL isn’t reacting much here at the channel top. If the EIA report echoes yesterday’s API, we can expect to see it break down, taking stocks with.2016-10-26-cl-60-0641UPDATE: 10:33 AM

    Pretty positive report, as enough to get CL up to backtest its neckline. If it can pop through, even for a little while, this would help stocks greatly. USDJPY is also ramping…just because.2016-10-26-cl-60-0732 2016-10-26-usdjpy-60-0734 2016-10-26-spx-60-0734

    screen-shot-2016-10-26-at-7-32-11-am

    UPDATE: 11:07 AM

    SPX just shot up to our second upside target — the SMA100 — and is approaching the two midlines and the SMA5 200 and the red .618. I’d take profits here and wait for the short term SMAs to catch up.

    2016-10-26-spx-5-0807

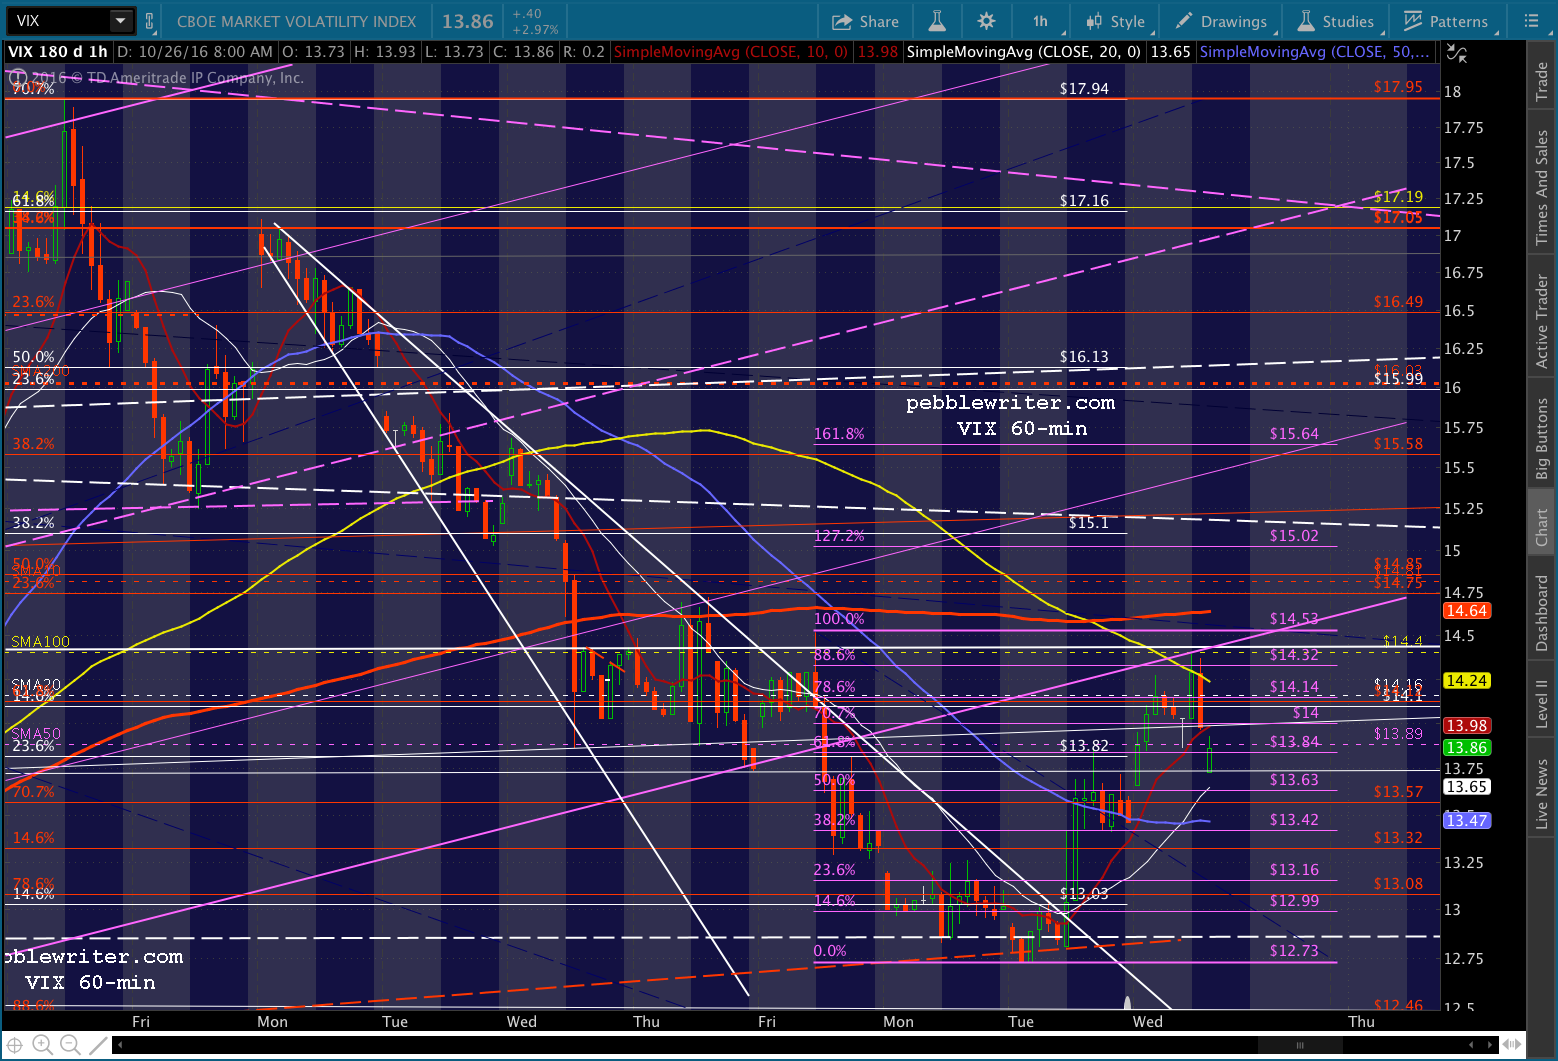
    2016-10-26-cl-60-0806 2016-10-26-vix-60-0805

    UPDATE: 12:09 PM

    Back to long here at 2142.39, as SPX is sort of backtesting the falling white channel. More importantly, it has support from the SMA5 20 now. Obviously, the lack of a full backtest means it might not take off at this very point. I can imagine it dithering around and backtesting the SMA10 at 2139.21, as the upward trajectory if it rises from here gets SPX to 2157-2160 a little too soon.

    2016-10-26-spx-5-0909

    UPDATE: 12:29 PM

    Losing ground here. Back to cash at 2142.54, as it appears we need more of a backtest.2016-10-26-spx-5-0934USDJPY is ramping like crazy, but just ran into its .618. 2016-10-26-usdjpy-5-0936Together with CL’s continuing weakness, it’s not enough to turn SPX right now.2016-10-26-cl-60-0928UPDATE: 1:15 PM

    Backtest and SMA10 in one. Long here at 2139.19. The bulls really need this to hold.2016-10-26-spx-5-1015Note that VIX has reached its SMA100 — should see a sharp reversal.2016-10-26-vix-5-1017I’d say we should see DB pop up to 15.04 on a backtest of the broken white channel while tagging the red channel top again. But, the news hasn’t been very positive today, and Q3 earnings are due out tomorrow…

    2016-10-26-db-60-1022UPDATE: 1:42 PM

    It’s not holding. Back to cash here at 2138.13. 2138.04 should be support. But, if it were, 2132 would have held on ES and VIX wouldn’t have just made a new high, and USDJPY wouldn’t be swooning. Now, I’m wondering if we’ll get the white channel bottom tag we should have made this morning. It didn’t miss by much, but maybe it was enough to require another leg down. If SPX can hold 2138, I’ll get bullish again (at least, for 2157.) Otherwise, the sidelines seems like a very reasonable place to be.2016-10-26-spx-5-1042

    2016-10-26-vix-5-1044 2016-10-26-es-5-1043 2016-10-26-sudjpy-5-1047UPDATE: 2:10 PM

    I’ll take another shot at a bounce here off the 2134.72 2015 high. Back to long at 2135.36 with tight stops.2016-10-26-spx-15-1109DB is testing its SMA5 200 on a TL from Monday night’s lows. Perhaps it’ll get a bounce here.2016-10-26-db-5-1116If SPX doesn’t hold, ES suggests a sell off of another 14-17 points to ES 2117 or 2112, about 2119-2122 on SPX.2016-10-26-es-60-1117UPDATE: 3:50 PM

    Back to cash here at 2140.62.

    2016-10-26-spx-5-1250Maybe there’s more upside ahead, but momentum looks really lousy here. So, this is either a real good head fake, or some amazingly positive news will come out in the next few hours, or VIX is about to get hammered…or, there’s more downside to come. We’re still up handsomely, so I’d rather bank that and not have to worry about it overnight.2016-10-26-vix-5-1251

    2016-10-26-cl-5-1254 2016-10-26-usdjpy-5-1253

  • Seen This Movie Before

    As CL continues to tread water, USDJPY is doing its best to pick up the slack.  But, investors know the yen carry trade is a mere shadow of its former self.

    Kuroda’s most recent comments reveal the BoJ, like the ECB, has lost the ability to make us believe.  It is reduced, instead, to blatant currency manipulation.  Now, even that manipulation has become suspect.

    Here’s the breakout which is supposed to have bulls jumping for joy.  Futures have responded by giving up 7 points from their overnight highs.  Why?2016-10-25-usdjpy-60-0610

    continued for members(more…)