

We’ve been accurately forecasting USDJPY for over 12 years, starting with recognition of a falling wedge that yielded a huge breakout in 2011 [see: USDJPY – How Low Can it Go?] and evolving to an understanding of the importance of the Yen Carry Trade.
The Japanese economy is a hot mess, but the chart patterns have been fairly easy to discern. When there’s any doubt, remember two principles:
(1) The BoJ will do whatever it takes to keep stocks on the rise.
(2) Ignore any other principles.
So, when a channel breakout occurred in March 2021 [see: USDJPY’s Turn] in the wake of the 35% Covid crash, we were right on top of it.  Likewise, we could see the ginormous Inverted Head & Shoulder Pattern coming from a mile away. USDJPY zipped up through the “resistance” and has tagged every target we’ve set for it. It has further to go, though the path should continue to confound everyone but chartists.
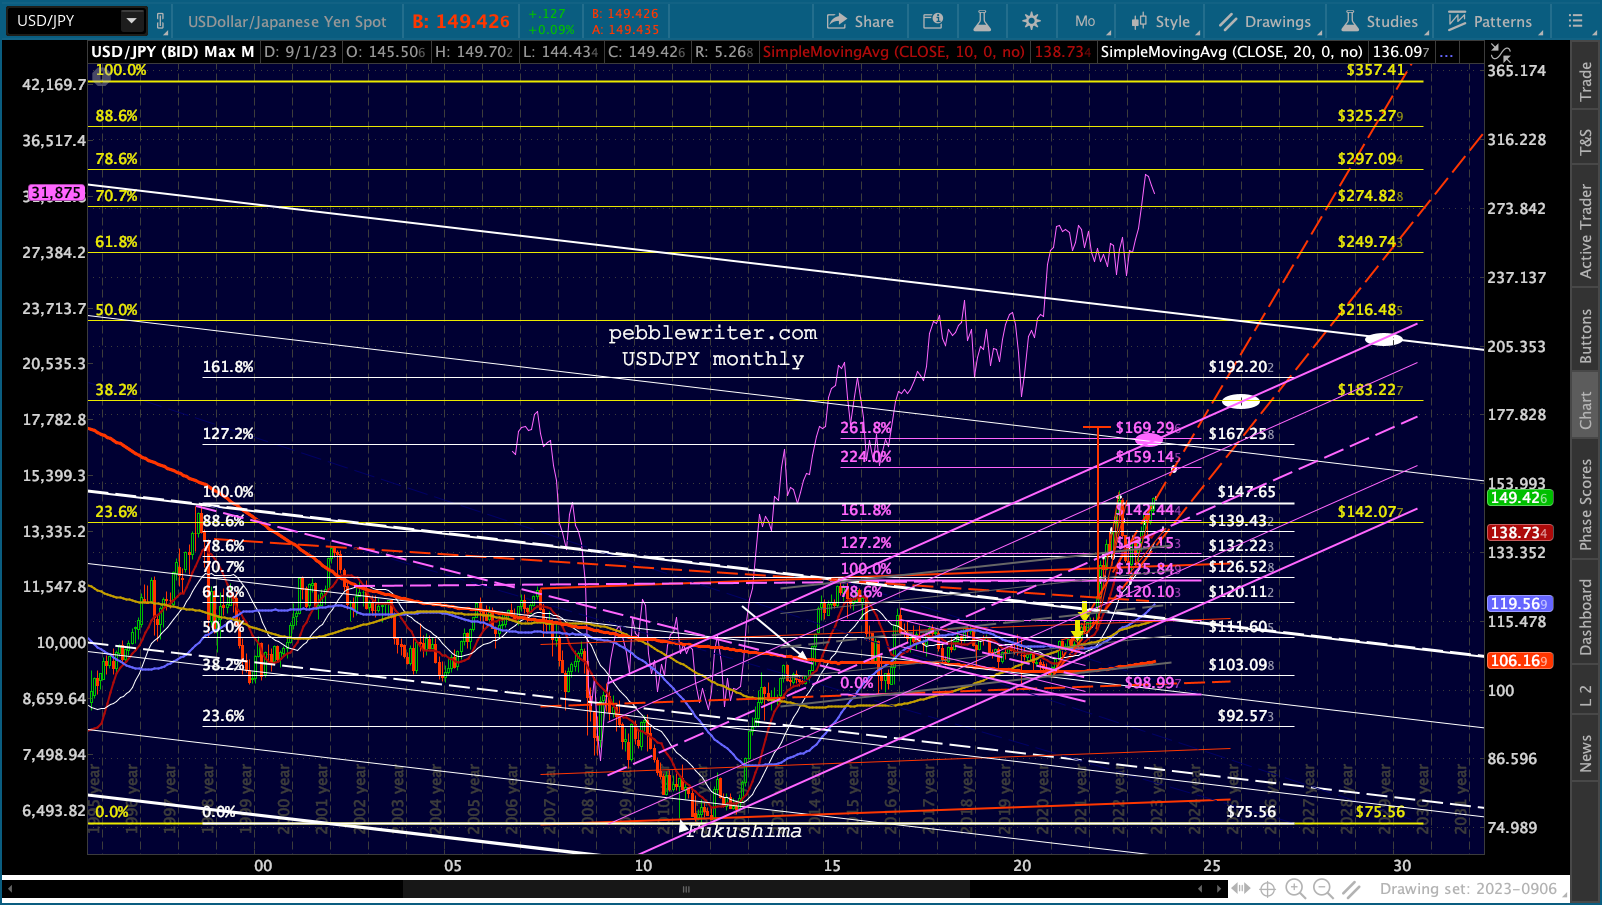
 continued for members…The big patterns are ridiculously easy to see: The huge falling white channel and the rising purple channel. The top of the falling white channel will eventually be reached, and it will likely happen at the top of the rising purple channel, if not sooner.
 With any luck, it’ll also intersect with a major Fib level such as 167-169, 183.22, 192.90 or even 216.48. FWIW, the IH&S points to 176.12ish.
 Theoretically, a currency’s value relative to another is a function of creditworthiness, interest rates, and economic outlook. But, again, the BoJ cares mostly about their stock market.
Given that the NKD has broken out of the falling white channel, backtested it twice, backtested the rising purple channel, is supported by the rising white channel midline, and barely reacted at the yellow .224, we can assume that this is a potential line in the sand.
If it weren’t for the rapidly approaching SMA200, I’d say that 31000 is safe. A dip to the SMA200 could occur at any time, however – a minor 6% drop from today’s close but 12% from the 34030 highs. It’s a crapshoot whether a decline would make sense now or they wait for the SMA200 to get closer around the end of the year.
 A break below today’s 31745 lows would present a call for action, meaning the USDJPY would likely spurt up past the 147.65 previous high and make a beeline to 159.14 or 167.25. A drop back below 147.65 should be sold as the USDJPY’s SMA200 (currently 138.04) would be the presumed target.
DXY has been making great strides, pushing up against the white channel midline. With US inflation sneaking higher, it’s likely to maintain its momentum – supporting a higher USDJPY.
 Of course, the potential US government shutdown which has (so far) kept the 10Y from tagging our 4.755% target is a wild card that’s very hard to predict. Although I expect the shutdown to occur and the market to sell off sharply next week, I would thus hold off any directional bets on currencies unless you’re a speculator with money to burn.