

It was a nice try, but yesterday’s early morning ramp job fell apart in spectacular fashion. It’s ironic that the decline is being led by the same stocks which promised a moon shot.
As we discussed last week, FB’s drop below its SMA200 and .786 channel line was poison for the overall markets [see: Facebook Flops.]
 So was the yield curve’s plunge through double support [see: Yield Curve – a Closer Look.]
 TSLA’s head on collision with reality was icing on the cake.
  TNX has finally complied with our forecast, plunging through horizontal support yesterday. By waiting, of course, its trend line of support doesn’t represent much of a move any more.
  As such, DXY has been able to put in a decent rally — aided, of course, by a healthy flow of funds fleeing equities.
Our downside targets remain in place. I’ve even added a worst case target that some might find surprising.
continued for members…
Much of the ultimate downside will depend on TNX and DXY. The bigger picture shows considerable dead space if the purple TL is broken.
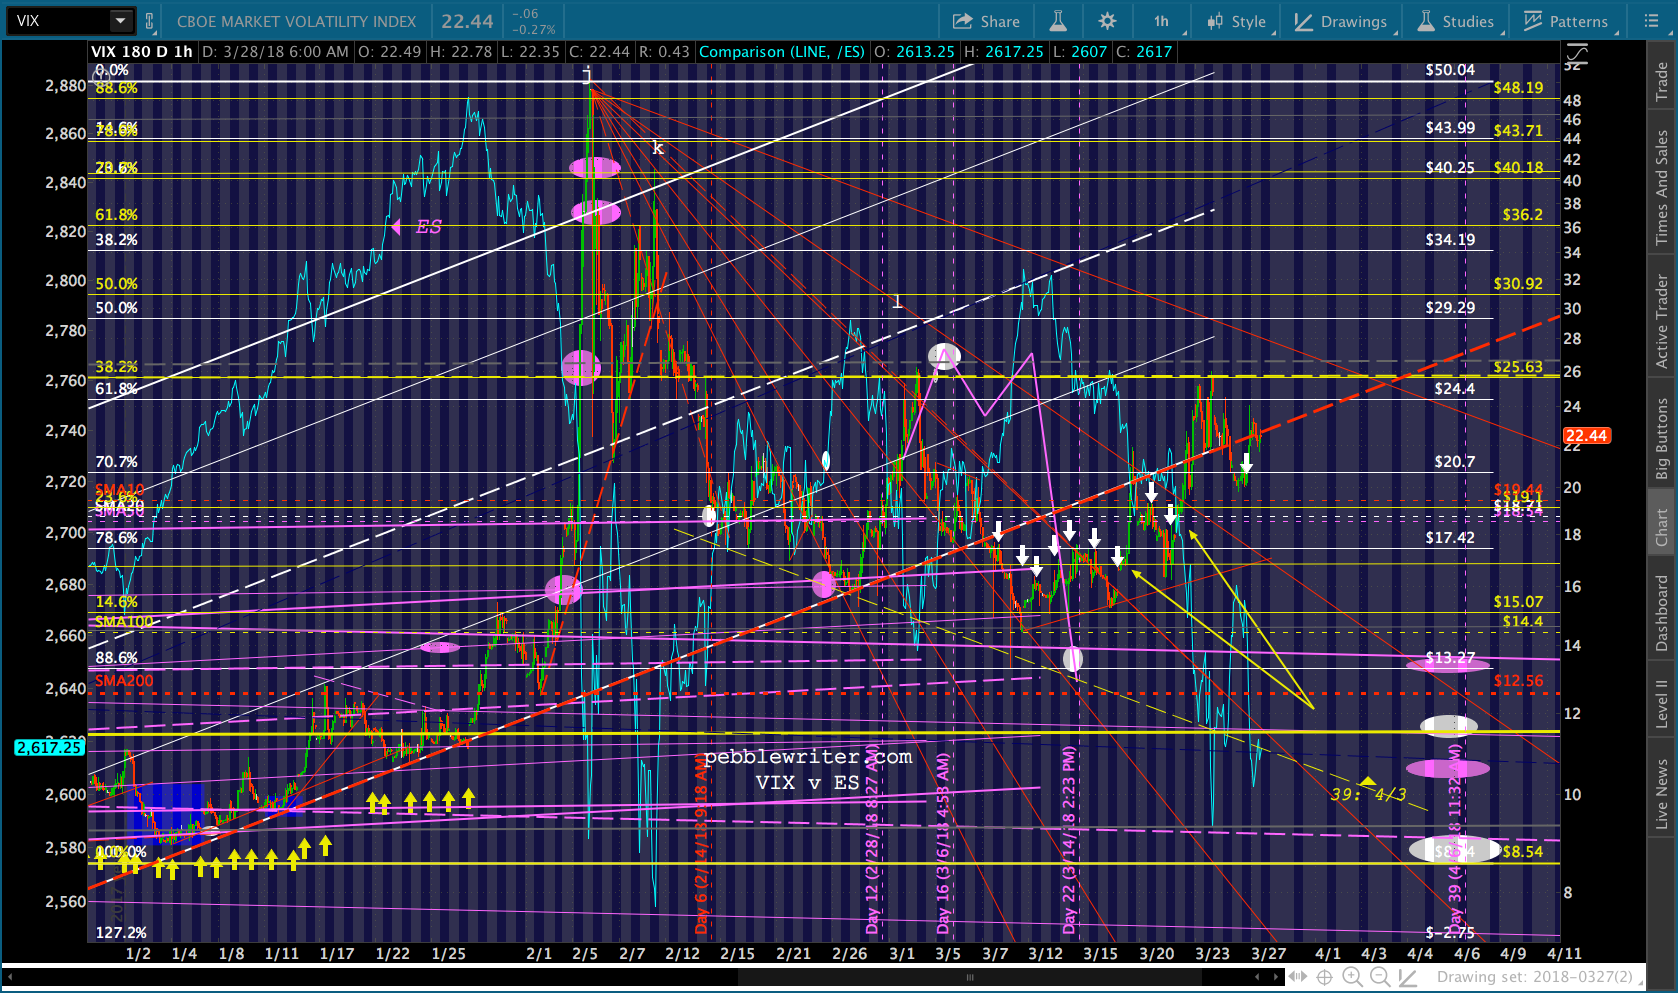
 And, of course, we’ll keep an eye on VIX — which is speaking volumes by not plunging from the channel bottom, the line in the sand for bulls/bears.
 About the only thing propping stocks up at this point is USDJPY — which is backtesting the white channel midline. If it doesn’t pop through, the assist will be temporary.
 I haven’t felt this surprised by a lack of supportive algo response since the second leg of the 2015-2016 correction. In the end, that exercise was all about putting in a proper A-B-C corrective wave that would terminate at the 1.272 Fib at 1823 — which it did.
That particular drop allowed SPX to also backtest an important channel line – the midline of the rising purple channel from 2009. In fact, the second plunge went past the midline in order to tag the 1.272.
At present, of course, the next lower major Fib level is the 1.618 at 2138. We never had a proper backtest of it. The purple .236 line passes through it in mid-April (ideally, Apr 13, right after CPI confirms stagflation?)
Note that the gray internal TL from the 2002 lows, 2011 highs, and 2016 lows passes through about that same place. The purple channel bottom passes through it in late Feb 2019.
 Now, before all you bears out there get all excited about a drop to 2138, let me remind you that there’s a more bullish narrative represented by the yellow channel shown below.
 This particular channel suggests a more modest additional drop to 2500, not far from the purple midline around 2450-2500. And, it’s good to recognize that SPX often doesn’t backtest important levels — such as the failure to decisively backtest the former 2007 high of 1576 (thank you, Bullard.)
 Bottom line, just because it would fit better doesn’t mean all that much in a world where TPTB manage the process. I think the purple channel is a much more legit fit, but I can understand why TPTB might wish the yellow channel to prevail.
Allow me to don my tin foil hat and delve into conspiracy theory politics. Whatever your feelings about Donald Trump, many observers have posited that the so-called “deep state” is not happy with him. The liberals just plain hate his guts, and the far-right think he’s too soft. Might a return to 2138, where SPX was when Trump was elected, help punctuate the narrative that he needs to go?
If I were a deep-state king for the day, I’d make sure he was out of office asap, as the primary season for congressional elections is here. There are a little over seven months left, and Republican incumbents have not fared well with Trump in the White House.
The rally following his election was, IMO, fueled primarily by algos driven by currencies, oil and VIX. The MSM, of course, credits the pro-growth policies, tax cuts, etc. of Trump and his merry band. What better way to force him from office than to let the market head back to where it was when he was elected?
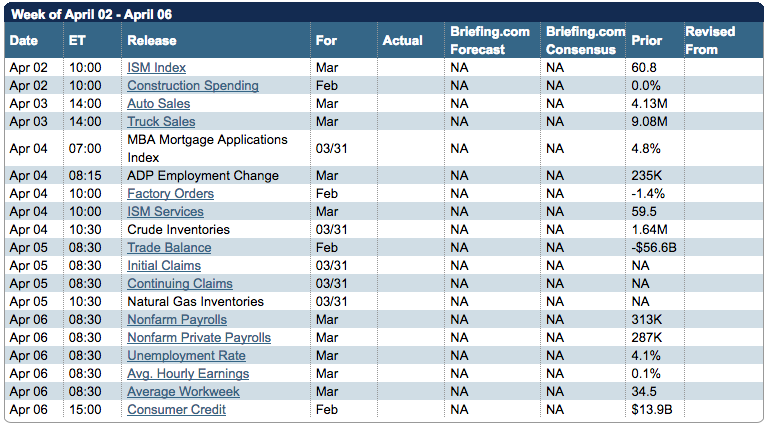
If it is allowed to decline in line with the falling white channel towards a Feb 2019 backtest, it would certainly not help any Trump-supporting incumbents come November 2018. Just thinking out loud…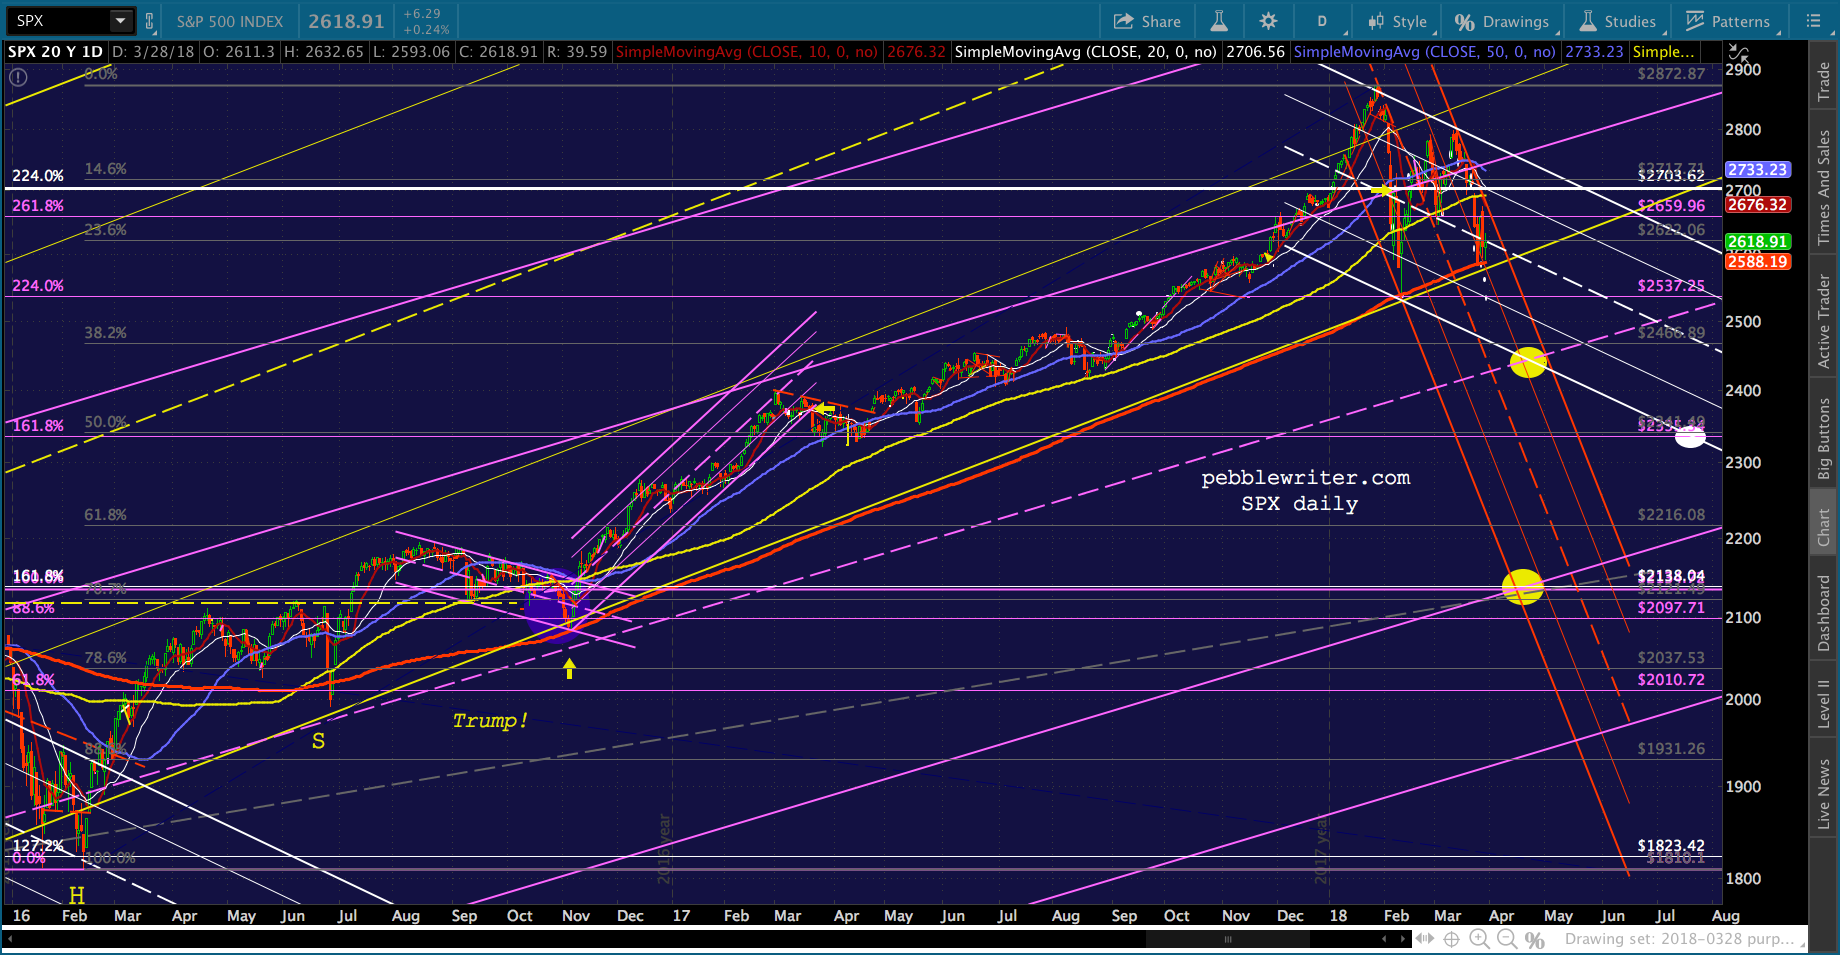 There is a clear path to 2138 on Apr 6 (our analog’s Day 39 – yes, it often works that way) that could be driven by any number of catalysts – political and otherwise.
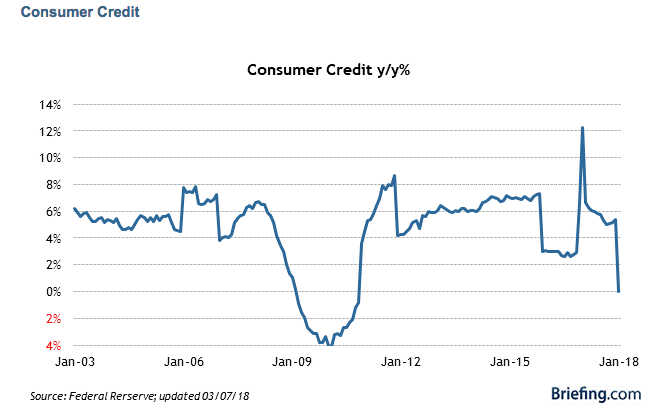
 I’m especially interested in consumer credit, which at last check was about to turn negative.
 Obviously, a 18.5% drop from here (25.5% from Jan highs) is a stretch. We haven’t had a drop of that magnitude since the 21.6% plunge in 2011 or the 17.2% correction in 2010. So, I wouldn’t bet the farm on it. Still, it “bears” watching, especially if SPX drops through its SMA200 again.
Okay, I’m putting my hat (and, all that crazy talk) back in its special cupboard. What do the charts suggest? These are what I started out with this morning. The yellow channel bottom is a questionable fit, but it suggests new lows.
The purple midline, on the other hand, is a pretty good fit. It cuts through 2461, pretty close to the C=A extension and the purple 1.272 sometime in the next week or so.This relies, of course, on SPX breaking down below the purple .886 Fib and the Feb lows.
If the midline breaks down, then there’s not a lot of support except the purple 1.618 Fib at 2335 before reaching the 1.618 at 2138.


UPDATE: 3:45 PM
In looking at TSLA and FB breaking down, and VIX accelerating to the upside, and the substantial drop that TNX and DXY could make, I find it pretty easy to get bearish. But, I’ve been here often before, and know that a drop of that size will only happen if TPTB are either okay with it or are unable to stop it.
 The latter is possible if, among other things, VIX breaks again, oil and gas plummet, DXY and USDJPY crack, or TNX plunges to 2.5%. All of these things are, in fact, overdue. But, it’s really difficult to know whether TPTB will allow them or even encourage them.
About all I can do at this point is encourage members to be vigilant, watch the support levels, and be ready to jump on board if/when broken. Those tempted to take a big, short position right here would do well to remember how often great short setups have been dashed over the years.


 GLTA.
GLTA.
Comments
2 responses to “More Where That Came From”
This will be some margin call to unwind. AMZN breaking down is probably more important than FB, but they are all getting hit. It’s about time!
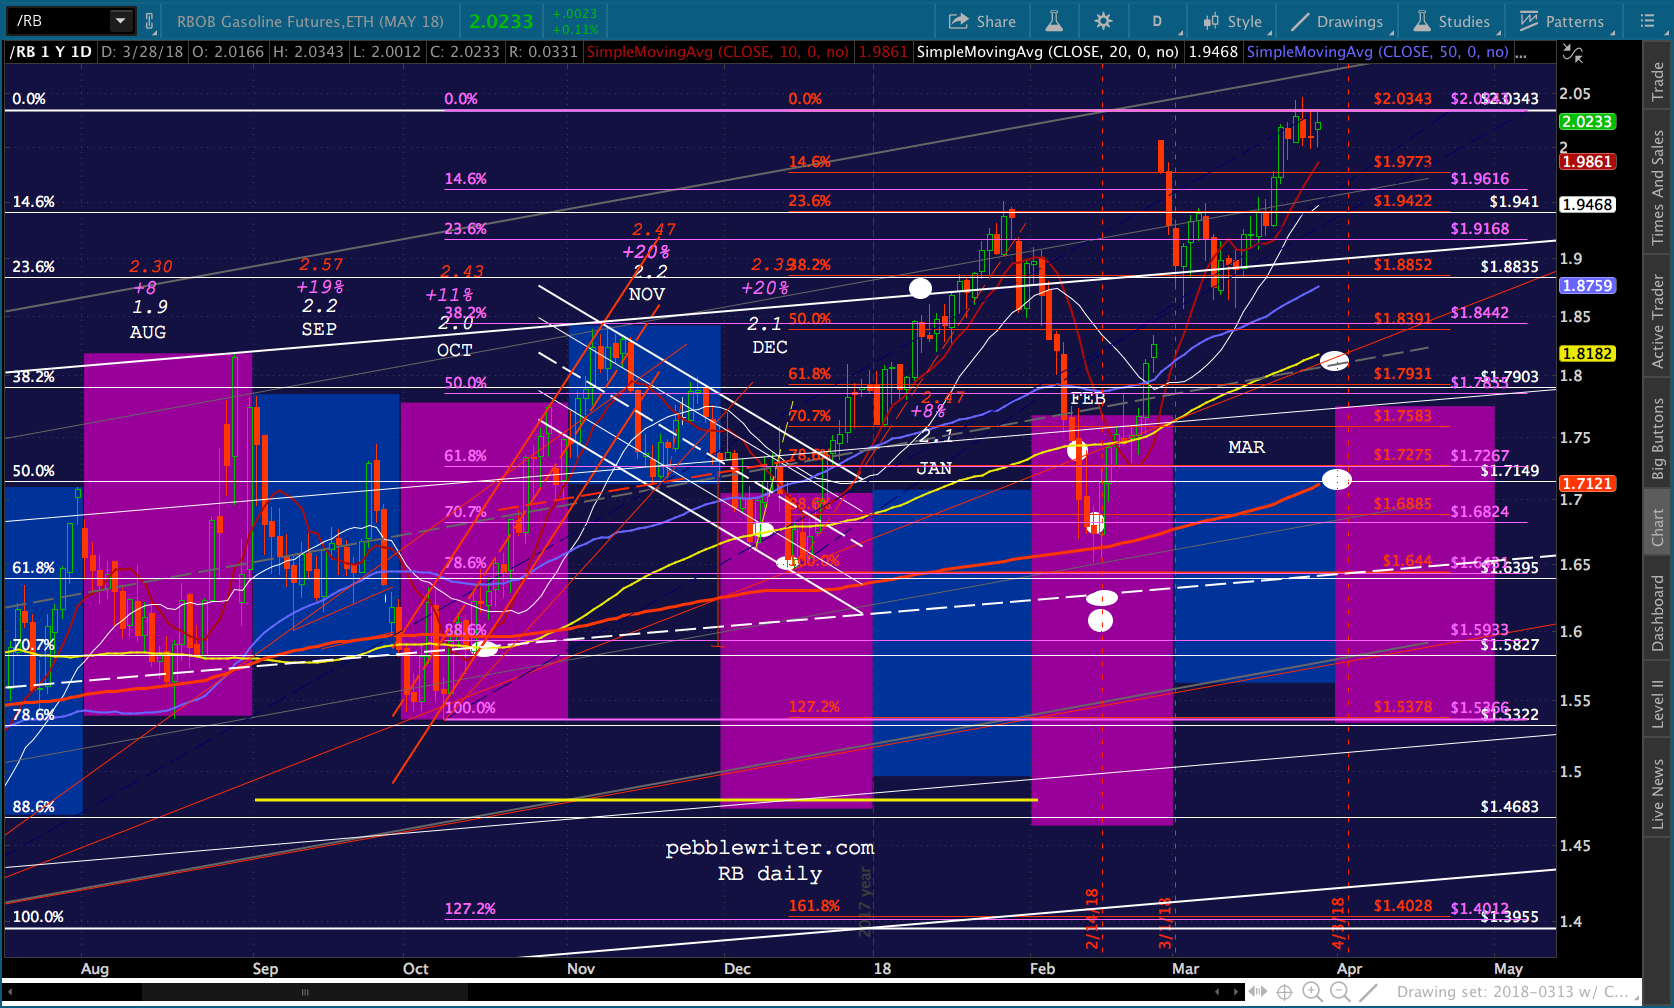
PW, yesterday you said you were working on “model for CL and RB price targets utilizing CPI data”. Is that model for CL related to your latest “Trump trade?” forecast?
Thank you!