The approach of the FOMC meeting which begins today has been very good for stocks. There’s nothing unusual about this. Like OPEX dates, stocks almost always rally into such important lines in the sand.
Most investors have lost track, however, of the fact that stocks have usually declined after such meetings.With SPX a few points away from an important Fib extension, will this one be any different? continued for members… (more…)
Housing starts and permits both fell, with starts missing expectations by a mile. Philadelphia Fed index also fell and saw a big miss. Capacity utilization and industrial output both missed and fell. So, naturally, the OPEX-obsessed S&P 500 futures are up 10 points.
If things seem a little upside down at this point, know that this will pass very soon. If only Grandpa Kudlow’s diatribe would…
More fun and games from the market-rigging department…
If SPX’s rally has impressed you, check out the Nikkei. Since its Aug 26 lows, NKD is up a whopping 13.8% — more than twice SPX’s impressive 6.0%.Do what I did and google “Japan” and “economy” for the past month and you’ll see nothing but negative stories including this one which confirms a “worsening economy” even before the effects of the recent 25% increase in the consumption tax have been absorbed.
So, why the 13.8% rally? Unlike the Fed, the Bank of Japan makes no secret of the fact that it buys stocks. In fact, the BoJ and the government pension fund are the two biggest owners of stocks in the Nikkei 225.
Thanks to negative rates, investors pay the BoJ to hold their cash. So, it costs the bank nothing to buy up everything in sight. All they have to do is make sure the stocks never decline in value. This is accomplished in two ways: (a) buying more stocks (throwing good money after bad); and, (b) by manipulating the currency (the yen carry trade.)
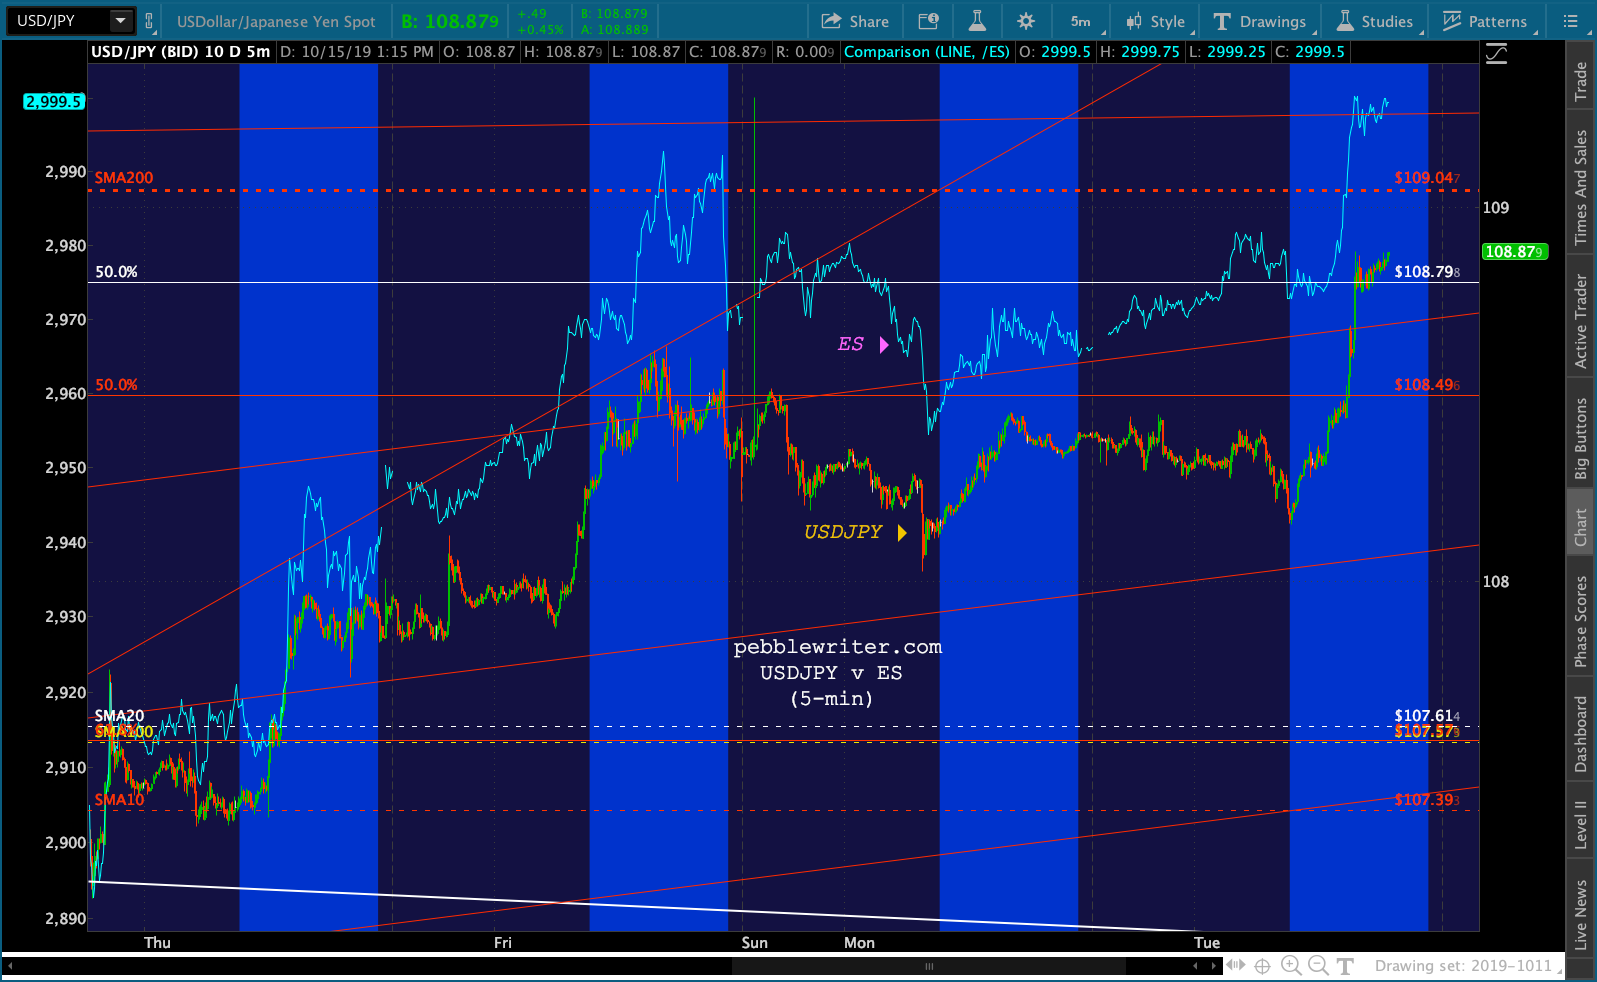
Lately, the yen carry trade has been working overtime. At some point the yen could theoretically get too cheap; so, the USDJPY is reset lower most nights when the low-volume futures markets are more easily propped up.
When the cash market opens, though, the USDJPY takes off. I’ve highlighted the period between 6:30am and 4:00pm in the chart below. The effects on the NKD are immediate. A few nanoseconds later, the S&P 500 futures join in. The algorithms which drive 90% of all US equity volume watch USDJPY like a hawk.
What happens if, for some reason, the USDJPY can’t be driven any higher or is busy resetting when extra assistance is needed? We’ve written often about the benefits derived from hammering VIX futures. Another favorite of central banks is oil futures.
As the chart below shows, it works exactly the same way as the yen carry trade. The only difference is that higher oil prices reverberate through the real economy, affecting nearly every business and consumer in fairly short order. So, the manipulation requires a little more finesse. The Fed has its own trading desk, presumably with the ability to dabble in the futures market. Their cost of funds is essentially zero as they can print money any time they like. Imagine how fun it will be when interest rates go negative and investors pay them to drive stock prices higher.
In The Matrix, Morpheus presents Neo with a choice between a red pill and a blue pill and explains:
You take the blue pill, the story ends. You wake up in your bed and believe whatever you want to believe. You take the red pill, you stay in Wonderland, and I show you how deep the rabbit hole goes.
Neo chooses the red pill, of course, and suddenly realizes that the world he has known as reality is a virtual reality construct used to pacify humans who serve as organic batteries (for the machines which are really in charge.)
They’re doing what!?
I couldn’t help thinking about Neo’s awakening yesterday as I witnessed Kelly Evans, one of CNBC’s more intelligent hosts, come to grips with the market’s reality: it’s a construct used to pacify investors who might otherwise question its inexplicable moves.
Ms. Evans was clearly shocked at the market’s sudden reversal after plunging in the wake of very disappointing PMI data. She seemed bewildered by the apparent machination:
The president seems to be watching this very closely and to be kind of intentionally — look, I’m just going to call it as I see it — be intentionally coming out with a positive headline every time the market slides the way it did.
Even tomorrow’s jobs report, if it’s terrible, should we expect then some further reports about some trade breakthrough with China? …Is it as simple as the data was terrible and then the president came out and had some positive commentary on China and that was all people needed to hear?
The timeline of events illustrates just how ridiculous Kelly’s suspicions regarding Trump’s intentional intervention are.
10:00am – ISM non-manufacturing PMI released and disappoints
10:01am – SPX plunges 22 points in the first minute
10:07am – SPX registers a 1% loss on the day
10:08am – SPX off 1.09% when everything reverses, heads higher on the day
10:35am – Trump stops for some “chopper talk,” briefly mentions upcoming China talks
By 10:35am, as Trump suggested to incredulous reporters that China should also investigate Biden, SPX had already rallied 25 points. Trump’s comments came 27 minutes after the 10:08 reversal.
It wasn’t ridiculous that Trump would try and prop up the market with another spurious China remark. He does it all the time.
What’s ridiculous is that the market was so easily “rescued” by manipulating the algos into buying everything in sight. I wrote last week [see: The Big Picture] how spikes in oil, gas and USDJPY and especially breakdowns in VIX cause stocks to rally on demand by sending powerful signals to algorithms which are programmed to notice such things (e.g. volatility is plunging, must be time to buy!)
Maybe it was the BoJ. Maybe it was the ECB. Maybe it was the Fed. Remember what Fed Governor Robert Heller argued in a WSJ article in the wake of the 1987 crash, suggesting that the Fed not only had the ability to prop up stocks but should not hesitate to do so.
But wouldn’t it be more efficient and effective to supply such support to the stock market directly? Instead of flooding the entire economy with liquidity, and thereby increasing the danger of inflation, the Fed could support the stock market directly by buying market averages in the futures market, thus stabilizing the market as a whole.
Maybe it was a major bank, brokerage firm or hedge fund caught on the wrong side of a huge trade and just wanted to postpone the plunge until after all those put options expire today.
It doesn’t really matter. What matters is that it has become this easy to force the market to turn on a dime. Sometimes I involuntarily wink when saying the word “market.”
Did I mention that everything reversed precisely at 10:08? See if you can spot the pattern.
SPX
ES
CL
RB
NKD
USDJPY
TNX
The lead factor, in my opinion, was VIX which spiked 7.5% in the minutes following the ISM report. It topped out at exactly 10:08 at 21.44 — only slightly lower than Wednesday’s highs — and was then relentlessly crushed. It made seven successive lower lows in the process of shedding 11.2% by the end of the session.
Ordinarily, VIX alone would be enough to stave off a significant drop. In this case, though, everything else reversed at exactly the same time — seconds after SPX had registered a 1% loss.
A fluke, you ask? If you’re wondering why futures are higher after this morning’s lackluster jobs report, check out VIX’s latest “breakdown.”
BTW, don’t bother looking for Kelly’s segment online. I’ve checked, and it’s buried somewhere deep and dark. Welcome to the Rabbit Hole, Kelly.
ES spent 6 1/2 hours yesterday anguishing over the trend line/neckline we discussed. When the Fed minutes came out, it even broke down a bit from the rising channel it had constructed overnight. The breakdown seemed like it was sticking. But, just after the close, WTI spiked and VIX dumped. That’s all it took to put ES back into bullish mode, prompting a 21-pt pop which fell apart overnight but is back in place as we approach the open. Meanwhile, VIX has constructed a little TL which could break down any minute and boost the algos if they should need help. But, what if it holds? (For the answer, see yesterday’s: This is a Test.)
A reminder: our current membership promotion — which slashes the price of a quarterly subscription from $399 to only $299 — is slated to expire tomorrow, July 23. For details and to sign up now, CLICK HERE.
* * *
BA has just about reached our channel top target from Jul 3. From Algos to VIX:
BA’s [chart] indicates another interim bottom.
It has now bounced over 12% since our Jun 3 bottom call signaled by ES’s 2.24 tag and has nearly reached the top of the new, gentler falling purple channel, now at about 380. It’s an important test for the stock — boosted by a monumental PR and its on-again off-again stock repurchase plan.
Note that the current forecast page has been updated for all major charts including
We would almost always expect a big bounce off SPX’s 200-day moving average. Despite yesterday’s dip below the 200-DMA, the index dutifully crept back above it in time for the close. And, the futures are currently showing an 8-point gain.Yet, if an analog I’ve been watching and our yield curve model are correct, this bounce won’t last. Stocks could be sharply lower by Monday.
Things are playing out as expected, with ES coming within 5 points of our next downside target (the SMA200) overnight.
The chart receiving the most attention is the 10Y, which broke below 22.94 and is on its way to our 21.72 target.The one which should be receiving the most attention is SPX, which closed below its H&S Pattern neckline — adding credence to our lower targets.Though it seems like more, 2776 will represent a 5.5% drop since our short signal at 2940 on Apr 30 [see: FOMC – Endgame.] Things will get really exciting if/when SPX fails to bounce.
It’s now been five days since futures bounced out of the falling white channel. It still seems fairly likely it was just a delaying tactic, as various currency pairs, commodities and indices are sliding toward our next targets.
We started posting about TSLA a little over a year ago when it dipped below important horizontal support [see: Can Tesla Avoid a Crash?]
We’ve updated the charts multiple times since then, working to stay ahead of Musk’s obvious attempts to manipulate the stock. The harmonic picture has been tricky due to the presence of two Point X’s which produces two different grids – the purple and the white.
TSLA dipped below the white .618 in March (and multiple times afterwards) bolstering the argument for the purple grid. But at times it has appeared that the white grid aligned nicely with channel lines such as this chart from last September which officially triggered a short call at 289 [see: Crypto Carnage] which was reiterated at 291 on April 3 [See: Can TSLA Survive This Crash?] and targeted 202.29.
The Better Late Than Never Department has notified me that TSLA just crashed into 202.29, nearing the completion of this particular leg of its journey.
Given that OPEX is in the rear view mirror and the futures are about to break below support again, we have to wonder whether TSLA is done.continued for members… (more…)


 With SPX a few points away from an important Fib extension, will this one be any different?
  continued for members… (more…)