Tag: SPX

  • The Bulls Fight Back

    The market is parading around in yesterday’s Apple earnings report like a glamor queen in a mink stole.  An economy that can pump out eleventy zillion iPhones is very pretty, indeed.  Then, along comes the stink of a very disappointing durable goods report.  And, that mink stole is suddenly, jarringly out of place in this economic favela.

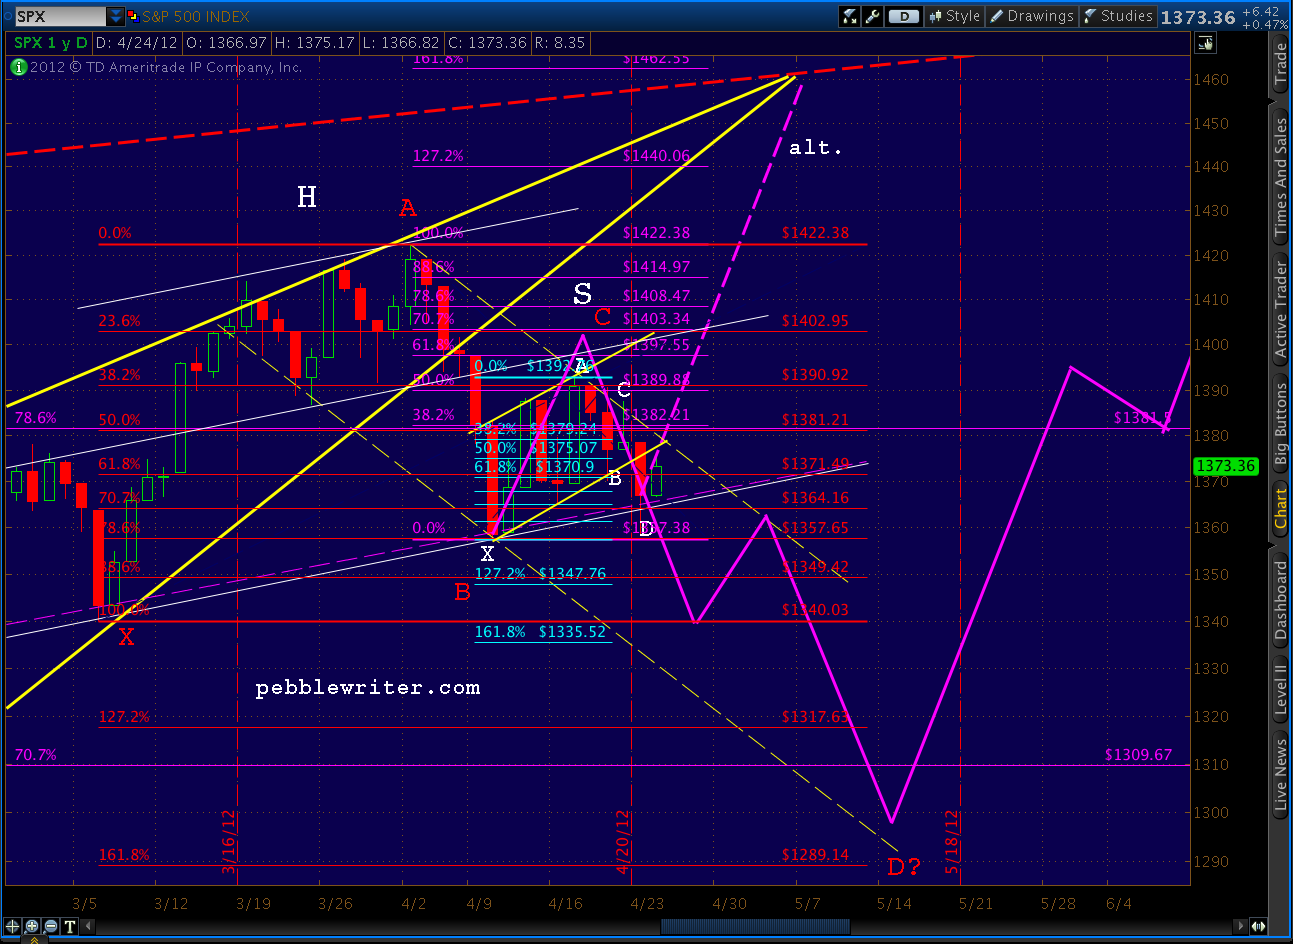
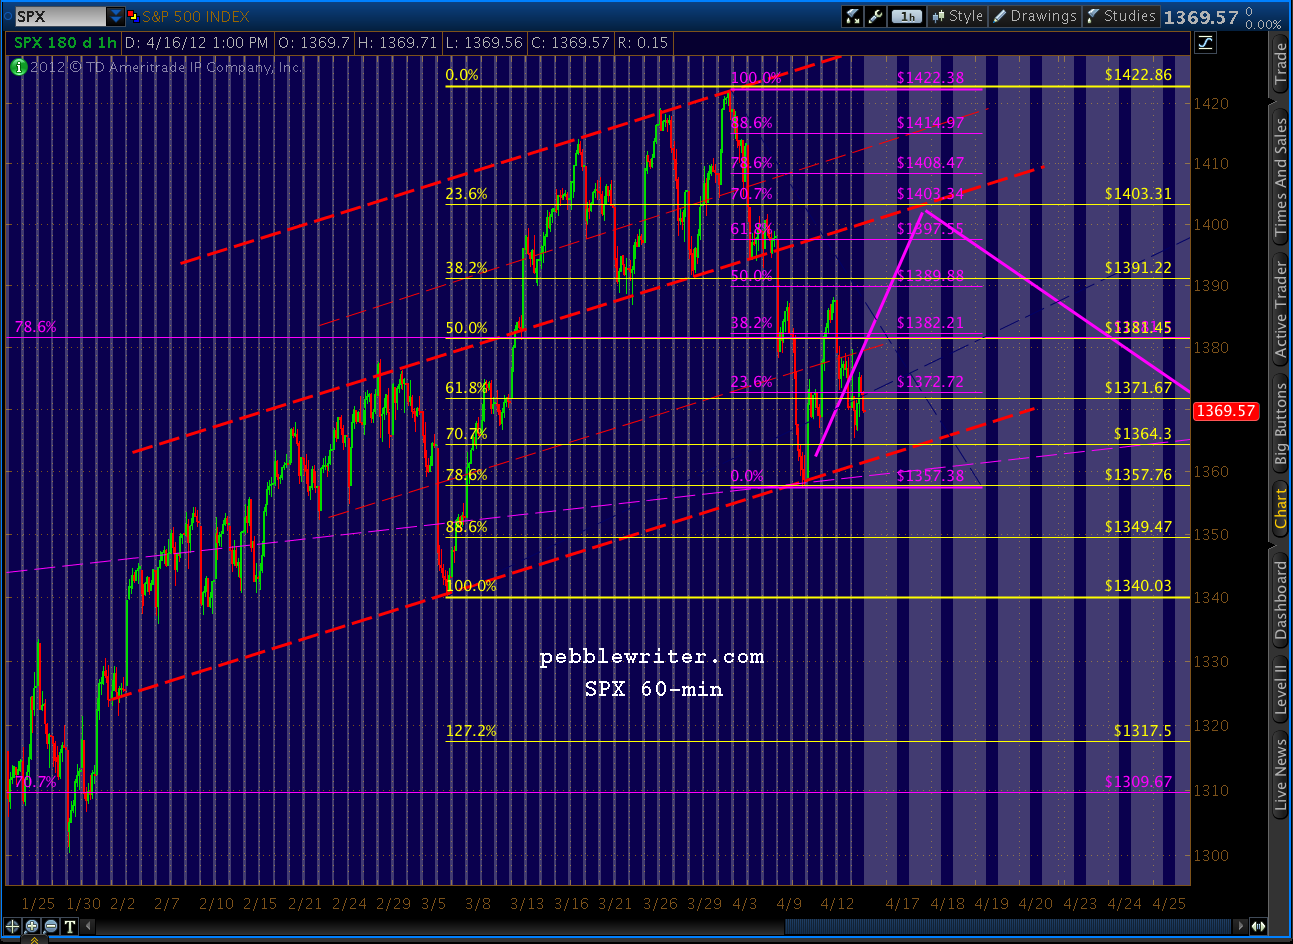
    It was a nice overnight ramp.  It’s taken us past the channel line we identified as key for the bears in yesterday’s analog update.   But, is this the hard bounce at the neckline we’ve been discussing?  Is our alternative playing out (the purple, dashed line) or is this yet another in an endless series of head fakes?

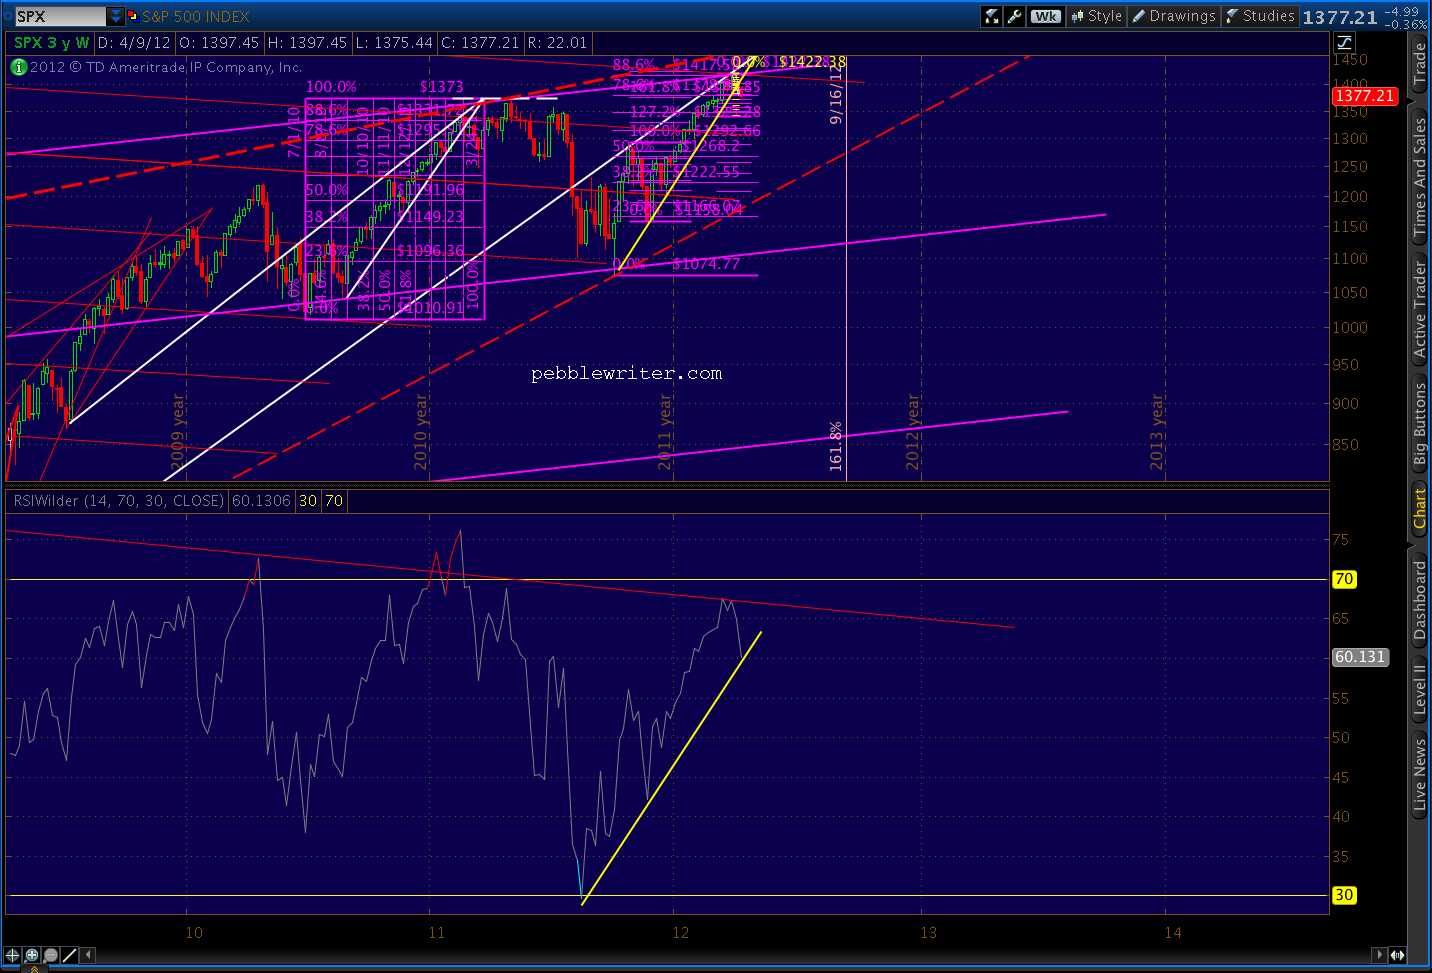
    Looking at the daily RSI, we’re back testing a trend line (yellow, dashed) going all the way back to last August’s lows.  We broke it on the 9th — remember that 16-pt tumble out of the rising wedge?  I’m going to watch that TL like a hawk, as I believe it holds the key to which way this latest confusion resolves.

    Bottom line, you can’t break down from an eight-month, 400-point rising wedge and not expect the bulls to put up a little fight.  That’s what back tests are all about.  It’s a case of the bulls not being ready to give up, and the bears not having enough conviction.

    Just like confirmation of a H&S pattern has its levels of certainty, so does the bust of a H&S pattern.  One key indicator to watch is whether we exceed the previous shoulder — 1392.76 on the 17th.  So far we haven’t, reaching only 1390.81 this morning.

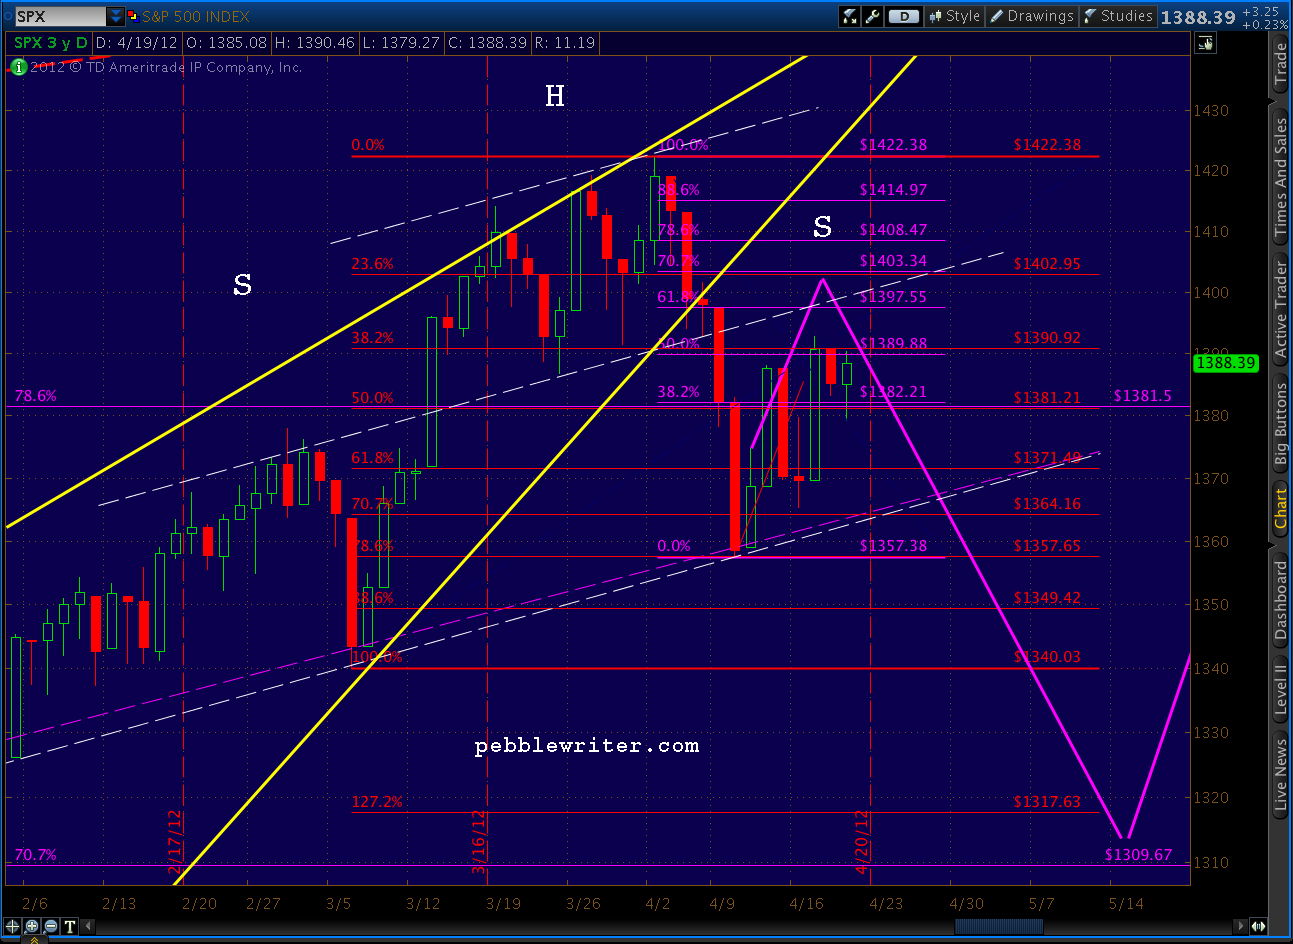
    Another is whether this ramp causes the overall pattern to start looking malformed.  In this case, the left shoulder was very lumpy and drawn out to begin with — a complex H&S left shoulder with two touches of the neckline.  So, a complex right shoulder with two touches would actually be in keeping with the existing pattern.

    Remember, we had originally been looking for 1400 in order for the right shoulder to be proportional to the left.   We never did reach the parallel shoulder line, and so an A-B-C move to 1400-1408 would leave the pattern looking slightly better.

    The only issue with that scerario, though, is that the analog doesn’t fit as well if the right shoulder extends more than a few additional sessions.  In 2011, the H&S pattern took 41 sessions, with the left shoulder lasting 13 sessions (32%), the head lasting 18 (44%) and the right shoulder lasting 10 (24%).  Thus far, this pattern has taken 57 sessions, with the left shoulder lasting 22 (38%), the head lasting 24 (44%) and the right shoulder (so far) at 11 (19%).

    While no particular proportionality is required of H&S patterns, it is for analogs.  I’d be a little leery of the analog playing out if the right shoulder lasts too much longer.  By Tuesday of next week, the right shoulder — and the entire H&S pattern — will be roughly proportional to the 2011’s.  That means whatever bump this pattern has in store should run its course pretty quickly if the analog is going to hold.

    Bernanke speaks at 2:15 EST.  I suspect most of the fireworks is done till at least then.

    Stay tuned.

  • Analog Update: April 24, 2012

    The analog we’ve been watching since April 9 is playing out nicely so far.  We got the original bounce at 1357 as forecast, followed by a rise to the middle of our 1380-1400 target range.  The H&S pattern we expected did, in fact, set up and complete yesterday.

    Now, we’re back testing the little channel (solid yellow) formed by the right shoulder.  It was broken during yesterday’s plunge.

    As we discussed yesterday, if the wheels fall off the analog, it’s going to happen here — at the H&S neckline.  A hard bounce would likely send SPX up to tag the initial rising wedge apex at 1462-1472 (the purple dashed line.)  It can be viewed as a Crab pattern with the 1.618 at 1462 (in purple, points not marked.)

    But, I think we’re more likely to see the analog continue to work.  The key will be a failure of this morning’s rally/back test and a close below 1363.  Note that we’ve also established a channel to the downside (red, dashed) that coincides nicely with the harmonic picture.

    The pale blue Bat/Crab indicates a potential to 1335-1340, which would be a nice spot for a back test of the H&S pattern itself.  From there, the larger red Butterfly pattern takes over, with potential to 1317 (the 1.272) or 1289 (the 1.618.)  Though, a drop below last October’s 1292 would be a challenge.

    The key levels I’m monitoring today are 1378 — at which point the back test starts to intrude into the previous channel, and 1382 — at which point the larger red, dashed channel is jeopardized.

    Good luck to all.

  • Going, Going…

    I’d be impressed if the bears were able to deck OPEX — the perennial champ — and let the H&S pattern play out just yet.  But, here we are, at the bottom of the nice little channel that’s guided the upside since 1357 on April 10.  I suspect the sell-off will be limited to 61.8% of the rise, or 1370.

    The nice thing about the .618 is that it leaves open the possibilities of a Gartley, with a reversal at the .786 at 1365, or extension to a Crab’s 1.618 at 1335 — which would be a nice level at which to start a back test of the neckline.

    If there’s one thing you can count on these days, it’s the market’s insistence on maintaining maximum ambiguity for as long as possible.

    More later.

  • Who We Rooting For, Again?

    It’s a sputtering economy in one corner, OPEX in the other.  But, wait, that’s no ordinary boxing ring; it’s a house of mirrors and Ben Bernanke is the referee.

    If bad news is bad, this is bad.  Unemployment claims are up.  Housing sales are down.  Philly Fed survey numbers are down.

    Then again, maybe bad news is good.  The slumping economy has the QE crowd salivating again (you’d think they’d run out of spit sooner or later.)

    Even if we could forget the economy, QE and the 5/6ths completed H&S pattern, tomorrow is OPEX.  And, as we all know, that means the fight is rigged — at least until Monday.

  • VIX at a Crossroads: April 18, 2012

    Where there was once a falling wedge, there is now a channel.  The April 10 breakout that looked so promising completed a Bat pattern and promptly reversed nearly 61.8% of the move from the 13.66 bottom.  Is this the end of the ride, or are there bigger and better things in store for VIX?

    I have tentatively added another channel to the RSI to accommodate the latest spike.  It would likely guide the next leg down, if indeed that’s forthcoming — which I mostly doubt.

    Of course, every time we complete a Bat pattern with a Point D at the .886, we’re also establishing a potential Point B in a larger Crab pattern.  In this case, that would result in a completion Point D at the 1.618, which is 27.12.

    That’s an interesting price, because it equates with the 2.618 of the small Butterfly pattern potentially setting up on the hourly chart.

    Things get real interesting when you back out and look for competing or complimentary patterns.  On the 60-min chart, we can see that the move off the bottom conforms to a upward-sloping channel (in white) so far.  This channel will intersect with the downward sloping main channel (yellow) on Friday — which, of course, is OPEX.

    It’s only fitting that the point at which VIX must commit to one channel or the other arrives on OPEX.  The situation reflects the alternatives we’ve been discussing for SPX.  The analog we’ve been watching indicates a short-term top is at hand, and we should see a brief but scary sell-off in the next few days.  This would correlate with sideways action in VIX, followed by a breakout of the yellow channel to follow the white one — probably topping out at the 27.13 level at the bottom of SPX’s decline to around 1305-1317.

    The alternate SPX view is that we go on up and tag the rising wedge’s apex without the sell-off first.  There’s certainly enough important news in the pipeline over the next few days to bring either course to fruition.  Such a movement in stocks would mean the white channel breaks down and the yellow one holds — knocking VIX back to the 14.5 — 15.8 range.

    Of course, such a move would complete most of an inverse H&S pattern (in yellow) and set up the next upside break out.  Technically, we have enough of a right shoulder as it is, but a drop to around 16 would be ideal.

    In summary, my leading assumption is sideways until OPEX, then a breakout up to the 23-24 range to complete the IH&S that correlates with the SPX’s H&S move down.  We should then see a back test of the yellow neckline and subsequent push to the 27-30ish range to correlate with SPX’s move to 1307-1317.

    It would be a break of the yellow channel (which has a grand total of two anchor points on its upper bound) that would be similar to the Mar 16, 2011 breakout to 31.28 (see below.) But, such a move would bring it back the midline of the long-term channel that’s been such a magnet for breakouts over the past few years.

    That midline, by the way, is in the same neighborhood as the Inverse Head & Shoulders target of 28.20, which would be very doable if SPX were to plunge 70-80 points over the next week.

    But, keep the alternatives in mind.  The market is exceedingly hinky lately; and, as much as I like the analog, it’s certainly not guaranteed to play out.  As always, please use stops.

    Good luck to all.

  • Channel Surfing: April 17, 2012

    The analog I first posted about on the 9th [see: Analog Details] has performed well this past week.  Given the overnight action in the futures, it’s about to get a boost in the right direction.

    A perfectly formed H&S pattern would mean a right shoulder in the 1400 range.  Though, as we pointed out yesterday, we already have enough of a right shoulder to matter.

    For anyone interested, I posted Part 2 of Why Do Analogs Work? yesterday.  It details the 2011 as 2007/8 analog, and delves into the numerous chart patterns, fan lines, regression channels and harmonic patterns that took us from May to July of last year.

    It’s a decent guide to how these various patterns interacted and combined to generate a top, and subsequent fall — helpful hints for times like these.

    Stay tuned.

  • Bottom Fishing

    EOD:  2:25 AM

    SPX overshot the Crab’s 1.618, whichever Point X we use.   The next major lines of harmonic support are are the red pattern’s 2.24 at 1342, correlating with the purple pattern’s 2.618 at 1341.

    Given the level of oversold on the day, here’s an alternative view.

    UPDATE:  11:55 AM

    The Crab Pattern I posted about earlier pulled a fast one on us.  It either busted, or I drew it wrong.

    Technically, it’s forbidden for Point C to exceed Point A — kind of like Wave 1/Wave 4 overlaps in Elliottworld.   But, it happens.   I’ve redrawn the Crab to begin with the March 23 1386 low instead of the March 29 1391 low — which means that the 1.618 extension is 1364.92 instead of 1372.51.

    Note the daily RSI tag on the same trend line (red, dashed) that stopped the Oct 4 and Nov 25 declines. The previous tags are highlighted in light blue.   This decline is picking up momentum, so the RSI TL and the Crab pattern might get mowed down.

    But, be cautious.   Like any trading system, once you start bending the rules in Harmonics, it opens up a can of worms.  Markets frequently overshoot logical targets, and it’s no cause to discard the methodology.

    I’m taking some profits off the table at these levels, and will let the rest ride essentially risk free.  Note that 1364 is the .707 of the 1340-1422 move.  If it doesn’t hold, the next support is at the .786, which would equal 1357.  An intra-day push to 1357 and close at 1364 would be interesting.


    ORIGINAL POST

    After yesterday’s close below the rising wedge, we can safely consider it officially broken.  Now, the question is whether SPX will freefall in an epic fail of the bull market, or find support at some interim level for another leg up.

    In the near term, we’re approaching a potential Crab Pattern turning point at 1372.51.  We might have reached it yesterday but for the little acceleration channel SPX has been in since 1422.  Today, the channel passes right through 1372, so we could get a good test.

    This isn’t a big pattern, so we might not see earth-shattering results, but it should be good for at least a nice bounce if not an outright reversal.

    I think an outright reversal might be in the cards, though.  The hourly RSI shows positive divergence with this morning’s leg down, and daily RSI shows a tag of an important internal trend line.  But, it’s the weekly RSI chart that, as a bear, really gives me pause.

    Expanding the RSI chart gives us a clear view of a trend line that might provide significant lift at these price levels (ignore the compressed upper chart.)

    I’ve also been watching VIX’s price action, constructing some probable channels months ago: the yellow channel guiding the downside, transitioning to the red channels for the subsequent rise.  Since then, I’ve barely adjusted them.

    Note how well they’ve called the turns.  At this point, they hint at a likely breather for VIX.  All things considered, I think we’re likely to see a backtest of the VIX falling wedge that will correspond with a return to the other side of the red channel.  It could happen any time, but might well occur coincident with the afore-mentioned bounce in SPX.

    All this begs the question, what kind of bounce will we see?  As we discussed the other day, this rising wedge is a reasonable facsimile of the 2010-2011 one [see: Analog Watch.]

    The most likely drawing of the current wedge puts the apex around 1460-1470 somewhere around May 7-11, meaning we reached only 88.6% of the potential in both time and price at the recent 1422 high.  [see: Was That It?] If we repeat the pattern, we’ll head back up to tag that apex — exactly as we did in May 2011 at 1370 (note the dashed white line that connects the March 2011 apex to the May 2011 top.)

    More importantly, however, we’d tag the upper bound of the huge rising wedge (red dashed) that dwarfs the rising wedge (yellow, solid) that just broke down.

    I’ve drawn its upper bound as the biggest, boldest red line I can muster on the above chart.  Why?


    Stay tuned.