Tag: rising wedge

  • Should We “Like” Facebook?

    The last time I posted about FB was October 24 [see: CIW Oct 24, 2012], when I happened to hear Donald Trump repeatedly mention the stock as he was being interviewed about something else all together.

    BTW, interesting chart on Facebook.  I knew something was up when I heard Donald Trump touting the stock on the radio.

    He…still managed to mention the large position he’d been buying about 5-6 times.  More likely he was going for the ol’ pump and dump.

    It’s hard to escape the power of channels.

    The channel in question had been stretched to the limit by the gap up from 19.5 to that day’s 24.5 high and looked like this:

    The channel de-friended FB, smacking it back down to below 19 within the next two weeks.  But, since then, the amazingly positive stock market to the moon has taken hold, trumping that falling channel.   The stock has retraced about half the losses since its 45 high (the white Fib levels below.)

    Unfortunately, it’s also traced out a Rising Wedge — not to mention a Bat Pattern from its June highs (the purple Fibs above.)  As such, it is likely to weaken considerably here — with a drop to at least the bottom of the rising wedge — currently at 27.75 or so.

    Judging from the charts, though, I’d say FB is a good candidate for a breakdown of its Rising Wedge.  Often, this results in a new channel that features a lower bound parallel to the upper bound of the wedge.

    The mid-line of the proposed channel is at 27 (a 10% drop from current prices), and the bottom is way down at 22.75.  The good news is that the channel is obviously rising, so these potential targets are also on the rise.

    The bad news, however, is that the charts indicate the trend may well have changed and the downturn could be more significant than just 10%.  4-hr MACD just crossed over yesterday (60-min is already negative.)

    And, the rising daily RSI channel is probably yielding to a falling channel — signalling a trend change to go with the obvious negative divergence.  Though, we won’t know for sure until RSI reaches the bottom of the white channel.

    Bottom line, the road ahead should be very bumpy.

    Stay tuned.

  • Charts I’m Watching: Jan 14, 2013

    ORIGINAL POST:

    The dollar is making a stand at the upper end of the target range I charted Friday, but hasn’t yet broken out of the steep falling channel.  While there was a turn at the .618 Fib that would justify a .786 completion (a Gartley), the more obvious Point B was at the .382.

    In a perfect world, this would signal DX has further downside potential to the .886 for a Bat Pattern completion — though, obviously, not every corrective wave has to be a harmonic pattern.

    The EURUSD similarly reached a common turning point at the 1.272 extension of the latest move down from Dec 19 (or Jan 2, take your pick.)

    But, as can be seen, the rally from last week features no potential Point B whatsoever.   It’s hard to call this a Butterfly Pattern in the absence of an actual pattern.

    Furthermore, the tails on the daily candles offer an even more aggressive upper bound for the rising wedge we’ve been charting for the past several weeks.

    Equities are pointing to a soft opening, but nowhere near what one would normally expect with horrid AAPL news on the tape — much less the approaching budget showdown.

    Regular readers are well aware of the importance of the 500 price level for AAPL.  As we’ve discussed many times, the completion of the H&S pattern could have dire consequences for AAPL and the entire market.

    continued for members(more…)

  • Update on Everything: Jan 11, 2013


    Around the horn with major indices and currencies…  Like SPX, most are at a threshold where they must either break down or break out (I think “break down,” but we’ll know soon enough.)

    Coming up: VIX, RUT, COMP, NYA, NDX, DJIA, FTSE, SPX, DX, EURUSD, USDJPY, AUDUSD, CL, GC, SI.  And, yes, I’m happy to take requests — first come, first served after the above are done.

    *  *  *  *  *  *  *  *

    VIX

    continued for members(more…)

  • Down the Rabbit Hole: Part 2

    Alice laughed: “There’s no use trying,” she said; “one can’t believe impossible things.”   “I daresay you haven’t had much practice,” said the Queen. “When I was younger, I always did it for half an hour a day. Why, sometimes I’ve believed as many as six impossible things before breakfast.”
                                        ― Lewis Carroll, Alice’s Adventures in Wonderland


    The market never ceases to amaze me.  Despite all the ingredients being in place for a sizable correction, it’s sailing along as though everything were copacetic.

    Negative divergence abounds.  The correlated currencies are all selling off.  Gold is down.  Silver is down.  Even AAPL is down. Numerous indices have completed bearish Harmonic or Chart Patterns.

    The Fed let slip yesterday that the adrenaline drip will soon be removed — leaving banks without a buyer for their underwater mortgages and the stock market without any downside protection.  They’ve finally admitted what we’ve all known for some time: QE’s effect is diminishing, and the risk is growing.

    The budget showdown is still ahead (the part of the fiscal cliff that really matters.)   The most fractured Congress in modern history, which utterly failed to resolve the important issues, will now turn the task over to an arguably more partisan Congress.

    The country’s AAA credit rating is hanging by a thread at both Moody’s and Fitch.  A downgrade by either would require massive selling by institutions which require at least two AAA ratings in order to comply with their investment policies (especially insurance companies.)

    Unemployment has reportedly declined, but only because we no longer count the dejected job seekers who are leaving the work force in droves.  Include them, and the actual picture is startlingly bleak. (source: Shadowstats.com)

    The EU is officially back in a recession (though it never really left.)  Its banks are being kept afloat by the ECB/ESM, which is exchanging (somehow AAA) paper backed by shaky sovereigns for junk sovereign debt as fast as it can.  Meanwhile, unemployment continues to soar.


    The big 2013 headline that isn’t (yet) is the global derivatives debacle:  $700 trillion — over 10 times the global economy — of unregulated, unpriced, unreported private contracts which have been sliced and diced so many times that no one has the slightest notion what the risk really is — except that it dwarfs the capital of the banks that hold it.

    In my opinion, the only things keeping the economy and the market afloat are the unrelenting screech of MSM fairy-tale “good news” and the Bernanke Put (the Fed’s money printing and plunge protection operations.)

    As long as these two factors can outweigh the negative fundamental picture, the market stands a good chance of rising.  Take one of them away, and the resulting crash will be swift and severe.

    That said, I’ve spent the past two days assessing the current state of our analog and forecast.  I’ve quantified it as best I can in an attempt to eliminate my admittedly negative bias.  I’ll lay it out over the next several hours, a few charts at a time.

    If you’d rather skip to the punchline, I’m still bearish.  In the absence of a push through 1474, I think we’re in for a sizable correction and remain short from 1462.  If 1474 is broken, everything changes.

    For members who enjoy getting their fingers dirty, stay tuned.

    *  *  *  *  *  *  *  *

    About an hour ago, we completed a Bat Pattern which is nestled inside of a Bat Pattern which is nestled inside of a Bat Pattern.


    UPDATE:  3:15 PM

    RSI channels show how much is riding on this moment.  A push through the top of the purple channel brings the red channel mid-line into play.  Could it correlate with 1474, or maybe just the next channel line on the intra-day?

    I’m not sure.  The intra-day 1.272 is 1468.17 and the 1.618 is 1471.61.  A double-top would be a real nut-buster.

    All I know is there’s still negative divergence across the board, so I don’t expect the red mid-line to be broken.

    My apologies for the delay in getting the forecast charts up.  They’ll have to wait until after the close.  I’ve been distracted by the melt-up, checking and re-checking my charts to see what I might be missing.

    continued for members(more…)

  • EURUSD Update: Jan 4, 2013

    EURUSD is approaching the critical bottom of a large rising wedge, after having maxed out at the .618 time Fib and .886 price Fib.

    Daily RSI indicates a break down of the wedge.  But, watch out for the mid-line of the forming white price channel.  It could put a floor under the pair’s decline around the .886 of the red grid.

  • Cliffhanger: Dec 31, 2012

    ORIGINAL POST:  9:25 EST

    We remain short from SPX 1447 on Dec 18.

    The dollar is either finding support at a channel midline or about to find it at the bottom of a channel, depending on which channel ultimately holds.

    DX RSI shows great channel support either way.

    The EURUSD is still hanging in there, backtesting the red channel midline again in the midst of the major white channel back test that’s been going on since Dec 18, and post the rising wedge break of Dec 19.

    As Reeodd mentioned in a question Friday, the H&S pattern that completed (see the 2:50 entry) would look better formed if the right shoulder were a little higher.  This is definitely true, though the past six months has seen many very lopsided H&S patterns play out perfectly.

    Bottom line, the pattern completed — but it didn’t close beneath the neckline.  We saw a bounce right at the close that allowed it to remain above — just as we suspected [Winding Down — 3:55 entry.]

    This correlated perfectly with the VIX reversal at a key Fibonacci .618/1.618 level we were expecting.

    I don’t usually count H&S patterns as “in play” until a close below the neckline.  But, in this case, I think that rule is mostly academic.

    The reality is that the market will move today in accordance with the news out of Capitol Hill, which might be in keeping with normally reliable chart patterns — or not.

    I have no inside knowledge of the goings on in Washington.  But my view has always been that Congress, while recognizing the need for Fiscal Cliff-type changes, cannot ever be expected to commit political suicide by actually voting for them.

    Old guys in strongly partisan districts might be the exception, and we’re seeing olive branches extended (even aisle-crossing) by some.  But, young turks whose anti-establishment vitriol got them elected are unlikely to fall in line — as happened with Plan B last week.

    And, if that sounds like I’m hedging my bets, it should (metaphorically, anyway.)  Betting on the outcome of the political process is a crap shoot, pure and simple.  I express an opinion because that’s what members expect.  It should, in no way, be considered as fact until after midnight tonight.

    Our forecast still calls for much lower prices in the next 9 sessions.  Thus, I remain short. But, anyone uncomfortable with the very real risk of a short position imploding as the result of a last minute political stick-save should really be on the sidelines until all the dust settles.

    By the way, we have a number of new members with us.  For those who are scrambling to get up to speed, let me recommend a couple of posts.  The last update I made to our current forecast/analog was on December 17.

    https://pebblewriter.com/forecast-update-dec-17-2012/

    And, if much of that post sounds like an obscure, ancient language, I recommend you take a few minutes to peruse the following pages:

    Also, if you did not receive an email announcing the publishing of this post at around 9:30 EST, please let me know.  I’d like to make sure everyone’s preferred email address is in our distribution list.  While you’re at it, check out your profile and make sure there’s a phone number or alternate email address listed in case of problems.

    Last, take a minute and sign up to follow pebblewriter on Twitter.  On a couple of occasions, email has been out of commission, and this is a good alternative way of communicating.  I continue to explore using it as a means of communicating intra-day posts of any importance.

    UPDATE:  11:15 AM

    I’m going to take the next hour or so and update the forecast/analog charts from Dec 17. Unless something happens, I won’t post again until then.  In the meantime, keep an eye on SPX’s falling white channel.

    The upper bound is currently around 1412.44 — the .618 retracement of the latest leg down from Thursday’s high of 1421.29 to Friday’s 1398.11 low.  A break-out would be significant, and cause for a short-term hedging position.

    In the absence of any news by 4pm EST (regular hours today, folks – bah, humbug!) I imagine enough prudent investors will choose fear over greed that we’ll get another sell off anyways (as always, subject to PPT action.)

    UPDATE:  12:40 PM

    SPX just tagged that .618 level we discussed earlier.  It’s close enough to the channel line to be considered still within, but I’d look at any move higher as a reason to take a protective long position.

    UPDATE:  12:45 PM

    Just got the second push through.  I’ll take a protective long position here at 1413, with stops initially at 1412.  Core shorts remain in place.

    The 60-min RSI channel (since Dec 18) shows a breakout.

    UPDATE:  1:25 PM

    SPX has bounced back and forth a couple of times as news reports hint at a possible deal on part of the agreement needed to avoid sequestration.  I’d continue to keep a protective position in place, just in case.  Obama to speak at 1:30.

    The latest push was to the .786, which opens up a potential Butterfly Pattern (1427.59 or 1435.62) IF prices surpass 1421.29.  Note that 1427.59 would intersect with the upper yellow channel bound as well as a shoulder line that parallels the latest H&S pattern neckline.

    This also would mark a full back test of the rising purple channel and the midline (dashed) of the white channel guiding prices higher since 1343.  Also note that 1425.68 is the .618 of the 1448-1398 drop, and 1424.41 is the .618 of 1474 to 1343.

    On the downside, keep an eye on a drop back through the white channel line — currently around 1410.50.

    UPDATE:  1:47 PM

    Despite Obama’s jovial tone, this doesn’t sound like an agreement is any closer.

    UPDATE:  2:30 PM

    Prices have yet to drop back through the white channel — meaning any trading above 1411 could be written off as an intra-day blip.  SPX came very close to, but didn’t quite tag the .886 of 1421-1398 at 1418.65.  Completing that little Bat Pattern could easily be the extent of this intra-day rally.

    But, the risk is still to the downside.  If we muddle on through and close above the white channel line, I’d leave the protective long position in place.  If we fall back through, I plan on lifting it.

    As detailed above, a push above 1421.29 opens up 1424-1435.

    UPDATE:  3:00 PM

    McConnell says there’s a deal on taxes, but last I heard there needs to be some agreement on spending, too.  And, I’d be surprised if the House would agree to such a deal.

    We’ve reached the bottom of the target area for this rally, so a turn anywhere in here would be reasonable.  But, there remains potential to the 1429-1435 range, with best guess being 1429.

    I hesitate to take profits on intra-day longs just yet, but would reassess at 1417.

    UPDATE:  3:45 PM

    Looking good for that 1429 level on mostly negative divergence — wouldn’t surprise me to close there.  I think I’d unload those intra-day longs in a heartbeat if we tag it.

    UPDATE:  3:55 PM

    The news reports are getting just plain silly.  But there’s no deal prior to the close, and the House won’t even vote on anything the Senate might pass today.  I’m closing out the longs here at 1426.


  • Charts I’m Watching: Dec 27, 2012

    The dollar broke down from its steepest channel (in white) as I suspected, settling into a consolidation that might flesh out the larger purple channel today or tomorrow before breaking out of the yellow channel it’s been in since Nov 12.  My target remains the .618 at 79.319 on the purple grid.

    I say “might” because the 60-min RSI features a well-defined channel (rising, white) that could legitimately continue to nudge prices upward at a more modest clip now that RSI has lost the purple channel.

    The EURUSD, in the meantime, reversed right at its .618 as expected, but then broke out of its falling channel overnight to extend just beyond the .786 at 1.3275, completing a Gartley Pattern (white.)  With the .618 reversal, it could also be working on a Bat Pattern that completes at the .886 of 1.3290.

    Note, however, that it has already reached the .886 of a pattern drawn from Dec 20 instead of Dec 19 as shown above; so, there is potential for a reversal without any additional upside first.

    A little more negative divergence would help sell me on this being a top for the pair.  Once it does reverse, there is ample downside.  We’ve yet to see a significant sell-off since it broke down from the rising wedge last week.

    In equities, my core position remains short since 1447 on Dec 18, but we concurrently played an expected bounce from the completion of a Crab Pattern yesterday at 1416.43 with stops at 1415.

    UPDATE:  10:30 AM

    SPX just broke down through the bottom of the white channel that’s carried prices higher since the 1343 low.  The next potential support is the .500 Fib of the 1474 to 1343 drop at 1408.93, which intersects with the .382 of the 1343 to 1448 rally at 1408.02.  It’s also the 25% line of the falling channel from Dec 11 (yellow, below.)

    The dollar poked up above the top of the yellow channel and is testing yesterday’s 79.81 high.

    This is also the mid-line of another channel I’ve been watching, shown below in purple — an area of potential resistance for the dollar, support for equities.

    A sustained push through 1408 leaves little in the way of channel or Fib support until 1393.45 (the .382 of 1474-1343, white below) or 1395.68 (the .500 of 1343-1448, purple.)

    But, there’s not much else there to recommend this for a substantial bounce.  We might  get nothing more than a back test of the DX yellow channel, then off to the races.  The concurrent move for SPX might be a backtest of the broken purple channel and white channel midline at around 1420-1422.  But, I’m not inclined to play that bounce.

    There are only 10 sessions left before our target of 1284-1290 on January 11.  That’s roughly 12 points per day, so drops like today’s will be the norm — not the exception.

    The only other potential support I see is the bottom of the white channel, currently at the purple .618 (1383.33) and the red .786 (1381.50.)   Bulls will want to defend 1381.50, as it was a Bat Pattern completion at the next higher Fib level (the .886 at 1472.43) that got the correction started in the first place.

    Remember, 1474 is where we sold our QE3 longs and went short back on Sep 14 [see: The World According to Ben.]  The bullish case would benefit most by painting a drop to the next lowest Fibonacci Level (the .786) as a little correction on the way to new highs.

    If SPX is very oversold at that point, I’ll consider playing a bounce.  But, as of right now, there’s no positive divergence to support catching this falling knife.

    UPDATE:  2:50 PM

    We’re getting a decent bounce here at 1401.80.  Nothing special going on in terms of Fib levels, but some channel action and a nice round number bounce are playing into it.  Worth a short-term long, IMO.

    It’s likely the market is getting a lot of help from AAPL — which is just a breath away from completing its H&S pattern again.  Recall that since we called the top back on Nov 27 [Update on AAPL] it went down and bounced at its neckline as expected — tagging 501.23 on the 17th.

    It was a nice 33-pt bounce, retracing a Fibonacci 38.2% back to a purple channel line.

    Today, AAPL came dangerously close to completing the pattern yet again — putting in a 504.66 low versus the neckline’s 502.90.  In so doing, it completed a little Bat Pattern on the 60-min chart which should get a reaction back up to 512-515 or so.

    After that rally fails, however, we’re left with a Crab Pattern (smallest pattern in red) that points the way to 480.42.  Note that this is in the same vicinity as a .786 (in white) at 480.65 and a Butterfly Pattern completion at 481.59.

    If 480 can’t hold, there is another Crab Pattern completion waiting below at 446-452 (red 261.8, white 161.8 and 88.6.)

    If/when the H&S pattern completes, it targets the June 2011 low of 310.  But, don’t be surprised if we get a very strong backtest — even a breakout — of the neckline first.  There are a lot of players with a lot of money who understand full well what a close below 500 means for this stock and the overall market.

    UPDATE:  3:30 PM

    SPX continues its back test of the recently broken channel lines.  It would have to break up through 1422.58 before the acceleration channel is endangered.

    As of now, it looks like a parallel of previous steep plunges such as that of November 2012…

    …as well as the one in April – June 2011.

    12:40 — getting close…

    UPDATE:  3:45 PM

    That should about do it.  SPX just tagged the upper bound of the white channel…

    …and, DX just completed a back test of the yellow channel.

    I would be very leery of playing the bounce any further than right here at 1421 — the .886 retrace of the drop from yesterday’s 1423.97 and the .618 of the drop from Dec 21’s 1432.78.


    More later.

  • Charts I’m Watching: Dec 17, 2012

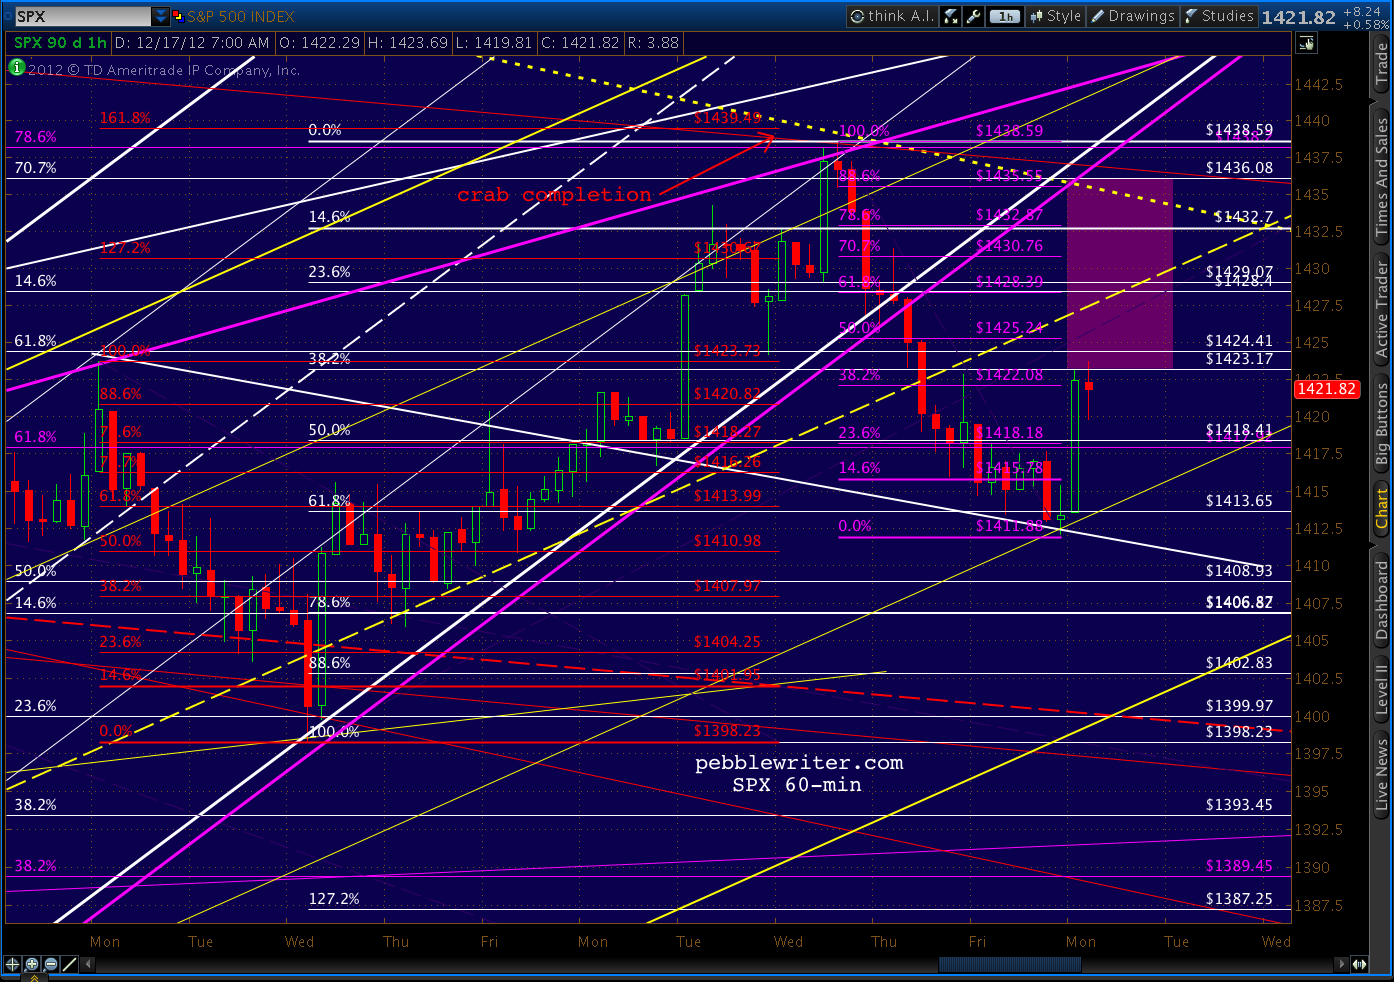
    We got the bounce we talked about Friday afternoon, coming at the .618 of the last move up (the Crab completed Wednesday, in red) as well as the last wave down (in white, below.)

    We discussed not playing this bounce until SPX has cleared 1420, which it did this morning.  Even so, I would be cautious in chasing after it.  While the potential is to 1429-1435, as detailed Friday, this is almost certainly just a bounce — nothing more.  And, the next wave down will be swift and severe — particularly if AAPL continues to show weakness this morning.

    For those who opened a small protective position as we discussed Friday, the two most likely upside targets are a yellow channel line or a significant Fib retracement of the last wave down.

    The tightest version of the yellow channel is shown below.  This version ignores the last 10 points of the mid-November plunge.  A stop at the 25% channel line would mean a bounce to only around 1423 — not much of a back-test for the just broken white channel or rising wedge (in purple, below.)

    But a better fit, IMO, would mean including all of the mid-November bottom.  Under this scenario, the yellow channel midline at around 1428 (the purple .618) would be the more likely lower end of the range for the bounce — with a full .786 or .886 (1432-1435) retracement representing the upper end of the range.

    If AAPL gets a bounce at 500 this morning, look for this scenario to play out — with SPX’s bounce forming a nice A-B-C wave into the shaded area below.  A stop in the shaded target area would get the downside going, with the next stop around the white .886 around 1402.

    continued for members(more…)

  • Charts I’m Watching: Dec 11, 2012

    Today marks the 6th session since we shorted at 1423 [see: Without a Net] in anticipation of a strong downdraft.

    The first wave down since then was a respectable 25 points, hitting just below our initial 1400 target.  Wave 2 has since rebounded a little over a Fibonacci 88.6%, but is definitely taking its time.  With the bump up in the futures overnight, there’s even a possibility SPX will go up and tag the actual .618 at 1424.41 as discussed yesterday ( it hit 1423.73 on Dec 3.)

    The markets remain frozen in fiscal cliff headlights, and thus our forecast is becoming stretched.  I’m not overly concerned about this, as it has occurred in each of our previous analogs. I think it has to do with recognition of the pattern, and the efforts being made to avoid a similar outcome.

    The slope of the white channel could potentially be shifted, as illustrated by the above chart.  But, it would take a break out to reach the next higher Fib levels.

    A sustained move up through SPX 1325 would signal a Gartley Pattern to the .786 (1446) or Bat Pattern to the .886 (1459.)  In that event, I’m fully prepared to switch sides and take a stab at re-shorting at those higher levels.

    But, indications are that our primary forecast is about to be realized. The dollar, for instance, has tagged the bottom of the channel after completing a 61.8% retrace of the 1st of a wave 3 higher.  If it can hold the channel, the next move up should be explosive.

    continued for members(more…)

  • Update on Financials: Dec 7, 2012

    The last time I devoted an entire post to financials [June 5: So Crazy, it Just Might Work] XLF was down nearly 19% from its March highs.  I held my breath and made some ridiculously bullish predictions.

    But, all good things must come to an end, and I think the tide is turning for financials.  Don’t get me wrong…I still think they’re dead meat in the longer term.  I just think we’re looking at a sizable bounce here and now if — and let me be clear, it’s a very important IF — the rumors are true and Kumbaya Banking and Quantitative Whatever are back.

    If not, this entire exercise isn’t worth the bytes it’s written with.  The financials, along with just about everything else Bloomberg quotes, will roll over and die.  OK, with that huge caveat out of the way — and before you laugh me out of cyberspace — here are my targets:

    JPM:  today’s close = 31.99, price target = 38.69 (+21%)
    C:       today’s close = 25.75; price target = 34.79 (+35%)
    BAC:    today’s close = 7.10; price target = 11.34 (+60%)

    Turns out that was the low for both JPM and C.  JPM reached our target on Sep 6 and tagged on an additional 5 points by October 17.  Citi reached its target on Sep 14 (same day SPX peaked) promptly dropped 10%, then rallied another 3.5 points to form a nifty little double-top on October 18.

    BAC was my one disappointment.  It had achieved a nice 38% return when it peaked at 9.79 on Sep 14, but had fallen short of my price target — a Fibonacci 61.8% retrace of its 68% 2011 plunge.  Apparently I had been too optimistic.  Or, so I thought…

    Don’t look now, but in the past couple of days BAC has shaken off its laggard status and is once again spiking higher — trading within 66 cents of my June forecast.  As has been widely reported, call option buying is going through the roof.

    Sadly for those speculators, though, it’s going to take lots of unicorns farting rainbows for those calls to pay off very big.  Why?

    Reason #1:  Yep.  Two Crab Patterns pointing to the same conclusion — a reversal near current prices.

    Reason #2:  Uh-huh.  Rising wedge, plain as the note on your place.

    Reason #3:    Bad channel karma everywhere.  Maybe those call buyers don’t look at charts much?  Yikes!

    Reason #4:  How about a Fib .382 reversal?  It’s not usually the end of the world, but it is a Fib. And, it’s surrounded by a bunch of little channels that are about as cute as a pack of Dilophosaurus.

    I’m not going go all negative and start talking about the massive fundamental problems BAC faces — as do most other banks.  But if BAC hasn’t done its thing by the time the market does its mama bear crash here over the next few weeks, it’ll be a couple of months before it gets another shot.

    If it’s lucky, the sell-off will only be to 9.12.  But, it the white channel mid-line doesn’t hold, you could through another point or so on the fire.

    What does this mean for the rest of the financials?  Think in terms of a downdraft on Monday.   XLF needs 8 cents to reach its .786 (or .21 for the .886), which ought to get the party started to the downside.

    JPM needs .47-.61 to reach a prime target for reversal — either 43 or 43.14.

    And, C has about 44 cents of life left in it;  38.19 oughta do it.


    When it comes to significant moves, financials often lead the broader markets.  Fortunately for our forecast, they are only one good pop away from being ready for a slide.  Having them on board in the next session or two should get us where we want.