Tag: rising wedge

  • NYA Update – June 3, 2012

    The May 8 forecast for NYA was for the index to plunge from 7815 to 7340.  The forecast worked out well, as Friday’s low was 7286 (a quick 7% return, yay!)  As noted in that update, 7340 doesn’t really match up with any particular Fibonacci levels.  And, it doesn’t intersect with the rising wedge until early August (the highlighted oval.)

    I didn’t really see it taking that long to play out, and the market obliged for a change.  It also obliged by precisely tagging the fan line I had drawn off the Oct 2007 top (yellow, dashed) and one of the parallel horizontal channel lines (redrawn as red, dashed line E for emphasis.)

    We still haven’t landed exactly on a Fib level, so we either just overshot the .500 or haven’t yet reached the .618 target of  7145.  Deciding which it is presents some interesting questions.

    continued…

    (more…)

  • Calm Before the Storm?

    Fridays before a holiday weekend have a tradition of being very, very quiet.  Today seems to be no exception.   Unless something weird happens, we’re aiming for a close around 1323, up a few points.

    (more…)

  • Bet Your Bottom Dollar: Part Deux

    UPDATE:  10:30 AM

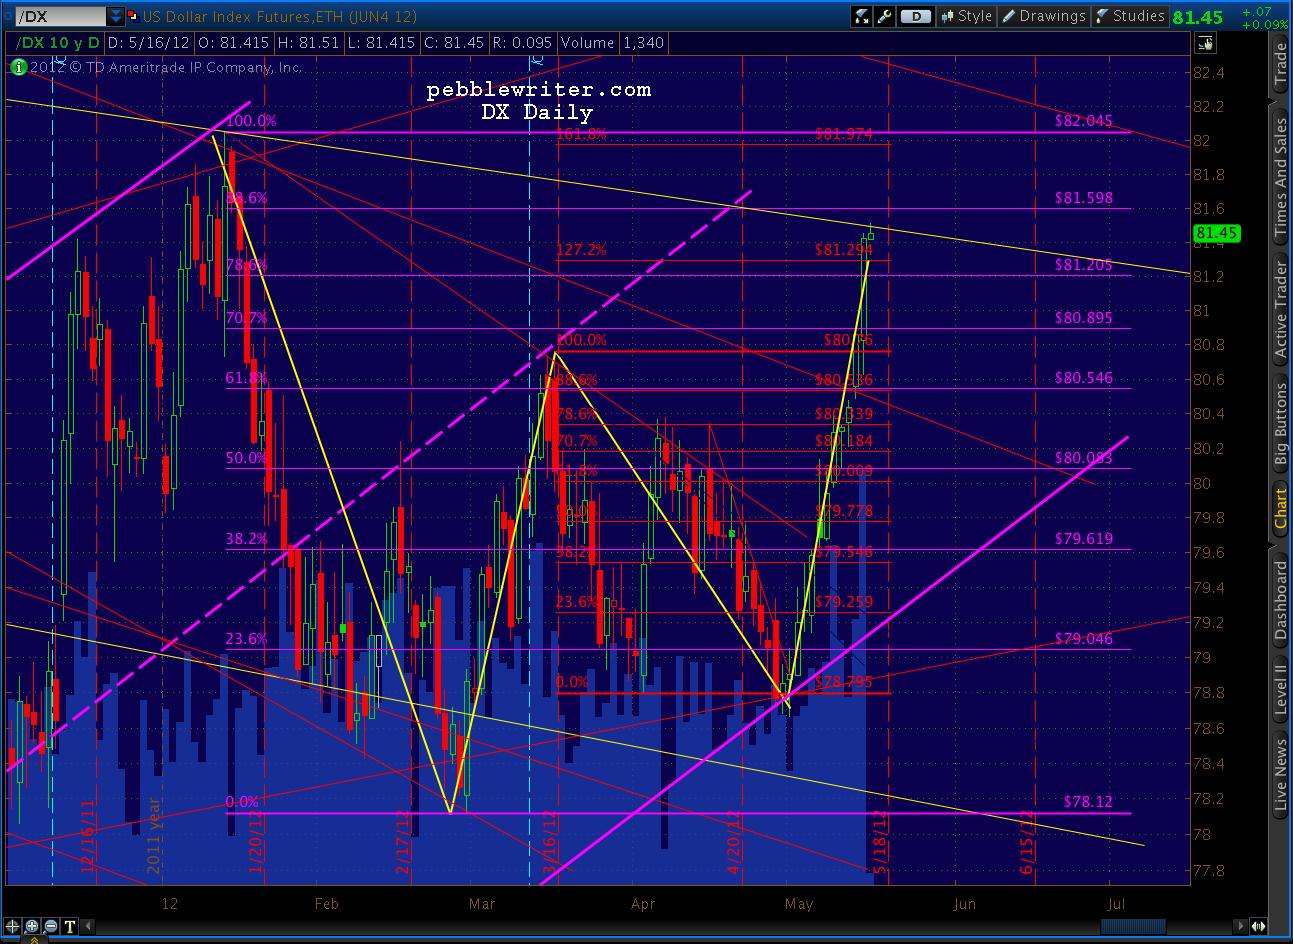
    Last night’s call on the dollar was timely.  Check out the candle on the daily chart — the completion of both a Bat and Butterfly pattern.

    EURUSD also seems to have put in a bottom, though as mentioned earlier it’s going to take ein Akt des Bundestages (literally) to save the euro now.

    ORIGINAL POST:  2:00 AM

    Back on April 30, I held my nose and plunged head-long into the dollar, also shorting the euro.  I’m pretty sure I invoked that age-old expression of confidence: “here goes nothing.” Hopefully, lots of pebblewriter members went along for the ride.

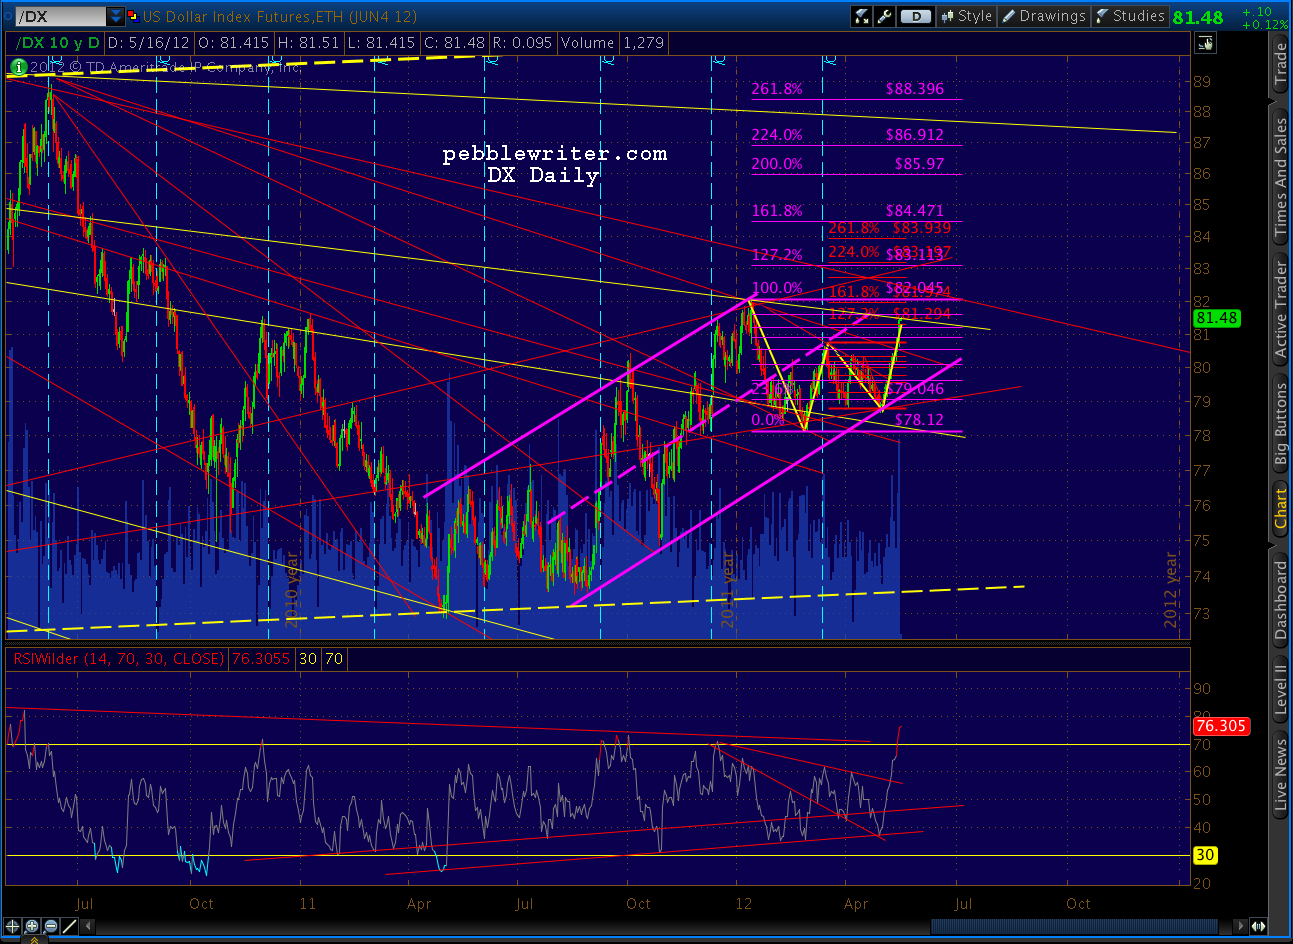
    In that night’s post [see: Bet Your Bottom Dollar] I put up the following chart:

    I immediately regretted sketching out the forecast in such detail; and, in fact, I caught a lot of guff from a few readers for so recklessly calling the bottom (you know who you are, wretched givers of guff!)

    I didn’t look at the chart for a few days, but knew things were going my way.  I just didn’t realize how well things were going my way…  Here’s the same exact chart two weeks later.

    It deserves a close up…if only to show how spooky a forecast it turned out to be.

    Throwing caution to the wind, I also posted the EURUSD chart below and wrote:

    Meanwhile, the EURUSD shows signs of finally breaking down.  Both the pair and the RSI action show a rising wedge that’s bumping up against a well-established channel.

    Note Point D — the completion of a Bat pattern — sitting down there all by its lonesome.

    It now looks like this:

    Yikes!  Harmonics don’t always work as well as they have this past month.  But, when they do, man is it fun!

    ************

    As far as the road ahead, EURUSD crossed a incredibly important fan line today.  It’s either fallen off a cliff, or it’s doing that roadrunner-running-in-mid-air thing.  On the other hand, it has completed a Bat pattern (as has DX) that should mean a reversal. The next 24 hours are critical.

    If I had to guess, the RSI leads me to believe we’re going to see a big bounce.  But, I’m taking my profits and sitting this one out.  If it plunges below the fan line, there’s plenty more downside where that came from.

    If it doesn’t, it’ll be because Merkel and Hollande are caught on video, breathlessly moaning “long live the troika” while mending post-election relations.

    Seriously, though, a stick save would almost certainly entail a commitment to all things Greek, Portugese, Spanish, Italian, etc. and more LTRO — lots and lots more LTRO.

    Stay tuned.

     *************

    For the last several weeks I’ve been double-posting pebblewriter.com stuff on the original blog and holding this open for former followers.  This website has been up for nearly a month now, and it’s time to start winding the other one down. [why?]
    If this blog is helpful to you, jump on the introductory prices while they last.  I’ve extended the 10% off discount for all new members through this Friday, the 18th.


  • Still on Track

    ORIGINAL POST:

    In yesterday’s post [see: Two Targets Down], I theorized we would go up and trace out a right shoulder to complete a small H&S pattern in the right shoulder of the larger (completed) H&S.  So far, that’s exactly the way it’s playing out.

    As discussed, the perfectly-formed shoulder would take prices up around 1370 — a shoulder line parallel to the neckline, as well as the neckline of the larger H&S pattern.

    The 60-min RSI chart from May 8 forecast a back test of the solid yellow TL intersecting with the downward sloping yellow channel.  We got that, along with a clear rising wedge in the RSI to go with the triangle in SPX itself.

    From a timing standpoint, the ideal pattern will take 3-4 more days to play out — though there’s enough of a right shoulder now to consider it legit.  The target looks to be about 65 points below wherever we break back through the neckline, probably around 1275 (1340-65=1275).

    This is actually lower than the larger pattern’s target of around 1295.  I favor 1295 simply because I think the bulls will throw a fit if we threaten to take out the 1292 October highs.  Some of you more savvy Elliotticians know better than I what turmoil that would bring to the bullish case.

    More later.


  • Update on NDX: May 8, 2012

    UPDATE:  May 8, 2012

    The past two forecasts are still holding up well. I still believe we’re likely to test the large red rising wedge as detailed below.

    The completed H&S pattern targets 2446, which the large red RW crosses around May 16.  It also permits a wave down that doesn’t overlap with the October highs, which seems the most likely case.

    The RSI falling wedge we looked at last week is still progressing.

  • Update on NYA: May 8, 2012

    UPDATE:  May 8, 2012

    NYA has completed its Head & Shoulders pattern, targeting 7340 on the downside.   The Mar 30 forecast has played out nicely, although it took a little longer than expected.

    My gut is that NYA will remain stalled between 8300-8450 and not complete the larger Bat pattern at 9679.  I suspect it will chew up the next two weeks or so, ranging from 8100-8450 before breaking down on the smaller rising wedge.

    NYA has also overlapped its October 2011 high, which has serious implications for the Elliott Wave picture, as waves 1 and 4 are not supposed to overlap.

    I’ll defer to folks who know much more than I about EW, but I believe this overlap strongly suggests the past seven months rise is a corrective, rather than impulsive, wave.

    The harmonic picture continues to be a bit obtuse, as has been the case with NYA.  The recent top completed (and overshot) a Gartley pattern.  But, 7340 is pretty much no-man’s land from a harmonic standpoint.  It’s about .500 of the Aug 2011 to Mar 2012 rise, and .707 of the Nov 2011 to Mar 2012 rise.

    It also intersects with the larger rising wedge/channel bound around the first week of August 2012, so we’ll put a pin in that time/date for now.

    Longer term, NYA appears to be tracing out a diamond pattern.  Whether it breaks up (continuation) or down (a top) remains to be seen.  But, the next move would seem to be to the lower bound of the pattern.

  • Bet Your Bottom Dollar

    Interesting setup on DX that happens to complement the SPX/COMP/NYA charts posted Monday afternoon.  Check out the RSI trend line support.

    I’m inclined to believe the next several days will be very good for the dollar.  For equities — not so much.Meanwhile, the EURUSD shows signs of finally breaking down.  Both the pair and the RSI action show a rising wedge that’s bumping up against a well-established channel.


  • Going Out on a Limb

    In spite of the indecision demonstrated in this morning’s post, I’m seeing a channel set up on the RSI that’s tilting me slightly more bearish.  It’s the dashed, red channel on the chart below.

    Remember, everything that’s happened since April 4 is technically a back test of a broken rising wedge — unless we break above 1422.  It’s possibly a replay of the events of Feb-May 2011 [see: Analog Details.]   This back test correlates with a back test of the dashed, yellow TL on RSI (redrawn this morning.)

    Viewed through this prism, the channel makes a lot of sense.  In 2011, a similar channel sent SPX down 45 points or so — but that was after the H&S pattern had played out.  In the current time frame, we had a bounce at the neckline and no follow through since.

    One more thing: the purple trend line intersecting with that RSI channel.  Previous failures to push through it have proven disastrous to SPX.   All things considered, I’m going to layer on more bearish positions — with tight stops.

    The same channel is setting up on NYA and COMP, too.

    Stay tuned.


  • Next Stop 1462? April 27, 2012

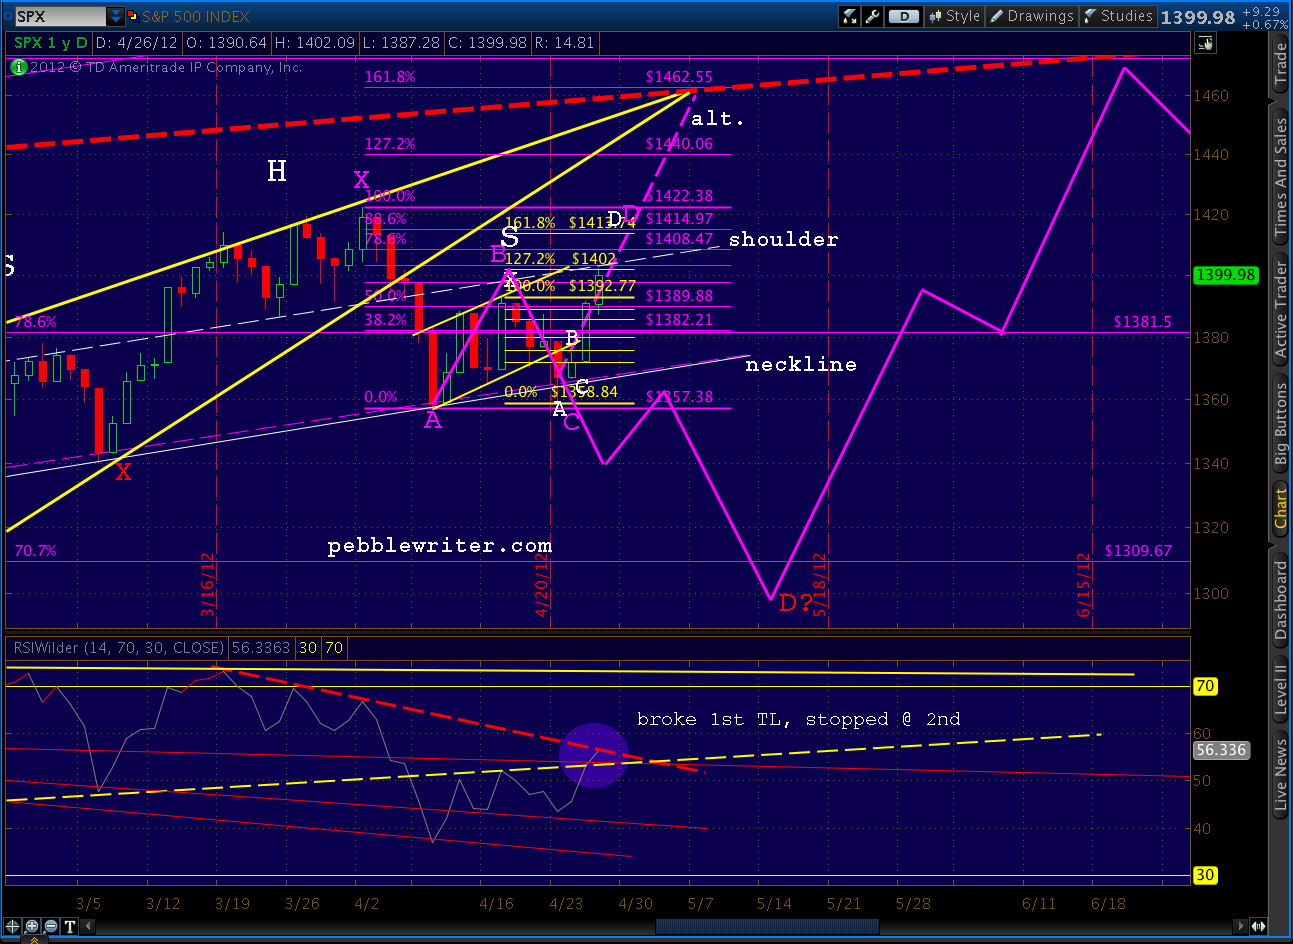
    Yesterday we explored the alternate path in detail, noting that one of the two RSI trend lines we’ve been watching had broken, and the second was coming into play.

    There is the possibility that the downward sloping red, dashed TL will catch it on the way up, but the yellow TL just broken was a major feat.  A close above the TL would imply a definite momentum shift.

    This morning, the second (red, dashed) trend line just gave way, lending more credence to the alternate path higher if — and this is key — we can manage to close above it.

    As can be seen on the chart above, there’s very little in the way of resistance between here and 1462.  We’re at the H&S shoulder line now, and it’s possible that the pattern will still play out.  But, as discussed in Bulls Fight Back, the pattern will start looking lopsided with much higher prices or passage of a few more days before it resolves.  It fails definitively at 1422.

    Harmonics give us some ideas as to the path forward and potential turning points.

    Here’s the bullish case — a Crab (the larger purple pattern) with the 1.618 At 1462.55.  There’s a good possibility that we’d see a reaction at 1414, which is the .886 of a Bat pattern and the 1.618 extension of the smaller Bat (in red, labeled in white) that’s nestled in the last two legs of the larger purple pattern.

    But the ultimate target is Point D at the 1.618 extension of 1462.  This is the apex of the rising wedge pattern (yellow) we’ve been in since 1074 and intersects with the SPX channel mid line (red, dashed.)

    Yet, there are plenty of reasons for the market to turn down and complete the H&S pattern, including the very faint possibility that reality sets in.  Here’s the bearish case — a Butterfly (in red) — that points to a low of 1305-1317.  BTW,  red Point C can go as high as Point A, but no higher, in order for the pattern to hold.

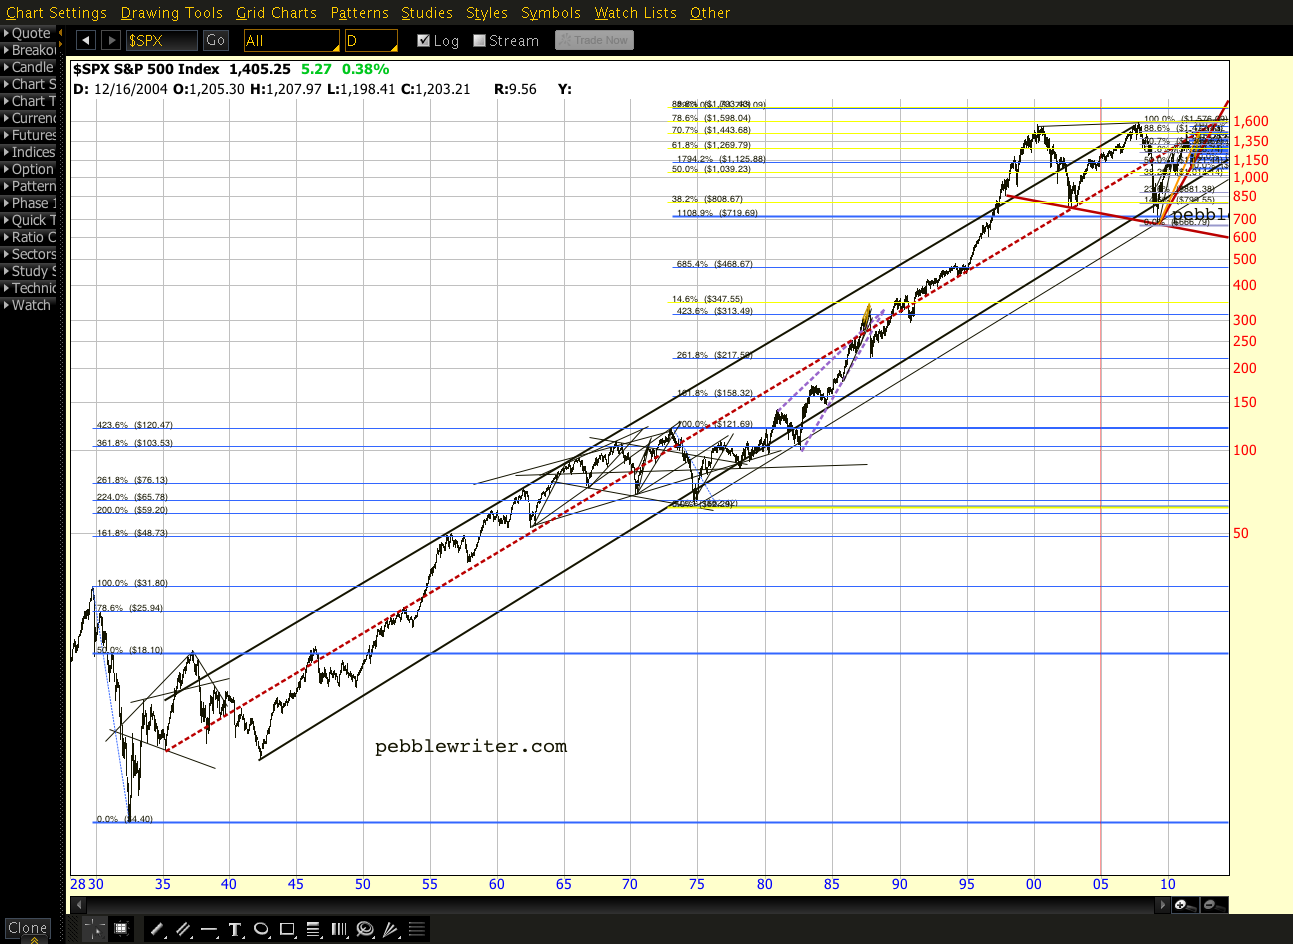
    That red, dashed channel mid line at which either alternative ends is a biggie.  Here’s the view of the past 20 years…

    And, the even more stunning view since 1935…
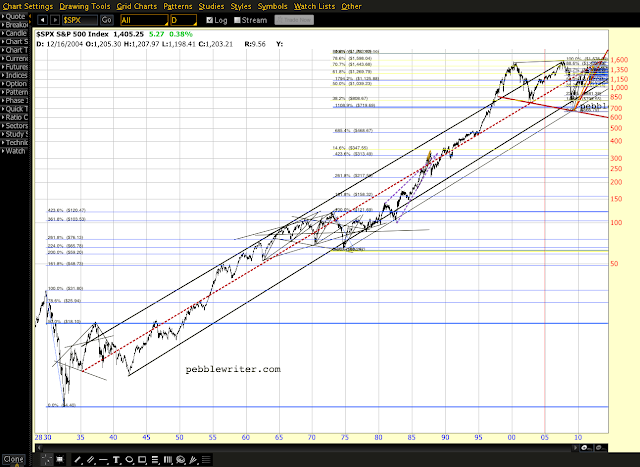
    There’s the possibility of a slight miscalculation when graphing anything over 77 years.  So, when I say it comes in at 1462, that’s an educated guess based on my best interpretation of what I can see.  But, it’s helpful to know that it corresponds with the Crab patttern 1.618 –and is darned close to the Fibonacci .886 retracement level of the 2007-2009 drop at 1472.

    I believe we’re destined to tag that line again before the next big downturn.  But, whether we get there directly from here or after a more extended wave 4 is not clear to me at the moment.  For now, the momentum is clearly with the bulls, especially when we can rally off of horrid economic numbers.

    Personally, I’m reigned in quite a bit right now — at least until the picture is a little clearer.

    **************

    The EURUSD has also defied logic, gaining slightly on the day to the point where it’s exceeding the channel that’s guided it for over a year.  But, the last month has traced out a Gartley that could see prices reverse around the .786 retracement of 1.3297.  Our high for the day so far is 1.3269.

    Stay tuned.

  • Spain Downgraded: April 26, 2012

    S&P cuts Spain two notches, from A to BBB+, based on contracting economy…cites declining disposable income, private sector deleveraging, front-loaded fiscal consolidation and an uncertain outlook for external demand in many of Spain’s key trading partners.

    This could be the catalyst for the turn we’ve been wondering about.  It could be the difference between the H&S and analog playing out versus our top alternative.  Notice that we did break the RSI trend line identified the other day (yellow, dashed) but were stopped by the 2nd one we discussed earlier today.  Today’s high was right at the shoulder line of the H&S pattern, and retraced a Fibonacci .707 of the recent 1422-1357 decline.

    Keep an eye on the CDS and bond rates for Spain/Portugal/Italy and key regional banks.  Remember, all these rates are available right here, just go to the economics menu and select market data.