

Alice laughed: “There’s no use trying,” she said; “one can’t believe impossible things.” “I daresay you haven’t had much practice,” said the Queen. “When I was younger, I always did it for half an hour a day. Why, sometimes I’ve believed as many as six impossible things before breakfast.”
― Lewis Carroll, Alice’s Adventures in Wonderland
The market never ceases to amaze me. Despite all the ingredients being in place for a sizable correction, it’s sailing along as though everything were copacetic.
Negative divergence abounds. The correlated currencies are all selling off. Gold is down. Silver is down. Even AAPL is down. Numerous indices have completed bearish Harmonic or Chart Patterns.
The Fed let slip yesterday that the adrenaline drip will soon be removed — leaving banks without a buyer for their underwater mortgages and the stock market without any downside protection. They’ve finally admitted what we’ve all known for some time: QE’s effect is diminishing, and the risk is growing.
The budget showdown is still ahead (the part of the fiscal cliff that really matters.) The most fractured Congress in modern history, which utterly failed to resolve the important issues, will now turn the task over to an arguably more partisan Congress.
The country’s AAA credit rating is hanging by a thread at both Moody’s and Fitch. A downgrade by either would require massive selling by institutions which require at least two AAA ratings in order to comply with their investment policies (especially insurance companies.)
Unemployment has reportedly declined, but only because we no longer count the dejected job seekers who are leaving the work force in droves. Include them, and the actual picture is startlingly bleak. (source: Shadowstats.com)

The EU is officially back in a recession (though it never really left.) Its banks are being kept afloat by the ECB/ESM, which is exchanging (somehow AAA) paper backed by shaky sovereigns for junk sovereign debt as fast as it can. Meanwhile, unemployment continues to soar.

The big 2013 headline that isn’t (yet) is the global derivatives debacle: $700 trillion — over 10 times the global economy — of unregulated, unpriced, unreported private contracts which have been sliced and diced so many times that no one has the slightest notion what the risk really is — except that it dwarfs the capital of the banks that hold it.

In my opinion, the only things keeping the economy and the market afloat are the unrelenting screech of MSM fairy-tale “good news” and the Bernanke Put (the Fed’s money printing and plunge protection operations.)
As long as these two factors can outweigh the negative fundamental picture, the market stands a good chance of rising. Take one of them away, and the resulting crash will be swift and severe.
That said, I’ve spent the past two days assessing the current state of our analog and forecast. I’ve quantified it as best I can in an attempt to eliminate my admittedly negative bias. I’ll lay it out over the next several hours, a few charts at a time.
If you’d rather skip to the punchline, I’m still bearish. In the absence of a push through 1474, I think we’re in for a sizable correction and remain short from 1462. If 1474 is broken, everything changes.
For members who enjoy getting their fingers dirty, stay tuned.
* * * * * * * *
About an hour ago, we completed a Bat Pattern which is nestled inside of a Bat Pattern which is nestled inside of a Bat Pattern.


UPDATE: 3:15 PM
RSI channels show how much is riding on this moment. A push through the top of the purple channel brings the red channel mid-line into play. Could it correlate with 1474, or maybe just the next channel line on the intra-day?
I’m not sure. The intra-day 1.272 is 1468.17 and the 1.618 is 1471.61. A double-top would be a real nut-buster.
All I know is there’s still negative divergence across the board, so I don’t expect the red mid-line to be broken.
 My apologies for the delay in getting the forecast charts up. They’ll have to wait until after the close. I’ve been distracted by the melt-up, checking and re-checking my charts to see what I might be missing.
continued for members…
All the bearish indicators are merely taking a breather, though SPX is responding as though something very positive is in the offing.
Bottom line, I see this as a fakeout — not a breakout. In the absence of a move through 1474, I’m going into the weekend short from 1462.
SUNDAY, JANUARY 6: FORECAST UPDATE
2000 TOP: DAYS
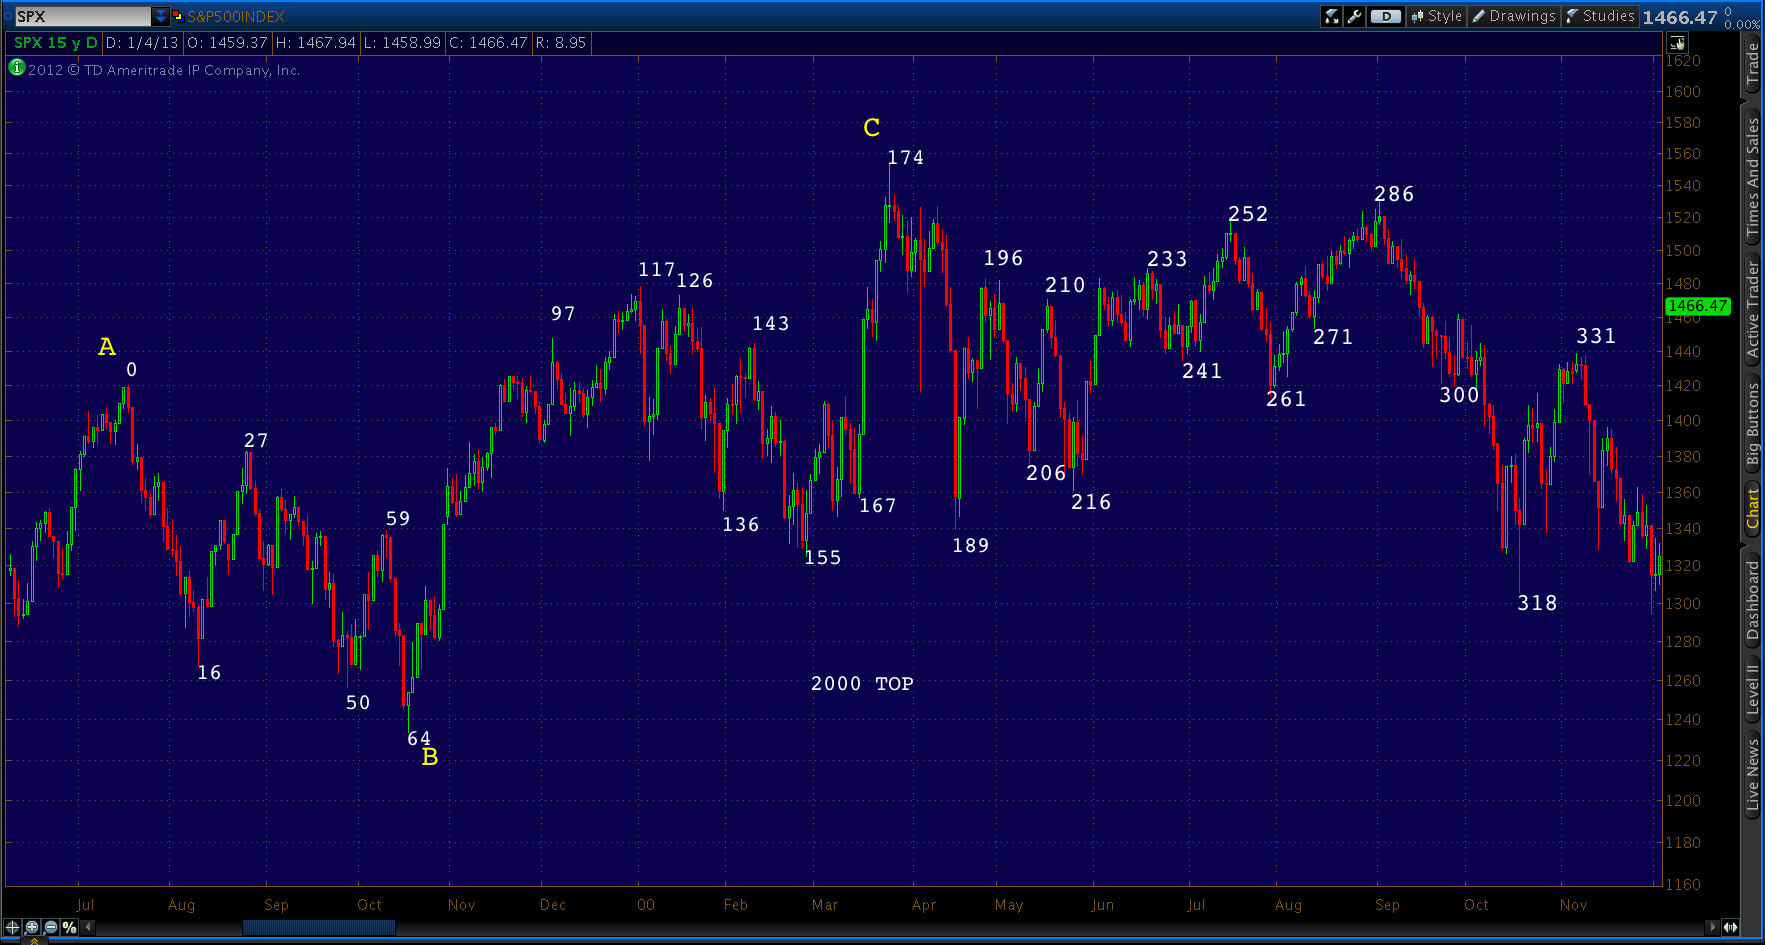
2000 TOP: TIME FIB
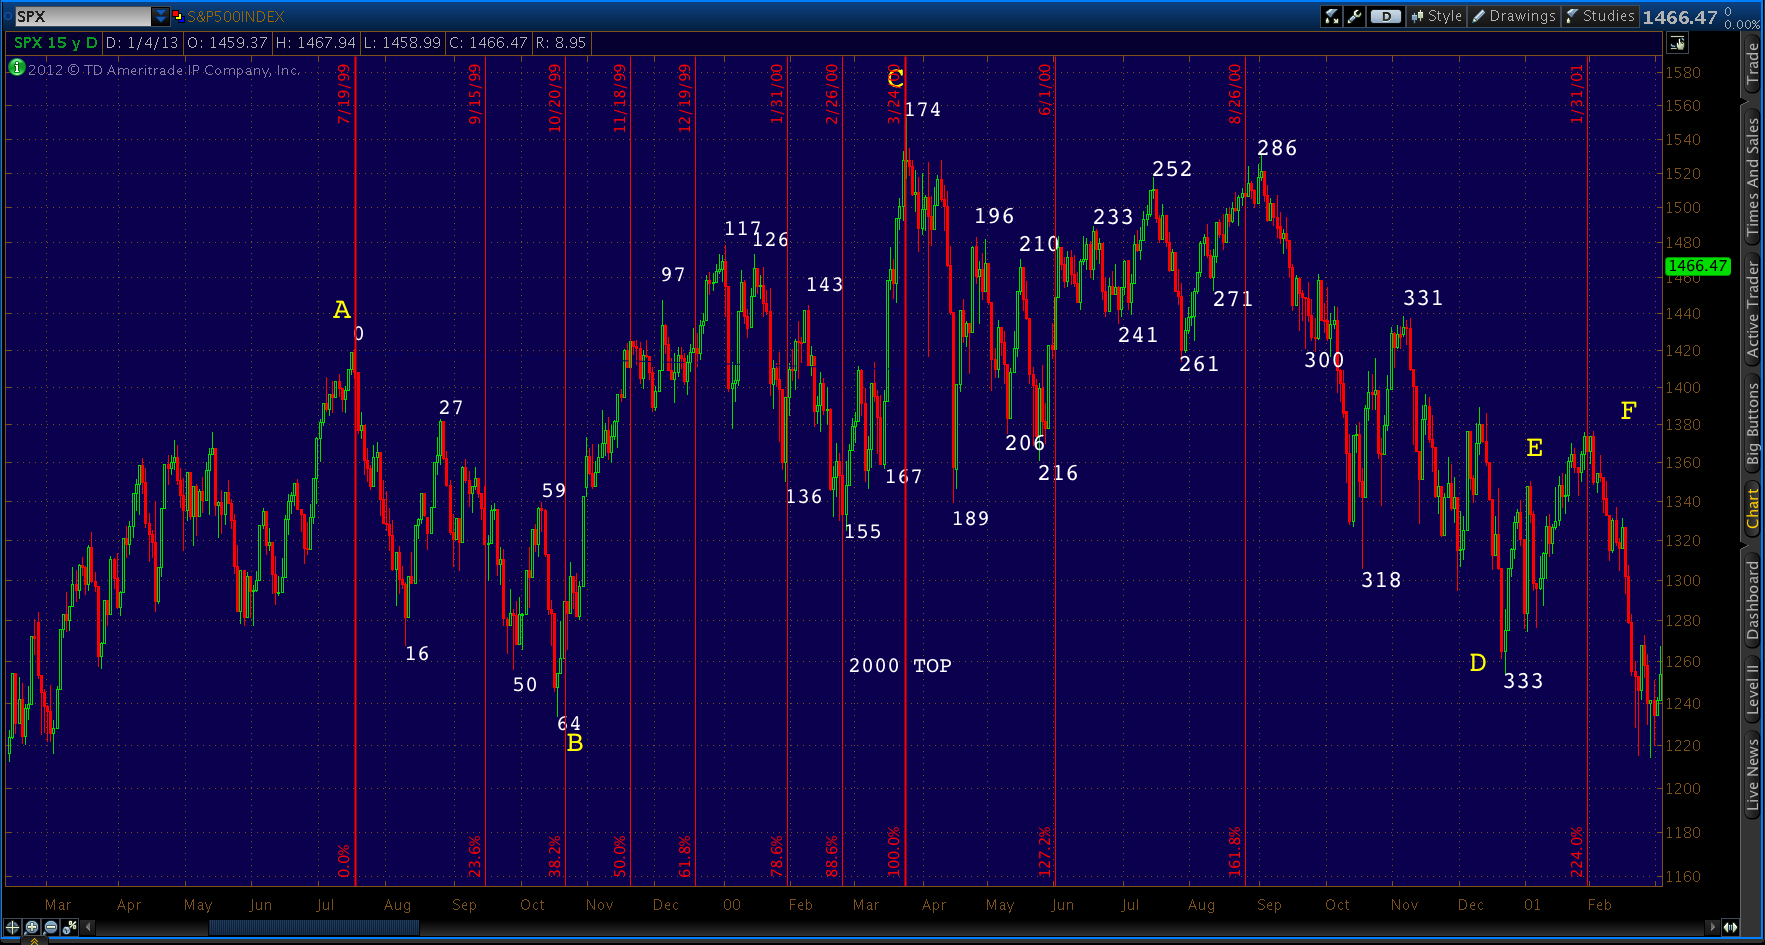
- B = .382 of A-C
- From 0-64-117 = 1.272
- 117-155-174 = 1.272
- 1.618 is a high
2000: PX FIB
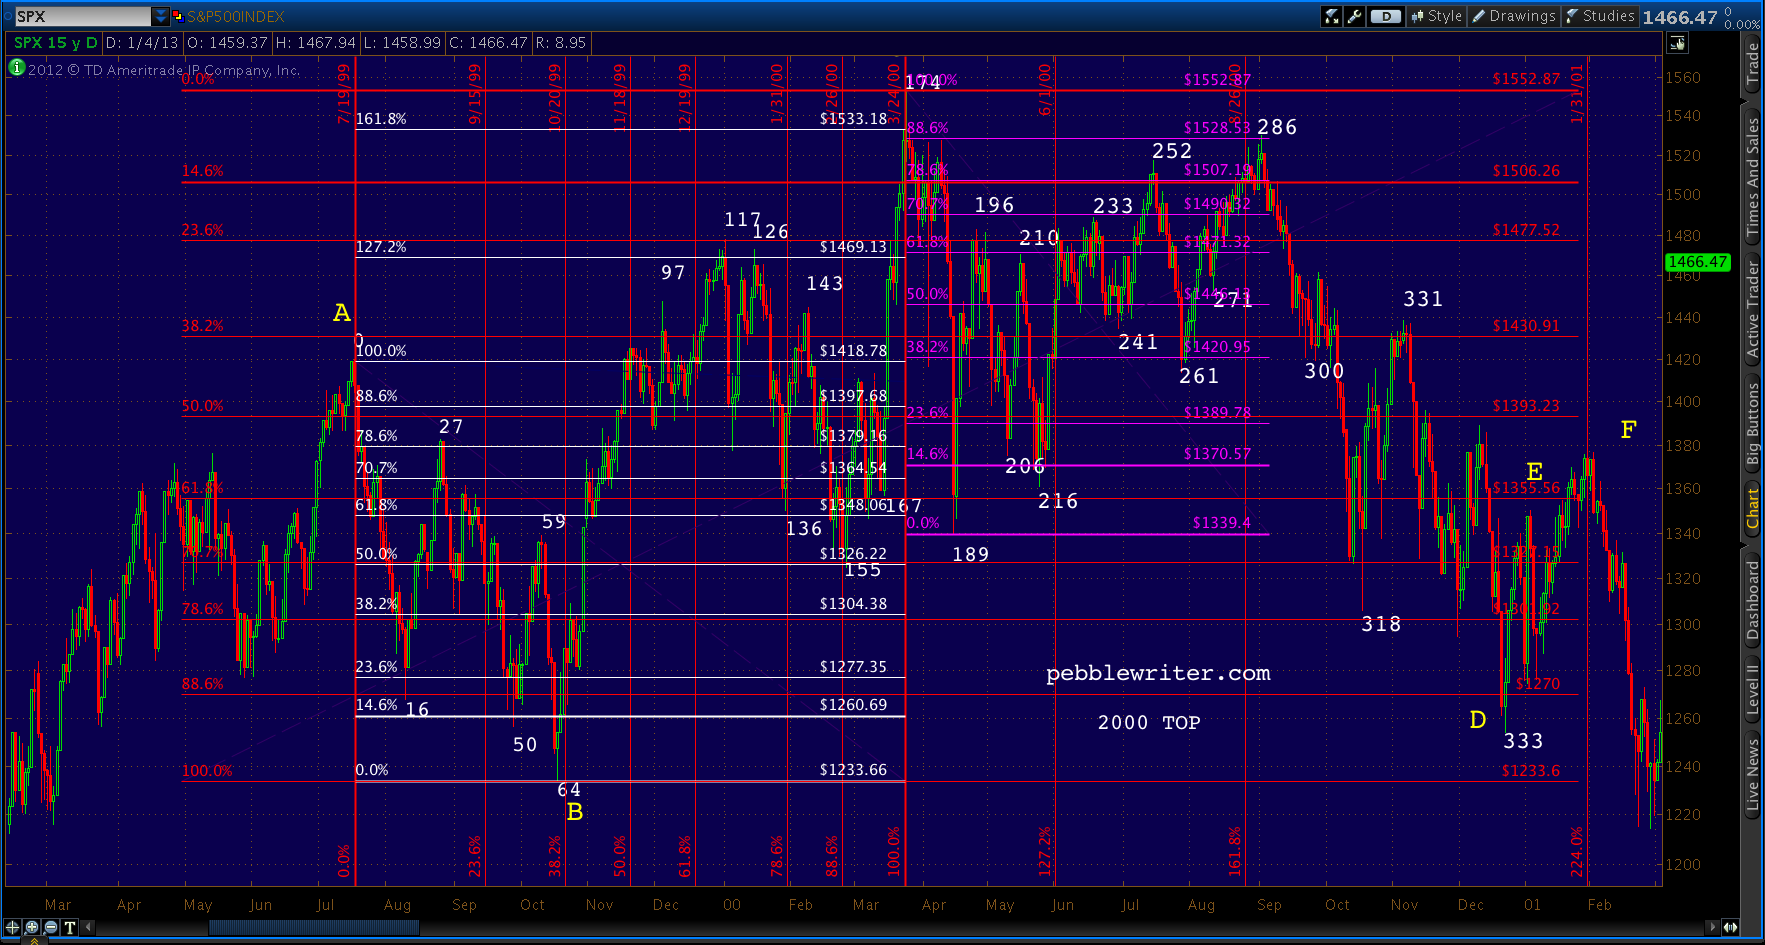
- A-C = 1.618
- D/B = .886
- day 286/174 = .886
- 0-64-117 = 1.272.
2007 TOP: DAYS
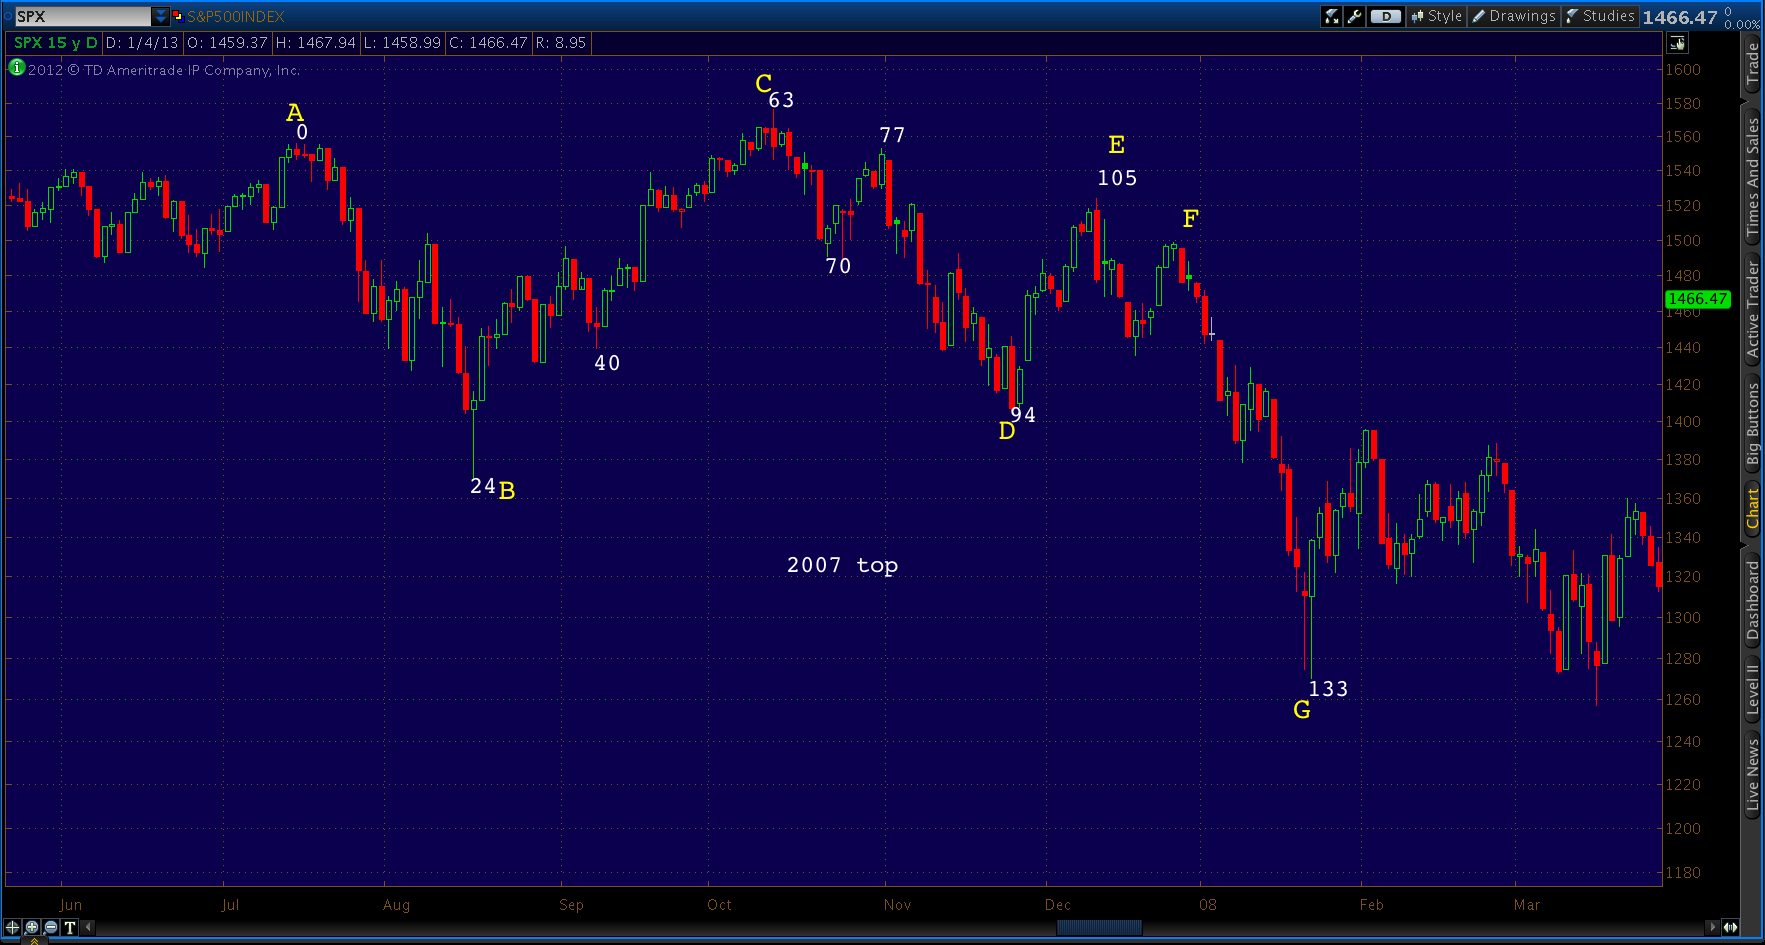
2007 TOP: TIME FIB
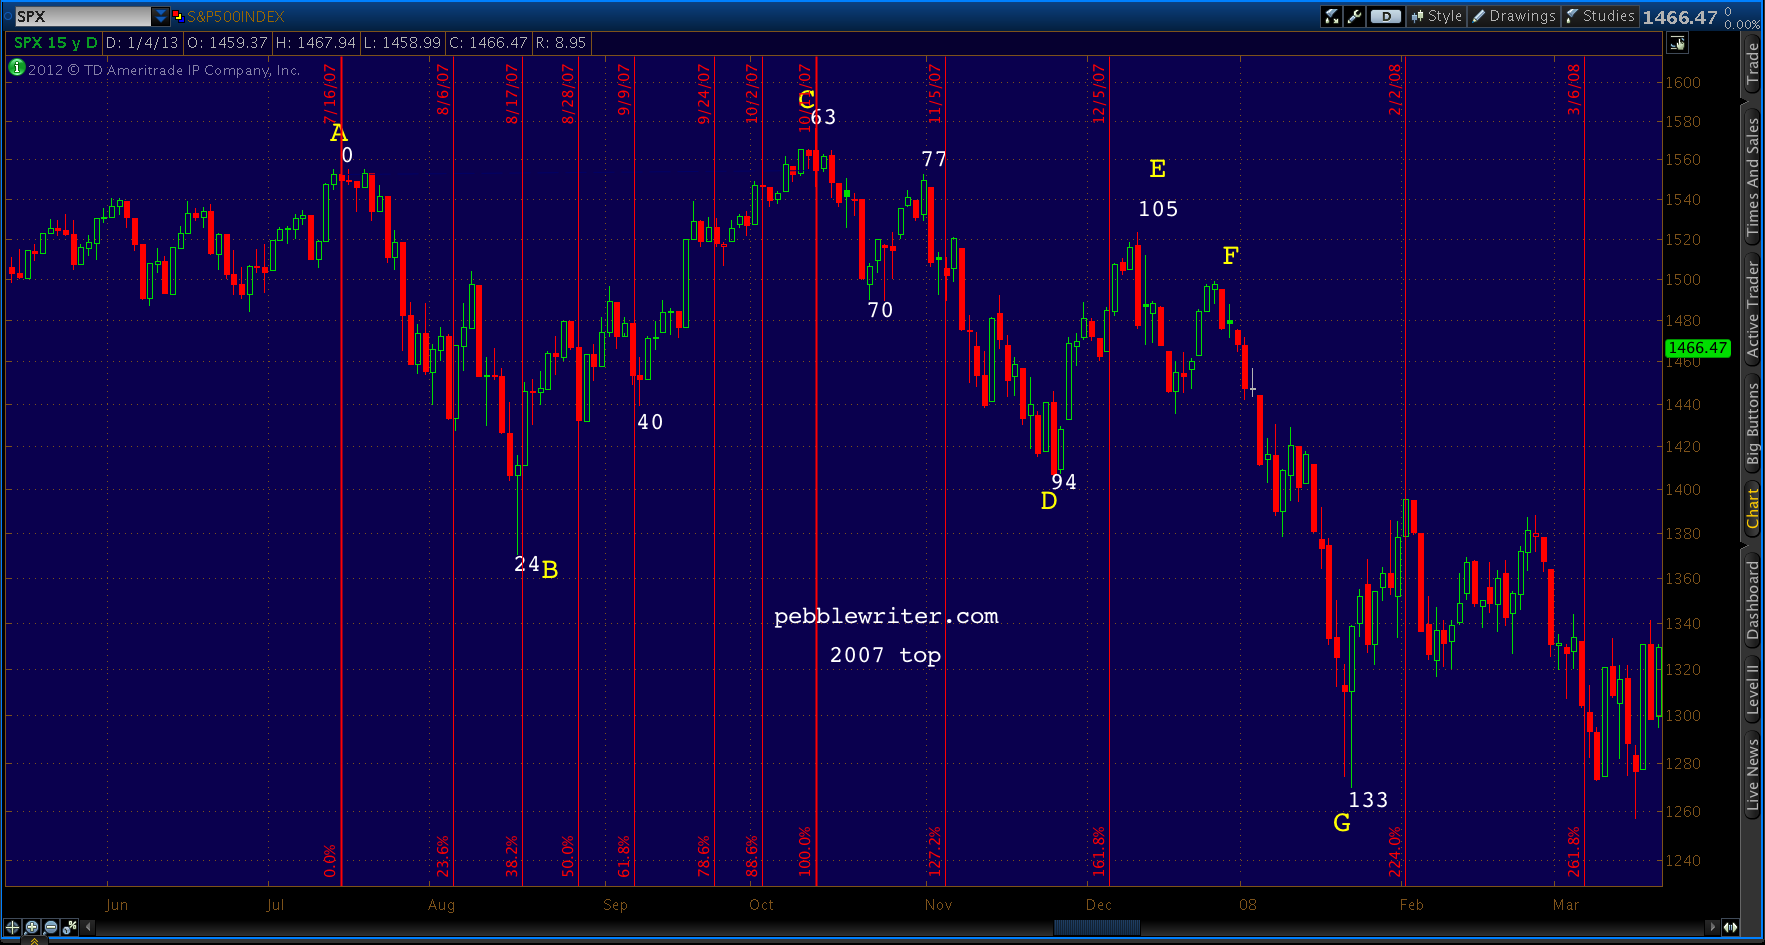
- B = .382 of A-C.
- 1.272 & 1.618 are both highs
- G roughly the 2.24
2007: PX FIBS
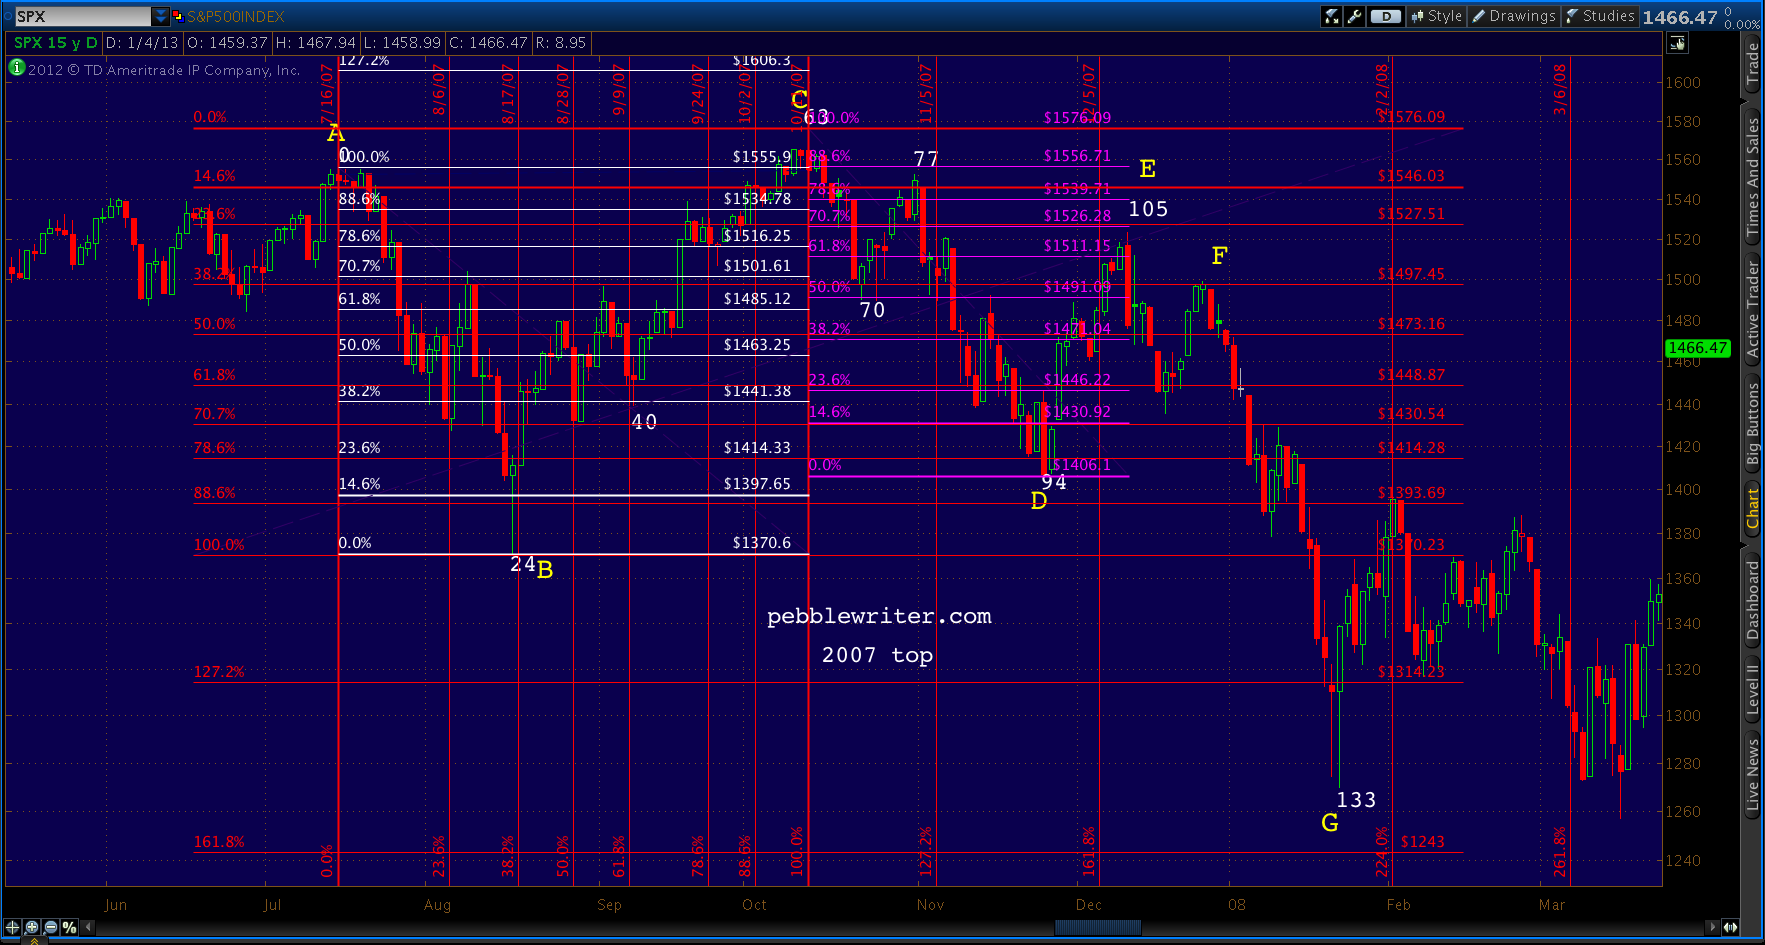
- A-B-C ~ 1.11
- B-C-D = .886
- 49-66-70 = .618
- G = 1.618 of B-C
2011 TOP: DAYS
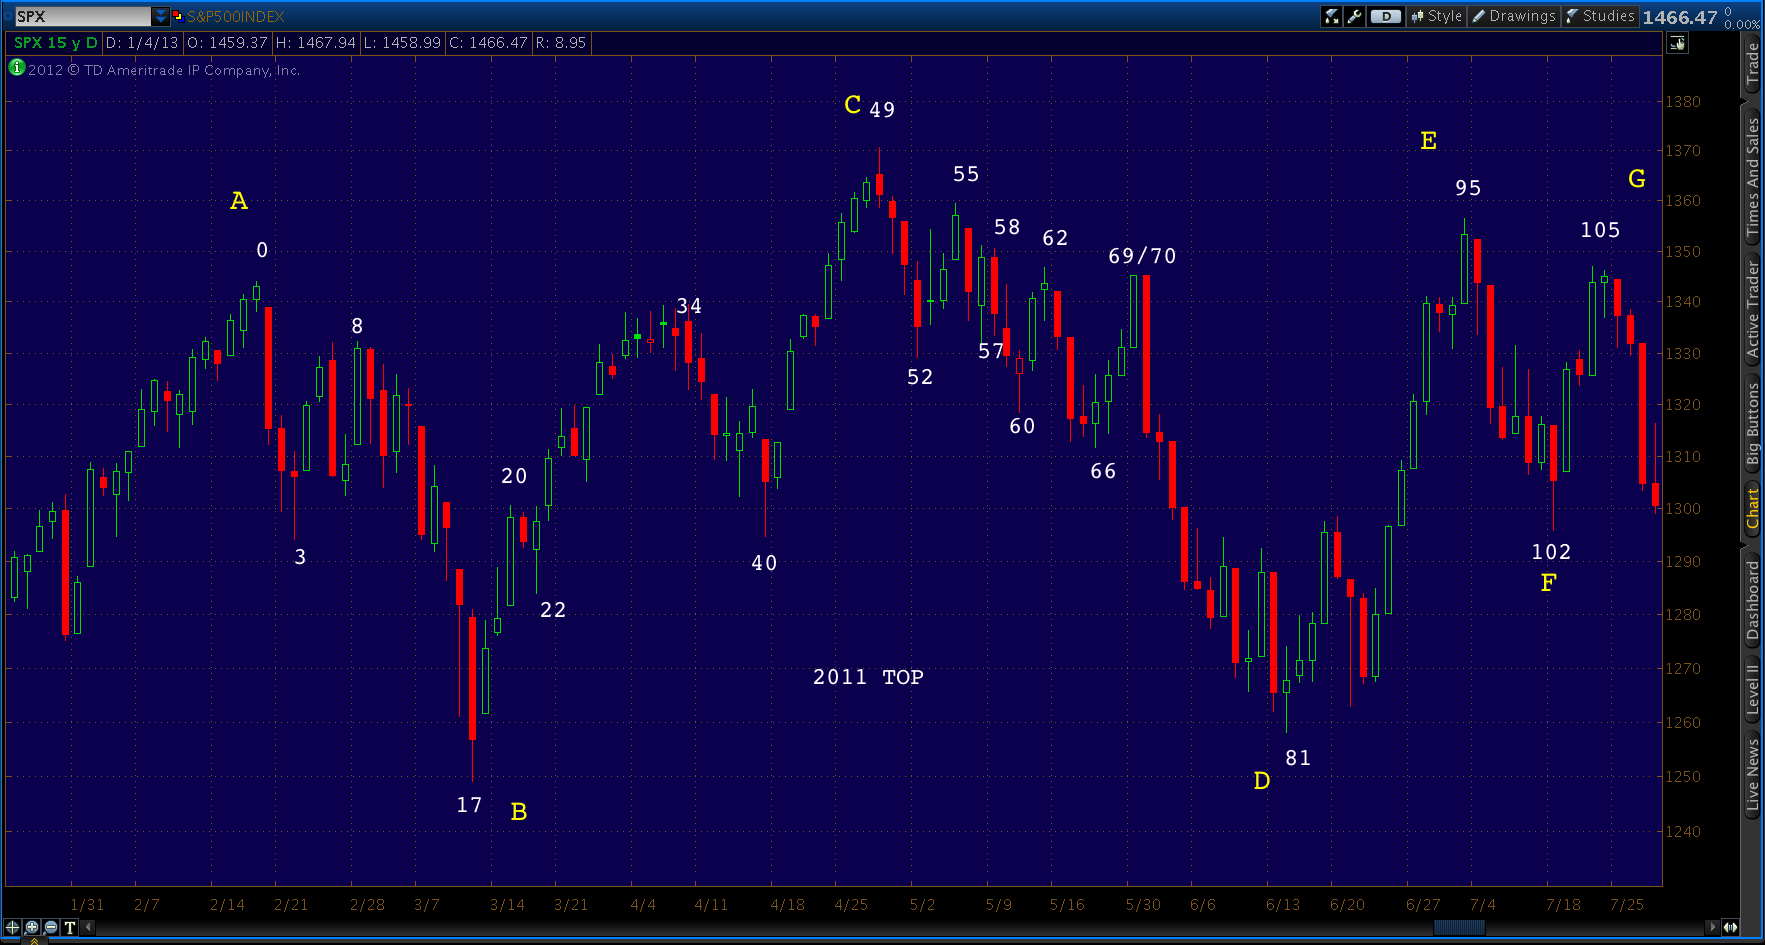
2011 TOP: TIME FIBS
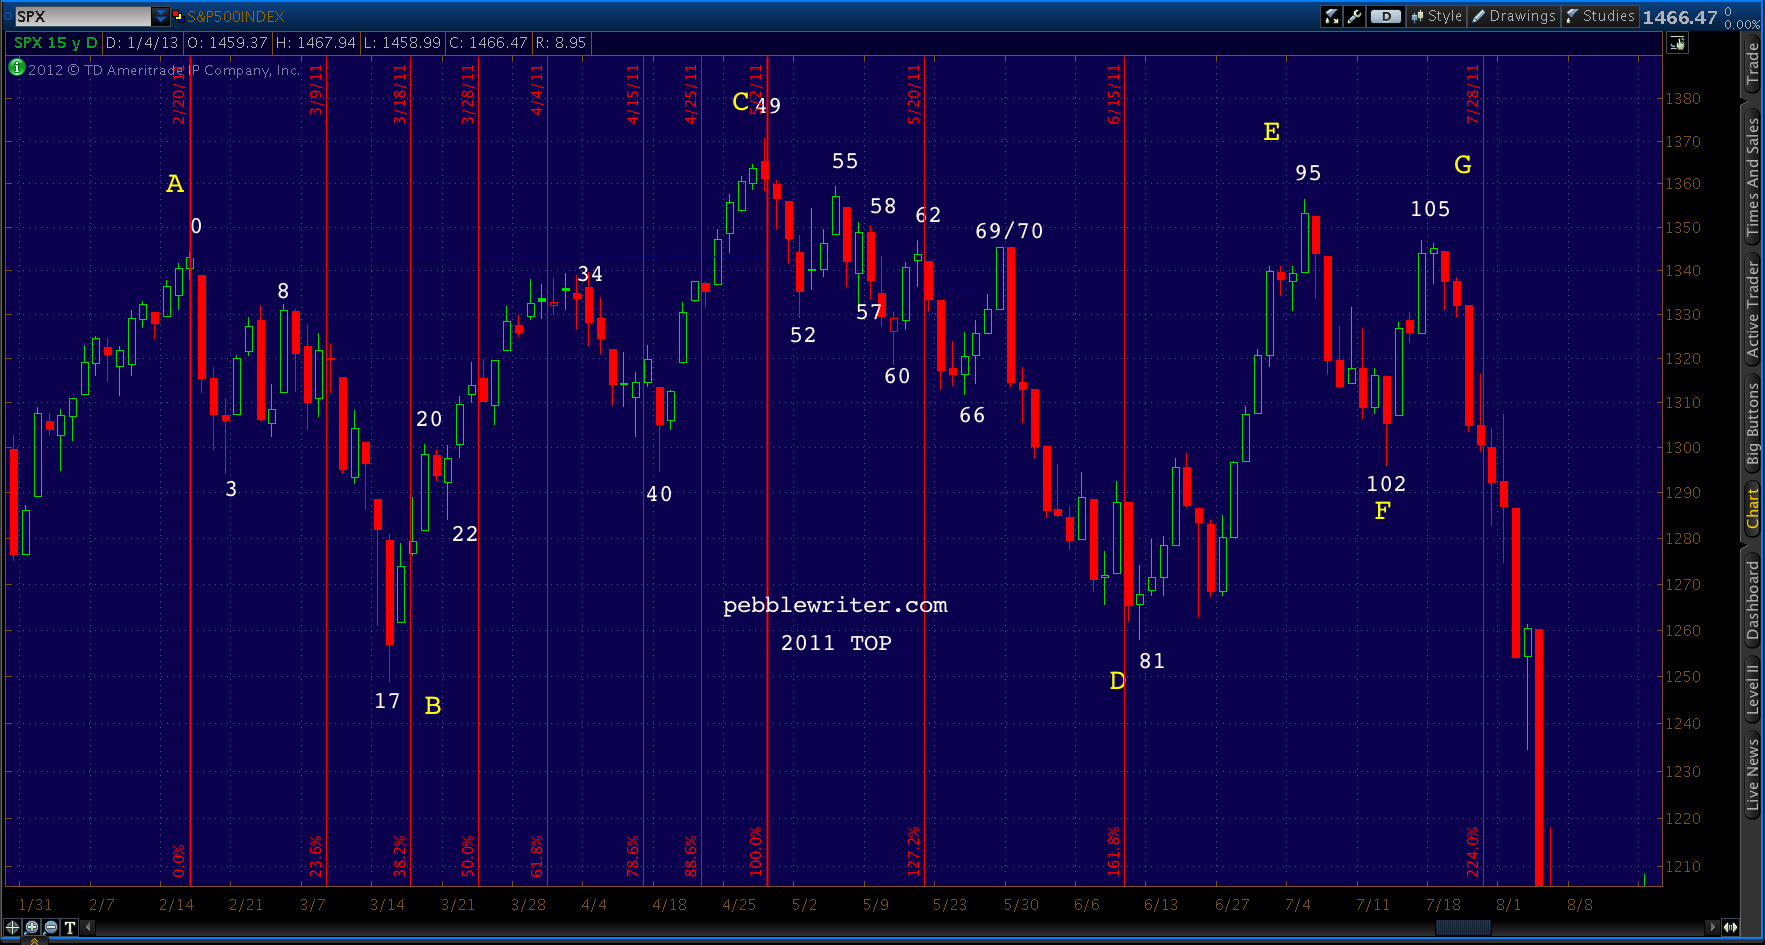
- B = .382 of A-C
- D = 1.618
- H = 2.24
- C = .500 of A-E
2011 TOP: PX FIBS
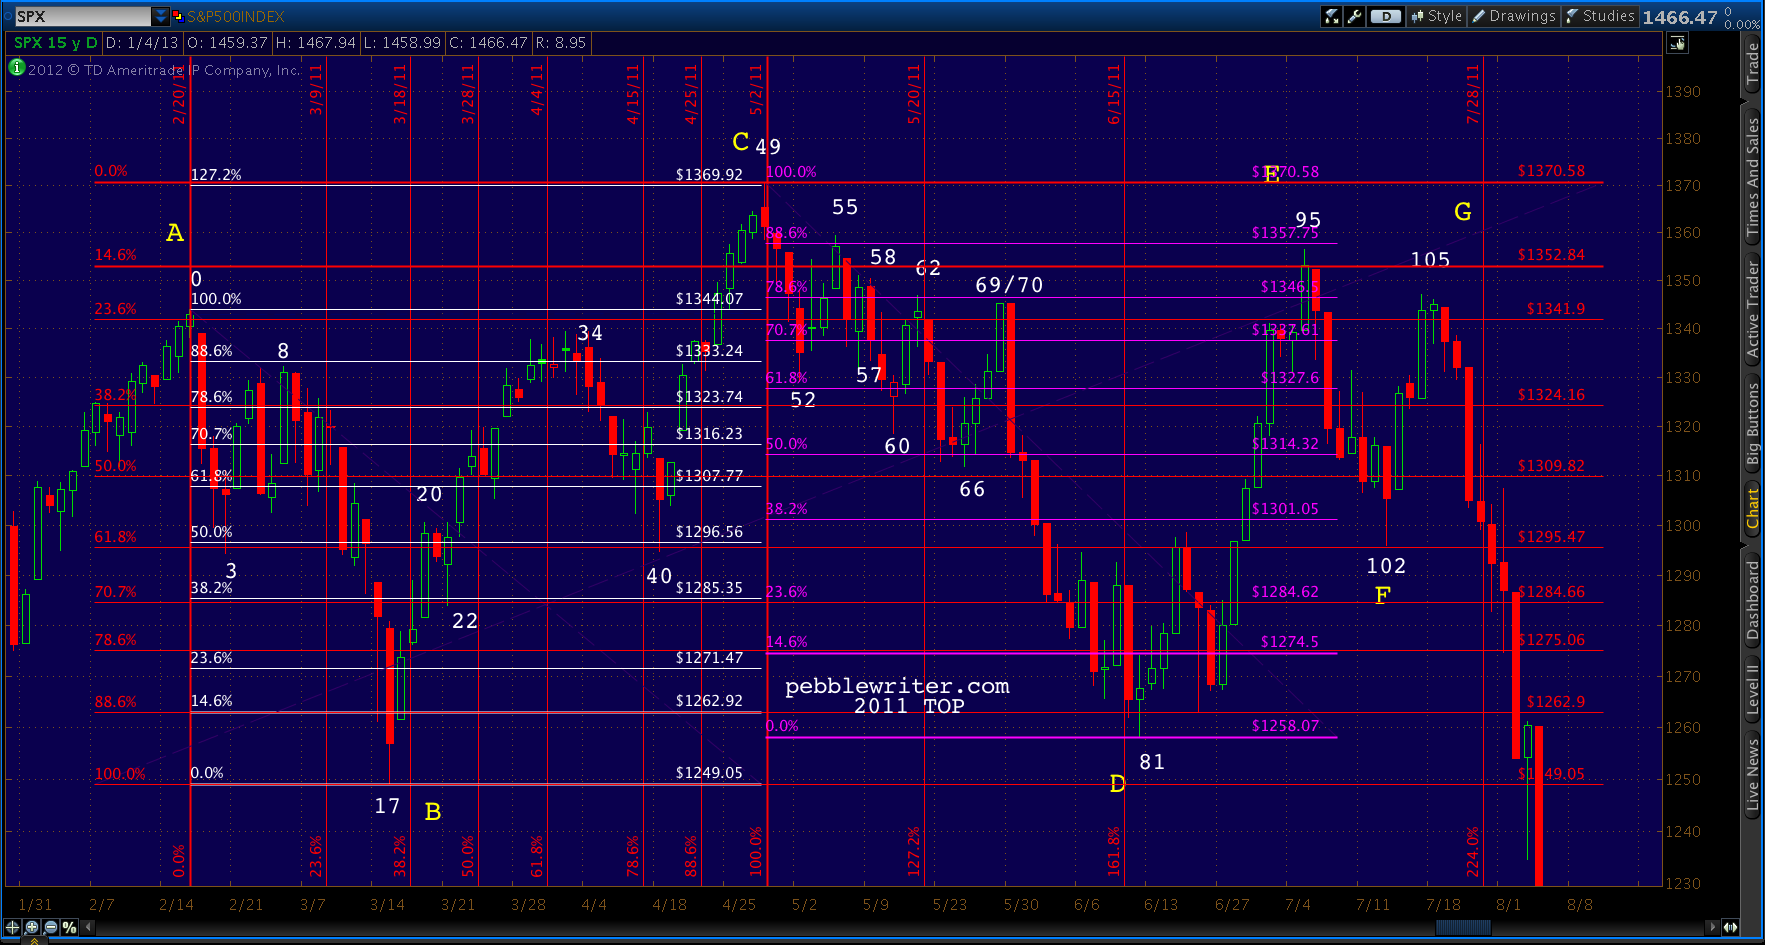
- A-B-C = 1.272
- 49-66-70 = .618
- C-D-E = .886
- B-C-D = .886
2012 TOP: DAYS
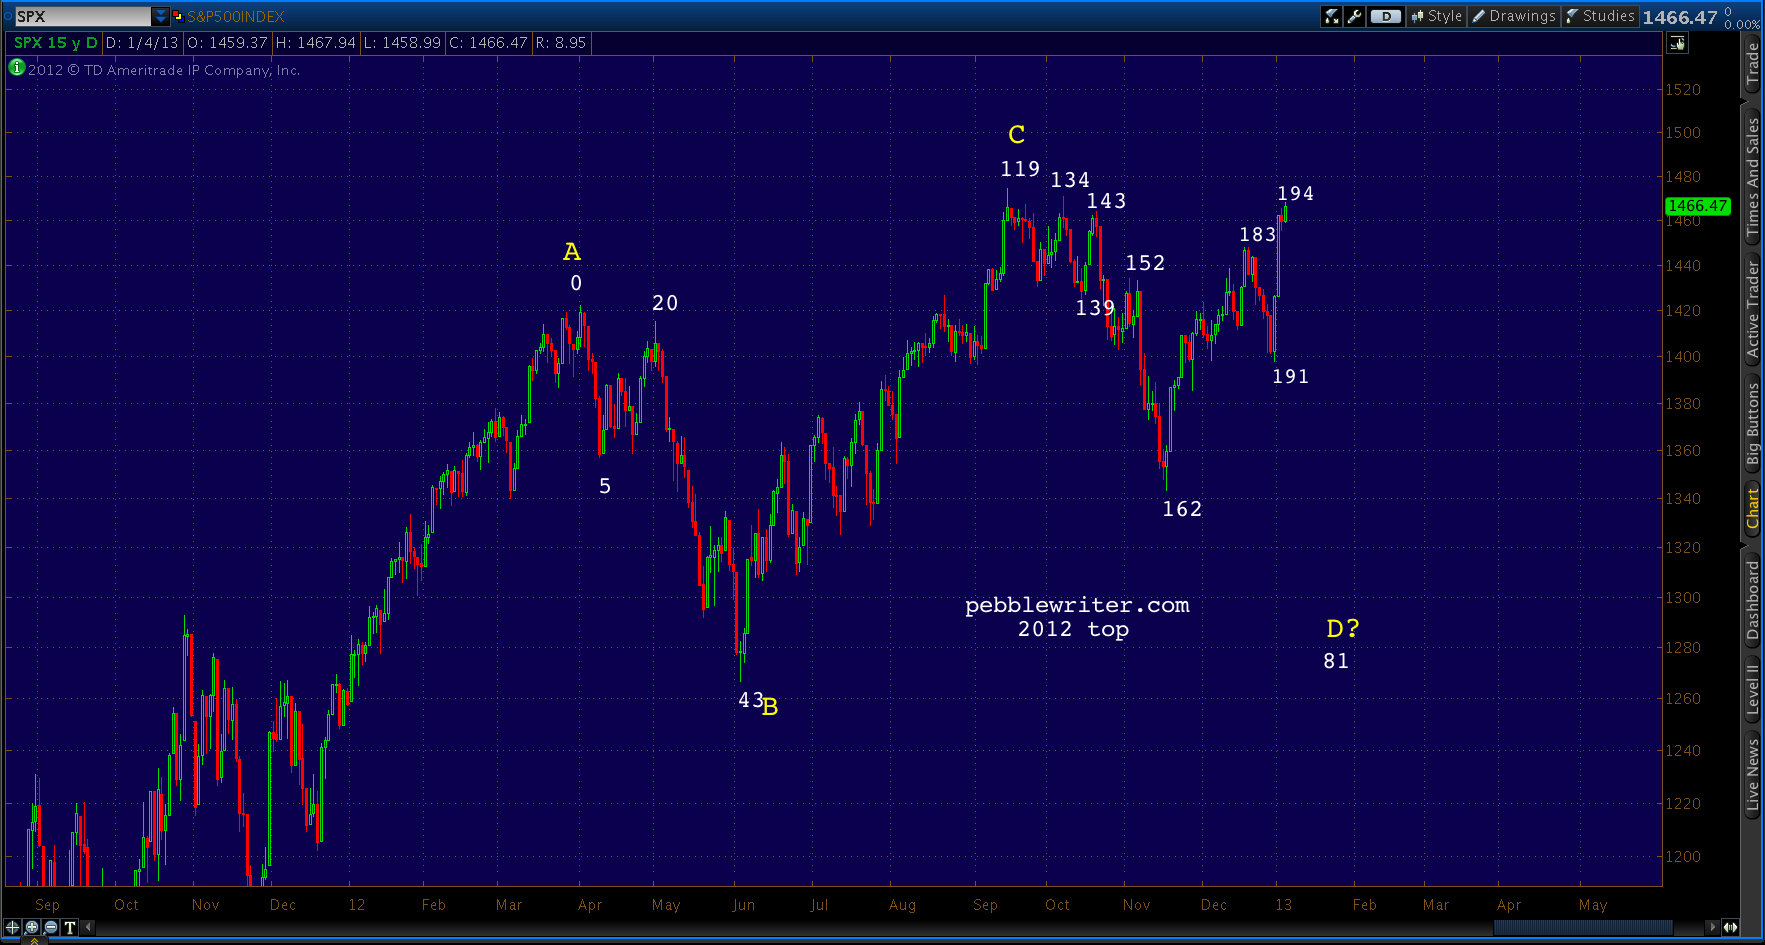
2012 TOP: TIME FIB
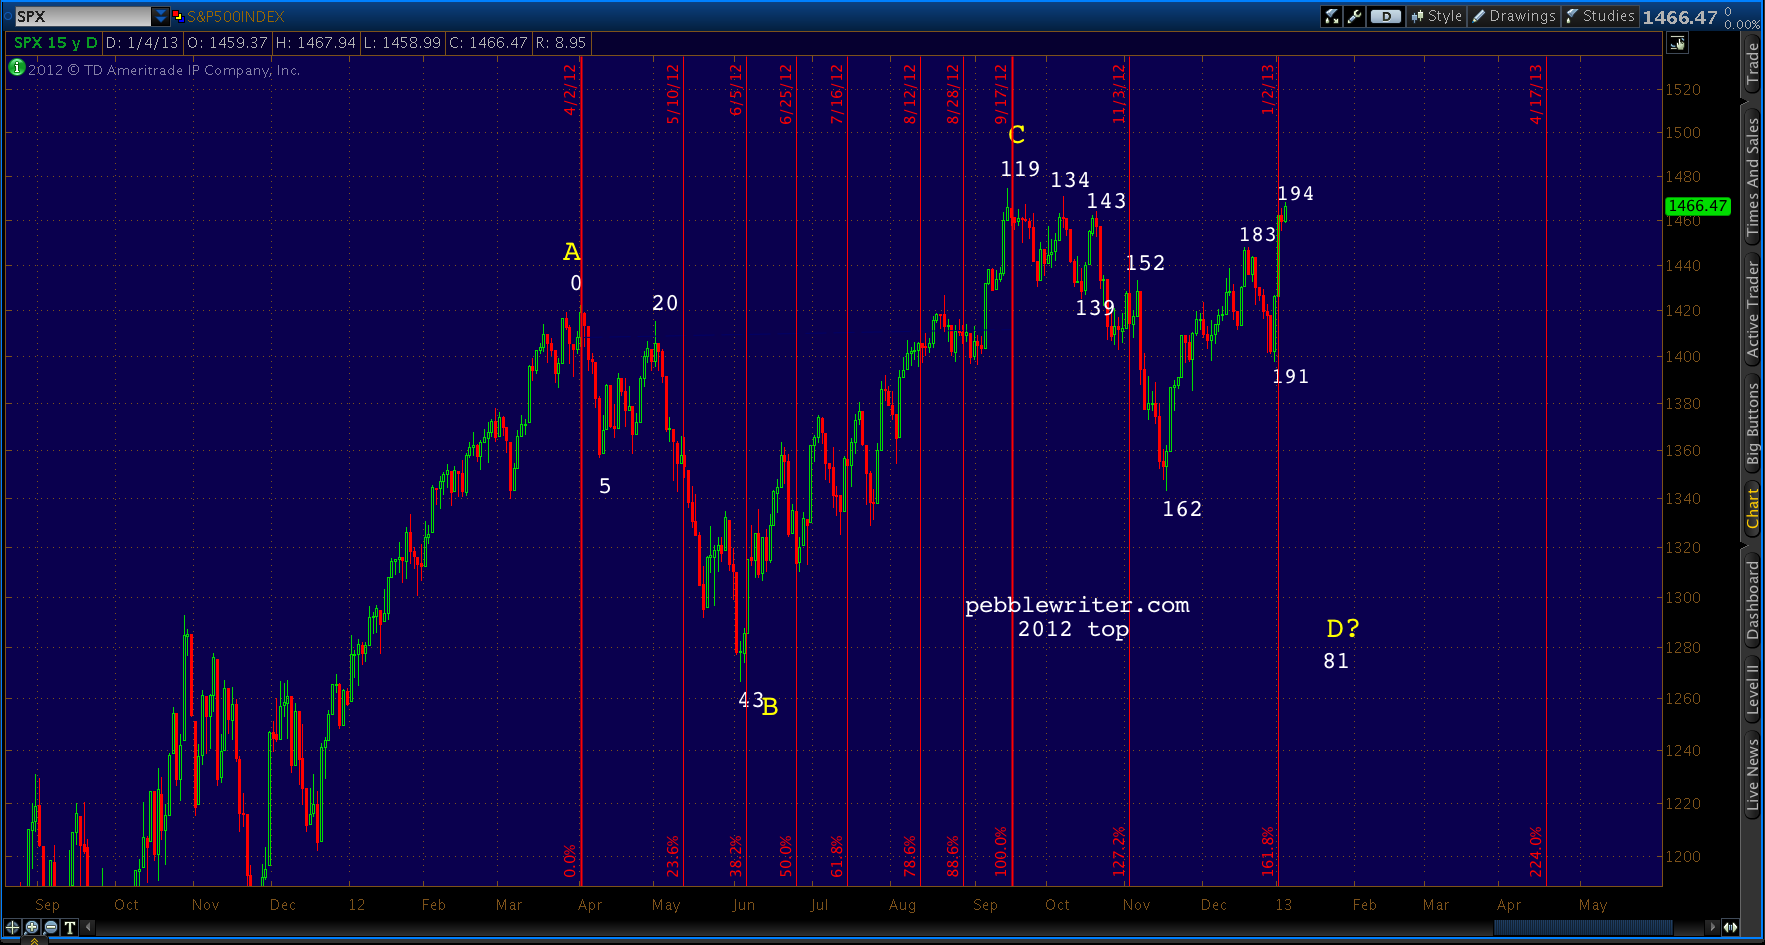
- B = .382 of A-C
- 1.618 is a high
2012 TOP: PX FIB
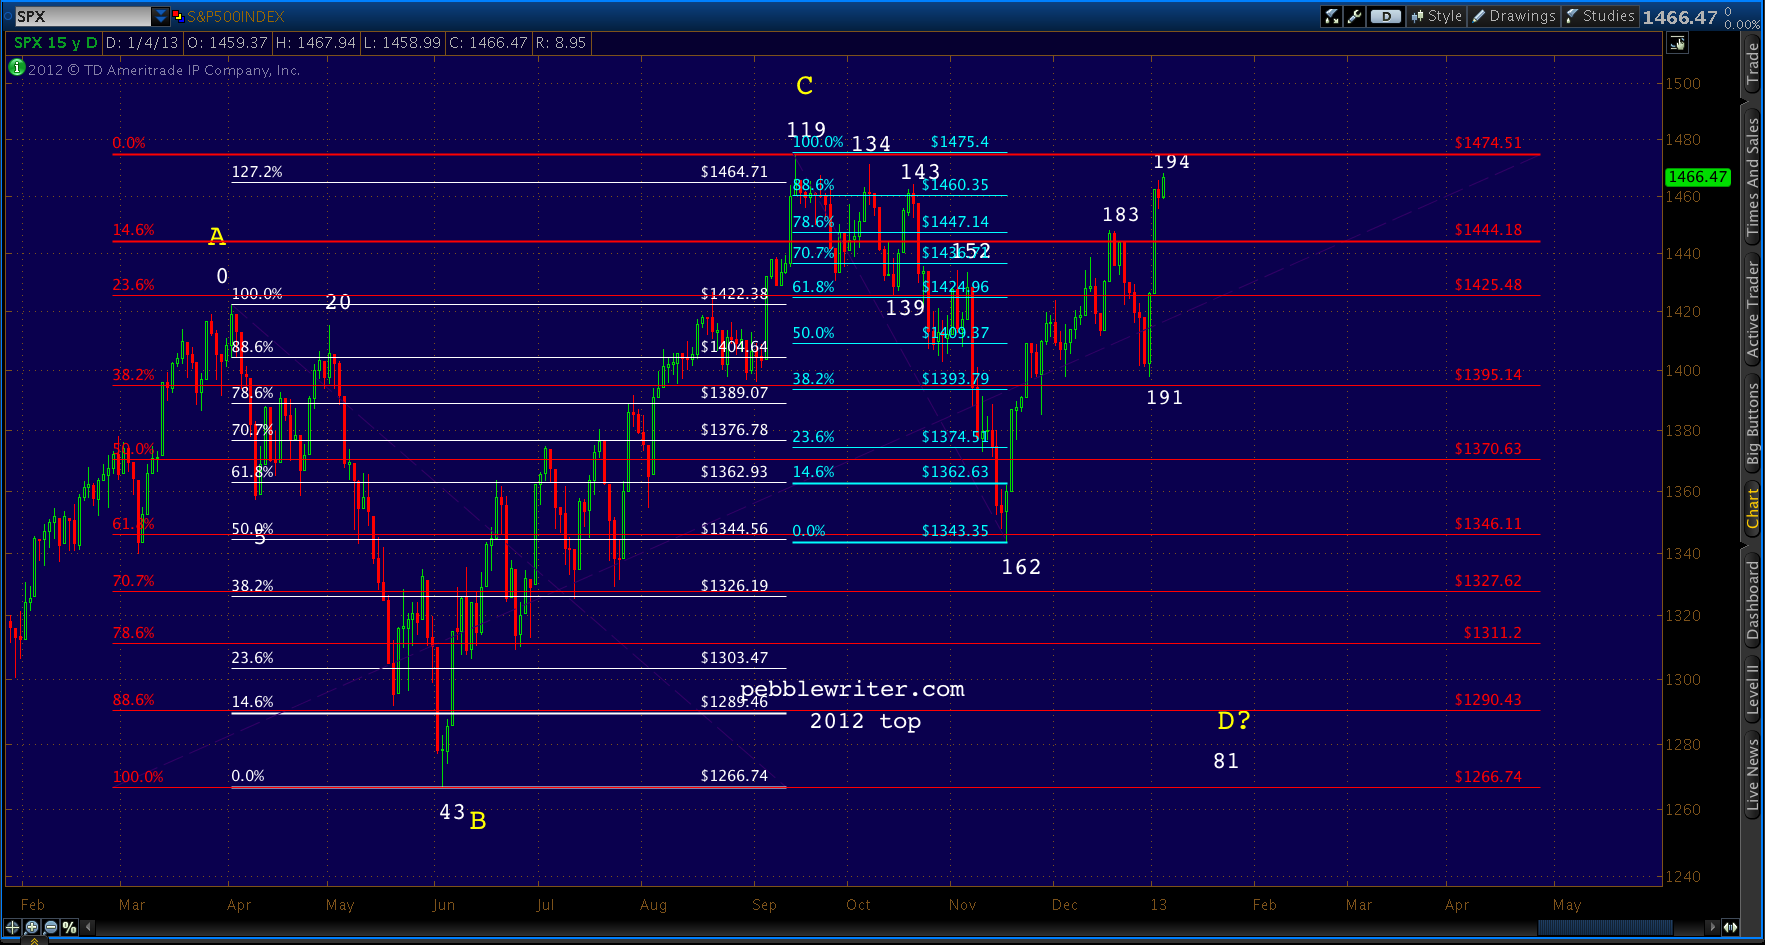
- A-B-C = 1.272
- 119-162-194=.886
2012 vs 2011 ANALOG:
From a day count and time Fib perspective, 2012 matched 2011 very well through day 183. Each 2011 session translated into about 2.4 sessions in 2012.
The price Fib comparison was pretty good. Day 162 in 2012 was a slightly deeper .618 retrace of B-C (versus .500 in 2011.)
The best fit from a time perspective, however, called for a Point D around day 194. The reversal at Day 191 (the Fiscal Cliff “fix”) to go higher, slightly exceeding the .886 retrace of 110-162, was not in keeping with the 2011 pattern at all.
It was similarly not a great fit from a time Fib standpoint. Point D in 2011 came at the 1.618. That would imply a 180-pt drop this week in order to “catch up.”
The price Fib comparison between 2012 and 2011 has been pretty good through Day 162, though Day 162 in 2012 was a slightly deeper .618 retrace of B-C (versus .500 in 2011.) Point C for both was a 1.272 extension of A-B.
As noted above, the push to just beyond the .886 of 119-162 last week was also not in keeping with the 2011 top — which retraced just .618 of the previous drop.
One possibility is that the time correlation changed somewhere along the way (it happened in the 2011 v 2007 analog.) If we count Day 162 as Point D, for instance, then we could call Day 194 the equivalent of Point E. But, I view this as a bit of a stretch.
Summarizing, for the 2012 as 2011 analog to hold up well, we would need to see a very rapid and deep decline in SPX this week.
2012 as 2007 ANALOG:
First, remember that the 2011 v 2007 analog was a very good one. While the day count began a little “off”, it was very strong after Point C — the respective highs. The one post-high difference was that 2011’s final ramp (before the big plunge) was delayed by a few days. But, the faster crash made up for the time difference.
So, from a timing standpoint, we should expect 2012 to fit 2007 about as well as it did 2011. And, in fact, it has. From a day count standpoint, the conversion has been about 2.15:1. That is, each 2007 session has been equal to about 2 days in 2012.
Point D in 2007 came at 105 days. The equivalent Point D in 2012 would thus be session 205 — January 22. This certainly seems a more reasonable pace for any coming decline.
The time Fib comparison is off here. In 2007, Point D came before the 1.618. As mentioned above, we’ve already passed the 1.618 time Fib in 2012.
From a price Fib standpoint, 2012 and 2007 are only weakly correlated. 2007’s Point C was about a 1.11 extension of A-B versus 2012’s 1.272. And day 70 in 2007 was even less than .500. Point D in 2007 came in at slightly less than .886 — but close enough to be considered a Bat Pattern completion.
In summary, the 2007 comparison is pretty good — as long as we get the sell-off I’ve been expecting very soon. We have a little more wiggle room from a time standpoint — through January 22 versus “now.”
If nothing else, the 2011 v 2007 analog shows us that time shifts can and do occur. It wouldn’t surprise me if the fact that analogs are becoming more recognized and accepted causes some temporal and price shifts as market makers trap those who expect an exact replica of the previous top.
2012 as 2000 ANALOG:
This is the one that’s always worried me — as it did last year [see: You’ve Got a Fan.] The 2000 top started off very much like 2007 and 2011. There was a 1.272 price extension of A-B to Point C at day 117. It was day 119 this time.
The decline from day 117 to 155 looked very much like the current 119 to 162 — nearly the same amount of time, and an identical .618 price retracement. However, when prices rebounded, they exceeded the day 117 high.
It started out looking like a Bat pattern — with a .886 completion coming around day 169. But, after two days of consolidation (the arrow below), prices shot higher – eventually completing a 1.618 extension of A-B on day 174 for a Crab Pattern. The day 117 “top” was relegated to “interim top” and the entire pattern time frame was greatly expanded.
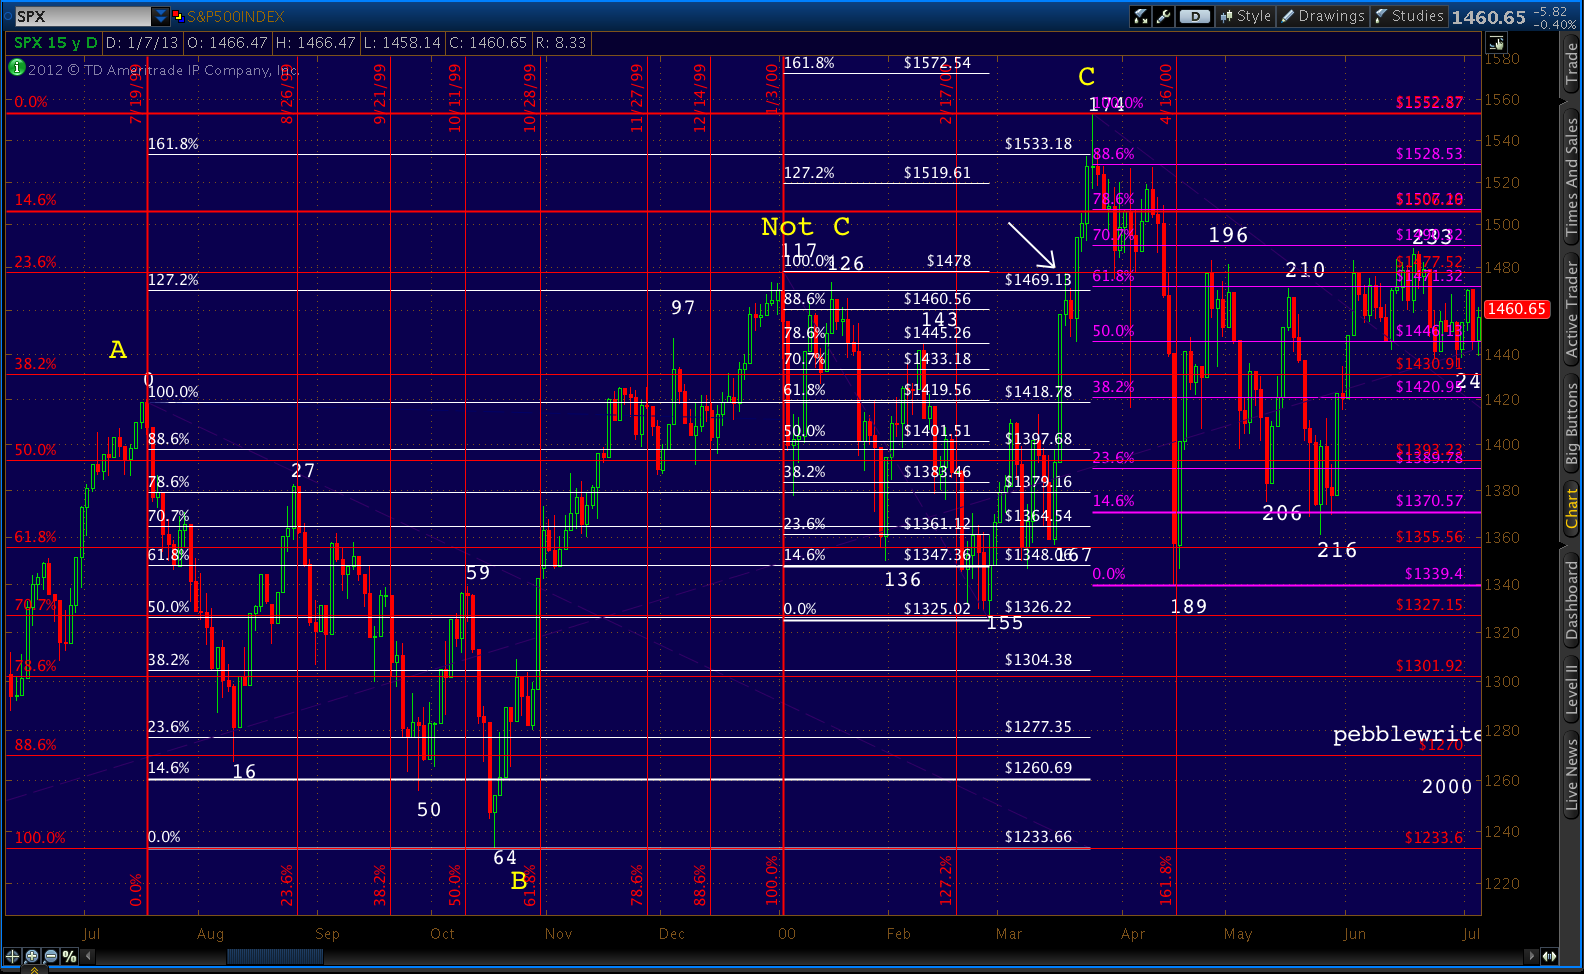
I imagine many bears were slaughtered by this move. On Friday Mar 17, SPX surpassed the .886 by 17 points but stopped short of exceeding the day 117 high. On Monday the 20th, it reversed sharply — falling 29 points from the previous session’s highs before closing off 21. The Fed has just raised rates — hardly positive for stocks.
The following morning reached even lower before going on a tear, closing 47 points off the day’s lows. This touched off a run to the 1.618 at 1533 in only 3 sessions. SPX topped the following day at 1552.87 — 106 points in 4 days.
It all came undone just as quickly. SPX was back to the 1.272 in 4 sessions, and 15 sessions and 213 points later it was almost back to the day 155 low.
If we place a time Fib 100% at day 117, then the 1.618 extension came just after the day 174 high. Here in 2012, we’ve already reached the 1.618 extension of the presumed A-C period and still haven’t seen a Point D.
One other note re timing: Point B was nearly .618 of the time from day 0 to day 117. Every other top, including 2012, featured a Point B at the .382 of A-C. In fact, a time Fib using the eventual day 174 high as 100% shows Point B at the .382 of that grid.
SUMMARY
Timing: If we assume that Point B coming at the .382 is relevant, then 1474 was the top and the current move was just an overly aggressive retrace. If day count matters more, however, then the pattern could extend on up to the 1.618 of A-B, or 1518.57 as occurred in 2000.
Price: Each iteration of the top has seen more pronounced retracements to the upside and the downside. This could be due to greater recognition and acceptance of the validity of an analog.
It could also be due to the influence of events occurring at the time. In 2011, for instance, Fukushima occurred around the time of Point B. In 2007, unsettling financial institution events were unfolding (Bear Stearns, Lehman, AIG, etc.) near Point C.
Clearly, the focus on the fiscal cliff affected price swings this past week. Like past instances of QE, the markets essentially froze for several days as they awaited resolution. We also had a couple of holidays mixed in there, further delaying the time frame.
This, coupled with the fact that the 2007 analog points to a Jan 22 Point D, supports the idea of a strong sell off in the next week or two.
Prices: Both the interim and the ultimate highs in 2000 were, when they were made, all-time highs. In other words, they weren’t retracements of anything. The interim high was a Butterfly Pattern completion at the 1.272 extension that eventually extended to the 1.618 — as often happens with Butterflies.
The 2007 high was essentially a double-top, coming in at 21 points higher than the 2000 high. The 1370 high in 2011 was a reaction to (almost) reaching the .786 of the 1576-666 crash for a well-formed Gartley Pattern. And, the 1474 high in 2012 was a reaction to reaching the .886 of the same range for a well-formed Bat Pattern.
In other words, the 2007, 2011 and 2012 tops were motivated by their relation to important previous tops — while the 2000 top was a Crab Pattern extension of the 1418 – 1233 drop. It occurred when an exceptionally frothy market (especially the tech sector) finally ran out of new buyers — plain and simple.
I don’t know exactly what pushed the market higher on Mar 21. It could be that someone leaked GE’s earnings; it might have been a reaction to a strong Asian market; or, it might simply have been a market maker manipulation to trap a few bears. It doesn’t really matter at this point – because today’s markets are just as capable (if not more) of irrational behaviour.
What matters is price. If we get a strong reversal this week or next as I expect, I’ll consider 2007 and 2011 analogs firmly in place. If we shoot higher that 1474, then we’ll take a fresh look at the 2000 analog, including the possibility of a move to 1518 and subsequent plunge to 1360.
As we’ve discussed all along, the prudent use of stops should prevent any significant losses if the alternative case plays out.
* * * * * * * *
In this entire discussion, I’ve scarcely mentioned chart patterns. I’ll provide some updated channels, etc in the next post. In my opinion, they have just as much — if not more — to say about the patterns playing out.
Comments
6 responses to “Down the Rabbit Hole: Part 2”
PW–I think the 2000 analog is going to be the closest of them all. 1520ish lines up well as the final wave of an ED from the 1430-1450 levels we are likely visiting here shortly. Thanks for your hard work!
Looks like we will have at ;east one more short squeeze for those with the previous high of 1475 as a stop.
Won’t be surprised if we see some panic buying or covering Monday.
The “current” measured move bullish targets 1465.75 /ES (just over 1470 cash) with a still bullish option to retrace back to fill the gap. Until 1450 cash is lost though, I wouldn’t worry about a gap fill happening until the bullish case is fulfilled (wherever it may be going). JMHO. Will look forward to your write up PW. Always do.
“As long as these two factors can outweigh the negative fundamental picture, the market stands a good chance of rising. Take one of them away, and the resulting crash will be swift and severe.”
Risk models, risk management, everything failed. Excelshet-calculations, whatever spread observations, etc. Nil. Whenever markets showed signs of negative heating-up, some thought it’s best to surpress rising volatility. But. Rising volatility does not disappear by whatever action.It only let itself sweep under the carpet. Or it hides somewhere behind the corner. Only to strike back in anger.
It’s natural, boom and bust, up and down. But by selling volatility futures, as some try in NY, one doesn’t dissolve. It’s as someone put on this noose, the more volatiliy travels with resolve.
i will keep quiet then. but let me add. The blame game we see on the political stage is just a fractal or analog we will see at some point when the blame game starts between politics and central banks. That’s where we are unfortunately heading for, while at present we are hoping (and i still thinking) pebble’s analog is working out.
I was stalking VIX options today…looking at the March contract. I wasn’t the only one. Volume on an option that didn’t move in price very much at all sold over 1200 contracts from a sleepy 20 will pay nicely if we can get that.
Also, the 60 min indicators are all looking very tired. Nobody really wants to buy up here without another catalyst. Not saying it won’t come–I’ve learned long ago to not use the word never–but at this point, things look tired–RSI, ADX, etc… JMHO.