

Futures are off sharply this morning, reflecting the lack of support behind the runup to the last two options expirations.
 continued for members… (more…)
Futures are off sharply this morning, reflecting the lack of support behind the runup to the last two options expirations.
continued for members… (more…)
Looking at the bounce since Jun 16, I can’t help but think of Chuck Yeager’s ill-fated journey into space.
Futures are up very slightly this morning, fixated on maintaining prices through tomorrow’s massive option expiration. VIX: an excellent example of maintaining an even strain.
 continued for members… (more…)
We’ve been used to the bad news is good news meme for such a long time, it feels weird to even type that. That’s the reality, however, when investors are already counting the days till the Fed’s easing cycle and we get 528,000 new jobs instead of the 258,000 expected.
 The tightening might just have to last a little longer than the bulls have suggested. Though, the efforts being made to lower oil prices are bound to start paying dividends in the longer run. CL reached our next downside target.
  Could this slide turn into something real? Could ES do something so drastic as drop below its 10-day moving average? Can VIX survive the usual 9:30 smackdown?
continued for members… (more…)
This morning feels a whole lot like yesterday morning, with futures ramping higher on the latest smackdown in VIX. Of course, these maneuvers can be an effort to force a breakout in stocks. But, they can also be an effort to put a little more air under stocks in advance of a downturn.  With plenty of important earnings still to be announced, the Gazprom threat, and a potential ECB rate hike just ahead, there’s plenty or risk waiting in the wings.
continued for members… (more…)
Futures are off moderately, with moves in currencies supporting our analog’s continuing bearish stance.
All eyes are on Wednesday’s CPI print, with initial claims and PPI on Thursday and retail sales and Michigan sentiment on Friday.
continued for members… (more…)
Once in a while, charts are so crystal clear that we can see the future as easily as we can reflect on the past. Gold is not one of those charts. The zigs and zags come fast and furious and rarely correlate with anything happening in the real world. Witness the indifference this so-called inflation hedge has shown toward the highest inflation in 13 years.
But, the charts have pointed out some excellent trading opportunities along the way – usually by highlighting trend changes (or continuation patterns) that offer strong directional hints.
I thought it might be interesting to reflect on the use of channels. What do they tell us, and how can we use them to guide our trading?
By the time we layer in all the trend lines, Fibonacci levels, moving averages, etc. charts can start to take on a rat’s nest look.
 But, if we strip away some of those things, the channels tell a very compelling story. GC’s long-term chart, for instance, starts with a long, pretty well-formed channel. It did a reasonably good job of guiding prices from the late 1990s until 2014.
 When it broke down in late 2014, it was a clear signal that the long-term trend had given up the ghost.
 We can see that the breakdown followed a pretty clear trend lower, marked by the red channel below.
  When GC rallied out of that falling red channel – a clear buy signal – we were able to construct a less bearish falling purple channel that guided prices for several more years. When GC reached the bottom of that channel, it accurately signaled a good buying opportunity. That signaled was reinforced when, in 2019, GC broke out of it.
  Once a few parallel highs and lows were established, we had a rising channel once again. But, GC broke out of that rising channel, requiring a more aggressive one.
 We added the rising purple channel to accommodate it…
 …and expanded the red channel to make room for the new highs.
 Although it’s a little early to say with any certainty, the rising purple channel is threatening to break down. It obviously sets up a backtest of the rising red channel’s midline (the dashed red line.) If the two of them are breached, it would be a very bearish signal – particularly in light of the drop through the 200-DMA.
Put it all together, throw in some trend lines and other chart patterns, and we get a pretty clear picture that GC is on the verge of a breakdown. The chart doesn’t necessarily tell us which way it will ultimately go, just that we’re at an important juncture – very useful information indeed. The factors have been busy overnight, seemingly in quarter-end mode to prompt a bullish run for the barn. Will it be enough?
 continued for members… (more…)
I had an great question yesterday regarding the bond market: “Is it possible the fear of pandemic in spring 2020 affected the behavior of 2yr and 10 yr and then indirectly triggered the crash?”
Pebblewriter longhaulers will recall that our bond cycle model forecast a severe plunge in interest rates long before anyone was talking about a pandemic. In August 2019, for example, we were already anticipating a drop to near or below zero around December 2020. It’s what the charts suggested, as we posted in April 2018 [see: Bonds – a Buying Opportunity]…
 …and it’s what was necessary in order to keep America’s books balanced. Annual debt growth was averaging 5%, and debt:GDP had topped 100% for the past five years.
As we pointed out in July 2019 [see: Why Interest Rates Must Not Rise] the only way to keep debt service from overwhelming other federal expenses had been to crash interest rates.
 The trick was how to force interest rates lower without alarming us economist types. Past maneuvers had involved adjusting Fed policy (not terribly effective for medium and long-term rates) and forcing inflation lower by forcing oil and gas prices lower as occurred in 2014-2016 and late 2018 (detrimental to stock prices.)
CPI, which had spent most of 2018 above 2%, had declined to a more manageable 1.7% by September 2019. But, the year-end ramp job in oil prices sent CPI up to a troubling 2.3% by December. The 10Y rose from 1.43% in September to 1.95% in December and, as the chart below shows, threatened to break out. Something, as they say, had to give.
 As the big brains at the Eccles Building were spitballing potential solutions, the most extreme case of deus ex machina imaginable landed in their laps. COVID-19 did the Fed a solid – albeit one which went way overboard.
 Oil prices, inflation and the 10Y were suddenly in a race to zero (oil won) and the Fed suddenly faced a slightly bigger problem: how to prevent Armageddon. They needed higher oil prices, interest rates and inflation just to talk equity investors (well, algos) off of window ledges.
 It worked so spectacularly well that they painted themselves back into a corner very similar to the December 2019 one: rapidly rising inflation and interest rates thanks largely to spiking oil and gas prices – exactly what our models predicted would happen. YoY gas price increases and CPI have been so highly correlated that they are now literally on top of one another.
 For the past few thousand years, this would have been a serious problem. Everybody knows interest rates spike when inflation spikes. Since the Fed essentially took over the bond market, however, they’ve been able to convince bond investors (well, algos) that spiking inflation isn’t a problem and, even if it is, it’s transitory.
Want proof? Rates have actually declined since April’s 4.2% CPI print and are nearly back to the same level as before the bomb was dropped.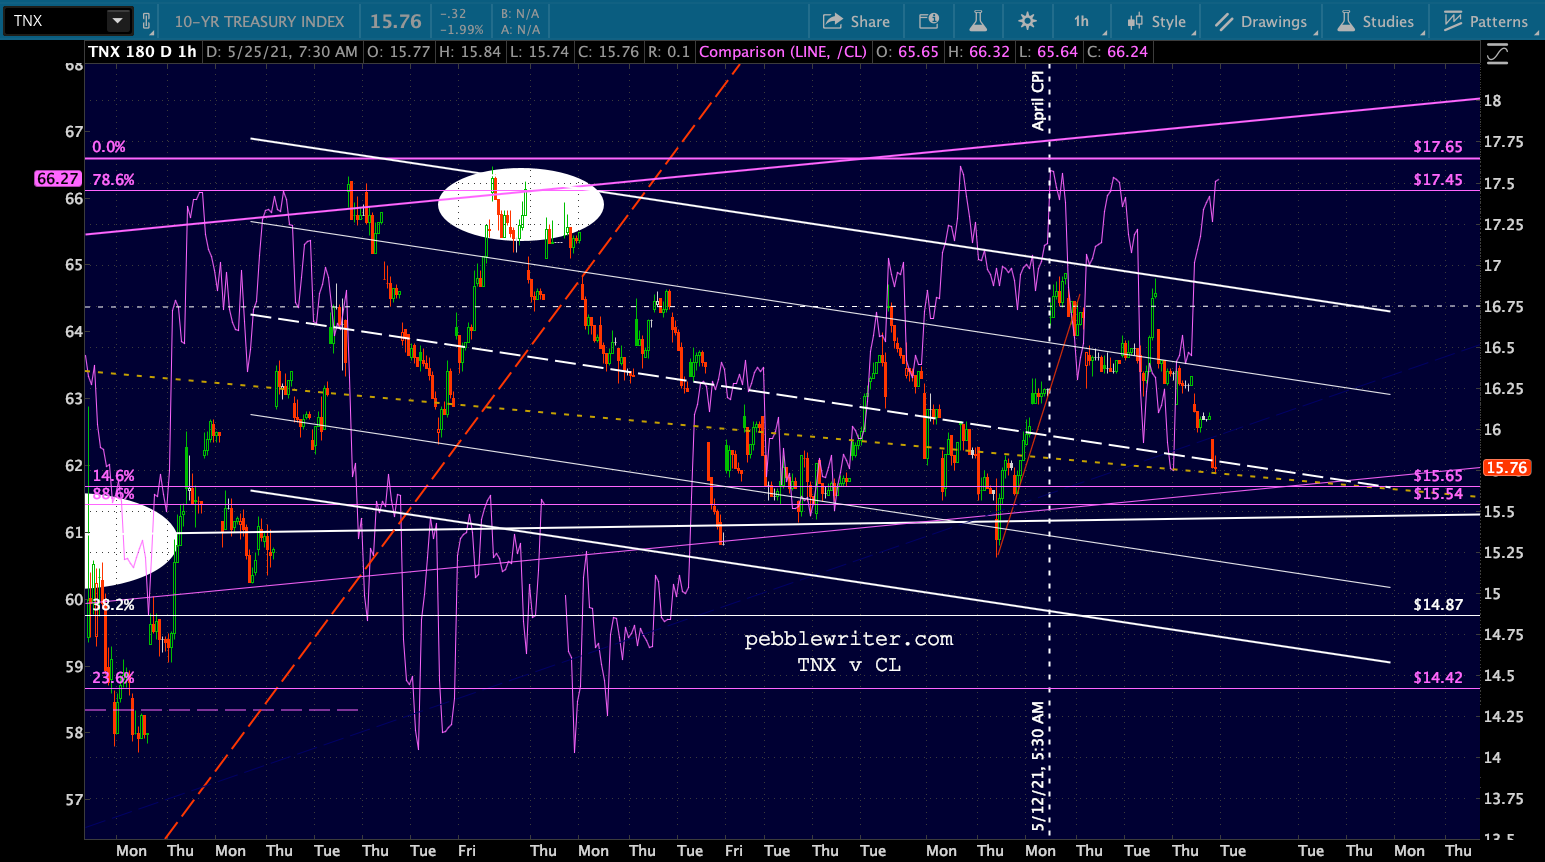 If I walked up to you on a cloudless day and insisted that shaking my rain stick will make it pour, you’d probably double over with laughter. If I had a secret accomplice spray water from a garden hose all over us from an undisclosed location, you might begin to wonder if I was right.
That’s what’s happening with interest rates right now. Except the rain stick is the Fed’s prognostications and the garden hose is actually a low-flying supertanker carrying 20,000 gallons.
Of course bond investors care about spiking inflation. But, with the Fed pumping billions of dollars into the bond market every day (more on days with alarming economic data) to force interest rates lower, they can claim that said inflation (“did we mention it’s transitory?”) is obviously not a problem. And the dopes in the financial press eat it up because, by God, they’re soaking wet.
Instead of rising, interest rates decline, proving to all (especially the algos) that the Fed must know what they’re talking about or — to us more cynical types — that they’ve completely destroyed the bond market’s price discovery mechanism.
So, did fear of the pandemic affect bond behavior and, thus, cause the crash? Absolutely – though it’s a bit of a chicken and egg situation. Everything unraveled at about the same time in the mother of all negative feedback loops.
The irony is that it accomplished what the Fed needed to happen in the bond market — though to excess. The Fed can now use the pandemic as their excuse for the most rapid expansion of monetary supply in history– even as spiraling inflation crushes the disadvantaged whom the Fed claims it’s desperate to help.
Now, on to the markets. No surprise, but futures managed to ramp higher again overnight – creating the illusion, at least, that the downside case is off the table.  It’s not.
continuing… (more…)
SPX reached our Fibonacci .886 retracement target yesterday. It’s a level I never imagined seeing after stocks reached important support back on March 23. But, then, I never imagined $5 trillion in liquidity – equal to the nation’s Q2 economic output according to the Atlanta Fed – being pumped into the economy in the second quarter.
 We’ve always known there would be a fundamental battle between another round of QE (remember when Powell insisted it wasn’t QE?) and the realities of the worst pandemic in over 100 years, spawning unemployment that would exceed the GFC and deaths in the hundreds of thousands if not millions. But, this market cares little about fundamentals. It cares about liquidity and a steady diet of the right signals being fed to the algos.
Central bankers and governments have delivered on both counts – with WTI having risen $59/barrel and VIX plunging 72% and with liquidity injections purportedly intended to bolster employment which, in many cases, went into stock buybacks.
Nevertheless, here we are. In Harmonics, the .886 Fib represents an 88.6% retracement, or rebound, of a significant drop. It’s typically as large a rebound as you’ll see unless stocks test their former highs (a potential double top) or push past them to new highs. Unfortunately, it’s not always clear cut.
In May 2015, SPX tumbled 12.5% after coming within 3.32 points of our 2138.04 target. By Nov 2, it had retraced 88.6% of those losses, at which point we looked for a pullback. Instead, it spent the next several sessions pushing above the .886, no doubt stopping out plenty of shorts before finally succumbing and making new lows – the 1.272 Fib extension at 1823.42. With the pandemic picking up steam – at least in the US and many lesser developed countries – the fundamental picture is looking iffy at best. The technical picture, on the other hand, is flashing plenty of warning signals. Can we count on it mattering?
continued for members… (more…)
Headline CPI fell 0.8% MoM – the biggest drop since 2008…

…thanks primarily to plunging energy prices.
 Core CPI fell 0.4% MoM, the biggest drop since it began being tracked in 1961.
 The details show strong upticks in food and medical care but weakness almost everywhere else.
 Like almost all economic data lately, the algos have chosen to ignore inflation, as VIX dropped another 7.7% from its overnight highs. For the moment, nothing else seems to matter much.
VIX has fallen from 47.77 to 26.37, a 45% decline, since ES backtested its 2.24 Fib extension on April 21. SPX has climbed a total of 8% during that time – with the great majority of its gains on overnight ramp jobs driven by plunges in VIX.
 Today, the algos are also watching the bond market quite closely, as the Fed is slated to dip its toe into corporate bonds – including junk bonds – for the first time.
 What could go wrong?
continued for members… (more…)
We started posting about TSLA a little over a year ago when it dipped below important horizontal support [see: Can Tesla Avoid a Crash?]
 We’ve updated the charts multiple times since then, working to stay ahead of Musk’s obvious attempts to manipulate the stock. The harmonic picture has been tricky due to the presence of two Point X’s which produces two different grids – the purple and the white.
TSLA dipped below the white .618 in March (and multiple times afterwards) bolstering the argument for the purple grid. But at times it has appeared that the white grid aligned nicely with channel lines such as this chart from last September which officially triggered a short call at 289 [see: Crypto Carnage] which was reiterated at 291 on April 3 [See: Can TSLA Survive This Crash?] and targeted 202.29.
 The Better Late Than Never Department has notified me that TSLA just crashed into 202.29, nearing the completion of this particular leg of its journey.
 Given that OPEX is in the rear view mirror and the futures are about to break below support again, we have to wonder whether TSLA is done.
 continued for members… (more…)