Tag: harmonics

  • XLF Update – June 5, 2012

    Financials play a pivotal role in the markets.  They led the way as they enabled the previous run-ups and bubbles, and they led the way down when the house of cards was revealed for what it was.  The survival of nearly all markets is hanging by a QE thread, so we’ll take a fresh look at XLF to see what the charts are saying.

    We’ll start with the weekly chart going back to inception in December 1998 — lot of water under the bridge with this ETF.

    Fortunately, for us analyst types, it’s been very amenable to chart patterns and Fibonacci analysis.  Consider this chart, that helped me call a top in banking stocks in late March [see: End of the Line and Lots More Where That Came From.]  Note the well-defined channel and the Gartley Pattern reaction at the .786 Fibonacci level.

    I’ve put together a series of charts that, I think tell a pretty compelling story regarding XLF’s future.

    continued…

    (more…)

  • SPX: The View from 30,000 Feet

    Our charts have grown fairly “busy” lately, what with harmonic patterns, chart patterns, fan lines, channels, etc.  I find it helpful every now and then to take a step back and examine those elements that have had the biggest impact in recent years — and are likely to continue doing so.

    In my opinion, the two patterns that have influenced prices more than any other are Fibonacci levels (primarily related to the 1576-666 decline) and fan lines.

    Note how strongly prices reacted to each of the Fib lines off the Mar 09 lows.  Every Fib level played an important role in providing support and/or resistance at pivotal points.  The .236 didn’t slow the advance much, but it provided much needed support after a 9% decline.  A tag of the .618 touched off a 17% correction (caught by the .382) and set the stage for the Gartley pattern completion at the .786 a year later.

    (more…)

  • A Most Lenticular Market

    Looking at the markets these past few days, I’m reminded of the prize that comes in a box of Cracker Jacks.  Not a real prize, mind you — but one of those cheap little pictures where the image changes as you shift the angle from which you’re viewing it.  It’s called a lenticular image.

    Despite the uncanny accuracy of our forecasts these past couple of months, the road ahead seems to shift a little with every fresh look.  I can’t remember the last time I agonized over a forecast for an entire three-day weekend.

    (more…)

  • The Road Ahead

    I’ve taken advantage of a relatively quiet morning in the markets to finish mapping the road ahead.  There are quite a few harmonic patterns in play right now.  My practice is to map all the apparent possibilities and look for confirmation (or lack thereof)  between patterns — and then look for ways in which they agree or not with all the chart patterns, channels and analogs I’m watching.

    It’s fairly exhaustive, so takes a fair amount of time.  I hope to post the results in the next hour or two.   In the meantime, the short-term forecast is still for increasing prices.  This morning’s chop does nothing to change that, but does illustrate the importance of using stops.

    Like yesterday, l will occasionally post short-term trading opportunities.  For traders so inclined, the idea of shorting at 1328 and buying back at 1298 is a great trade.  But, it requires a certain degree of vigilance.  For the buy and hold crowd who aren’t interested in 30 point blips, feel free to ignore such forecasts.

    Whichever camp you fall into, please remember to use stops at all times.  These are very precarious times, where unforeseeable events capable of moving markets are unfolding daily.  Please don’t get caught with a significant portion of your net worth hinging on any particular forecast — mine or anyone else’s — without protection.

    For those of you who who haven’t yet signed up, prices are going up at midnight tonight (PST.)   Current members are not affected, of course.  And, as before, the first 100 annual members are grandfathered for the life of the site.  If you’re a quarterly or semi-annual member, you might want to consider upgrading to annual.  To sign up, click here.

    Stay tuned.


    Update:  2:30 PM

    The 5-min RSI just broke out from a falling wedge on positive divergence.  If it can stay above the upper bound this morning’s decline should be erased, and then some.  Watch for a back test of the wedge, which would correspond with a back test of the little red trend line at around 1311.

    Still working on the longer term picture.  I’ll send a message as soon as it’s posted.  At this point, all members should be receiving an email within minutes of when a significant post or update is posted.  Please let me know if you’re not receiving these messages.

    I’ve put the texting option back in the sidebar to the right.  Just enter your cell phone and service provider and you’ll be notified of new posts.  Note:  it doesn’t notify you of post updates, just the initial publishing of a new post.

    UPDATE:  4:05

    That worked out pretty well.  The falling wedge paid off as advertised, turning an 8-pt decline into a 2-pt gain at 1310.50 — just a smidge below our 1311 target.  I hope readers were able to take advantage of it.

    Since I didn’t complete the longer-term picture before the close, I’ll work late this evening and try to get it up before turning in.

    BTW, I get a number of emails during the day from readers, and I’m good with that.  But, I much prefer that anything market related — questions about strategy, investment options, etc. — go into “comments” on the post.  I’m likely to see them more quickly, and more importantly, your fellow readers might benefit from the discussion.  Thanks!

  • Say What!?

    I wasn’t sure what to write about today until I got a great question from a reader, who hopefully won’t mind my reposting it here:

    Pebble, I enjoy your analysis, but are you really saying you bought at the low on Friday and you sold at the exact high yesterday?

    “After scalping a quick 36 points (going long Friday at 1292, selling at yesterday’s high of 1328.49) I got a little cocky and went long again at yesterday’s low of 1310 — even though it didn’t quite reach my 1309 target.  I got stopped out on the opening and am looking for a good re-entry point — probably just above 1300 from the looks of the 15-min chart.”

    DeMark 15 min is saying we will have a bottom shortly in the SPX.

    Lately I’ve been very, very fortunate in my forecasts and trading.  As readers know, I’ve been calling for a decline to 1288-1323 since April 9 [see: New Analog I’m Watching].  On May 6 [see: So Far, So Good], I refined it to 1295 and wrote:

    Remember, our target is 1288-1323, although 1288 has been fudged to 1295 simply because a dip below 1292 would be problematic for the bulls from a wave count perspective;  i.e., I think they’ll pull out all the stops to avoid it.

    In between, the market hit my upside target of 1415 on the nose, and just about every interim target on the way down.  We arrived at 1295 only two days later than my forecast from six weeks earlier (the purple line below.) So, trust me when I say I was fairly confident going into last Friday’s session.

    We were completing a Butterfly pattern at 1289.14, a Crab pattern at 1288.69 and were approaching a Head & Shoulders target of 1289.  And, a number of other indicators I watch were all screaming “here comes a bottom.”  I really, really expected a bounce.

    I had orders ready to go when we hit 1295. I drew a little trend line coming down the face of the RSI on the 5-min chart (purple dotted line, arrow A on chart below) and waited for it to be broken.  When it did, I started selling short positions (at around 1295.)  When RSI back-tested and showed positive divergence, SPX was around 1292; so I took a deep breath and started loading up longs (albeit with fairly tight stops, in case I was massively wrong!)

    Was I nervous?  Enormously.  In my nervousness, I devoted practically an entire post [see: Message in a Bottle] to the fact that I’d written myself a note in an April 12 post [see: Analog Details] to bolster my confidence in what I knew would be a very nervous moment a month later.  But, yes, after catching the very top, I caught the very bottom.

    As to 1328, that was much easier. As I wrote yesterday morning [see: On Track] my 1330 target was based on the previous H&S neckline.  But, I was also watching the Fib levels (red Fib lines above) and RSI activity — which was flashing overbought from the word go.

    The rise started slowing as we approached the .500 at 1328.82.  I felt we would probably build a Bat or Crab pattern to the upside, so a turn anywhere between .382 – .618 made sense.  Here we were, slowing at the .5000.  Hmmm…

    I went to the shorter term charts (5-60 minutes) to see what they were doing and noticed a trend line was in danger of being broken on the 5-minute RSI (note the red dotted line that runs roughly from A to B.)

    Within the next 15 minutes or so, that trend line was broken, and back-tested (the yellow arrow.)  That was all I needed to confirm a good entry point; so, I went short — with stops a little over 1330 just in case.

    And, it worked out pretty well — except that I got cocky and traded at the end of the day yesterday when SPX very nearly hit my 1309 target (it was my birthday, I was loopy on pineapple upside-down cake.)  Had I looked at the 5-min chart again, I would have waited.

    So, I got stopped out this morning at around 1305 and sat out until 1296-1298 (discussed at 10:40AM, occurred at 12:25PM) which so far is looking like the right move.  Note the back test of the channel — setting up more positive divergence.  I have stops in just below 1292 just in case, and still believe we’re in for lots of chop.

    With respect to DeMark, I know a lot of folks who follow him, and it seems we’re often of the same opinion.  But, I’ve never studied his methodology and don’t really keep track of his forecasts.  I do take some comfort — especially when taking a contrarian view — when smart people express concurring opinions.

    I sat watching my daughter play volleyball all weekend and ran into another dad who’s very smart and also in the investment management biz.  He asked how I’d done in the markets lately, and I started to tell him about catching the rise to 1422, the decline to 1357, the rise to 1415, and the decline to 1292.

    As I went on, I could see the word “bull****” forming on his lips.  I stopped talking and went back to watching volleyball.

    Good luck to all.


  • Bet Your Bottom Dollar: Part Deux

    UPDATE:  10:30 AM

    Last night’s call on the dollar was timely.  Check out the candle on the daily chart — the completion of both a Bat and Butterfly pattern.

    EURUSD also seems to have put in a bottom, though as mentioned earlier it’s going to take ein Akt des Bundestages (literally) to save the euro now.

    ORIGINAL POST:  2:00 AM

    Back on April 30, I held my nose and plunged head-long into the dollar, also shorting the euro.  I’m pretty sure I invoked that age-old expression of confidence: “here goes nothing.” Hopefully, lots of pebblewriter members went along for the ride.

    In that night’s post [see: Bet Your Bottom Dollar] I put up the following chart:

    I immediately regretted sketching out the forecast in such detail; and, in fact, I caught a lot of guff from a few readers for so recklessly calling the bottom (you know who you are, wretched givers of guff!)

    I didn’t look at the chart for a few days, but knew things were going my way.  I just didn’t realize how well things were going my way…  Here’s the same exact chart two weeks later.

    It deserves a close up…if only to show how spooky a forecast it turned out to be.

    Throwing caution to the wind, I also posted the EURUSD chart below and wrote:

    Meanwhile, the EURUSD shows signs of finally breaking down.  Both the pair and the RSI action show a rising wedge that’s bumping up against a well-established channel.

    Note Point D — the completion of a Bat pattern — sitting down there all by its lonesome.

    It now looks like this:

    Yikes!  Harmonics don’t always work as well as they have this past month.  But, when they do, man is it fun!

    ************

    As far as the road ahead, EURUSD crossed a incredibly important fan line today.  It’s either fallen off a cliff, or it’s doing that roadrunner-running-in-mid-air thing.  On the other hand, it has completed a Bat pattern (as has DX) that should mean a reversal. The next 24 hours are critical.

    If I had to guess, the RSI leads me to believe we’re going to see a big bounce.  But, I’m taking my profits and sitting this one out.  If it plunges below the fan line, there’s plenty more downside where that came from.

    If it doesn’t, it’ll be because Merkel and Hollande are caught on video, breathlessly moaning “long live the troika” while mending post-election relations.

    Seriously, though, a stick save would almost certainly entail a commitment to all things Greek, Portugese, Spanish, Italian, etc. and more LTRO — lots and lots more LTRO.

    Stay tuned.

     *************

    For the last several weeks I’ve been double-posting pebblewriter.com stuff on the original blog and holding this open for former followers.  This website has been up for nearly a month now, and it’s time to start winding the other one down. [why?]
    If this blog is helpful to you, jump on the introductory prices while they last.  I’ve extended the 10% off discount for all new members through this Friday, the 18th.


  • To Scalp or to Swing?

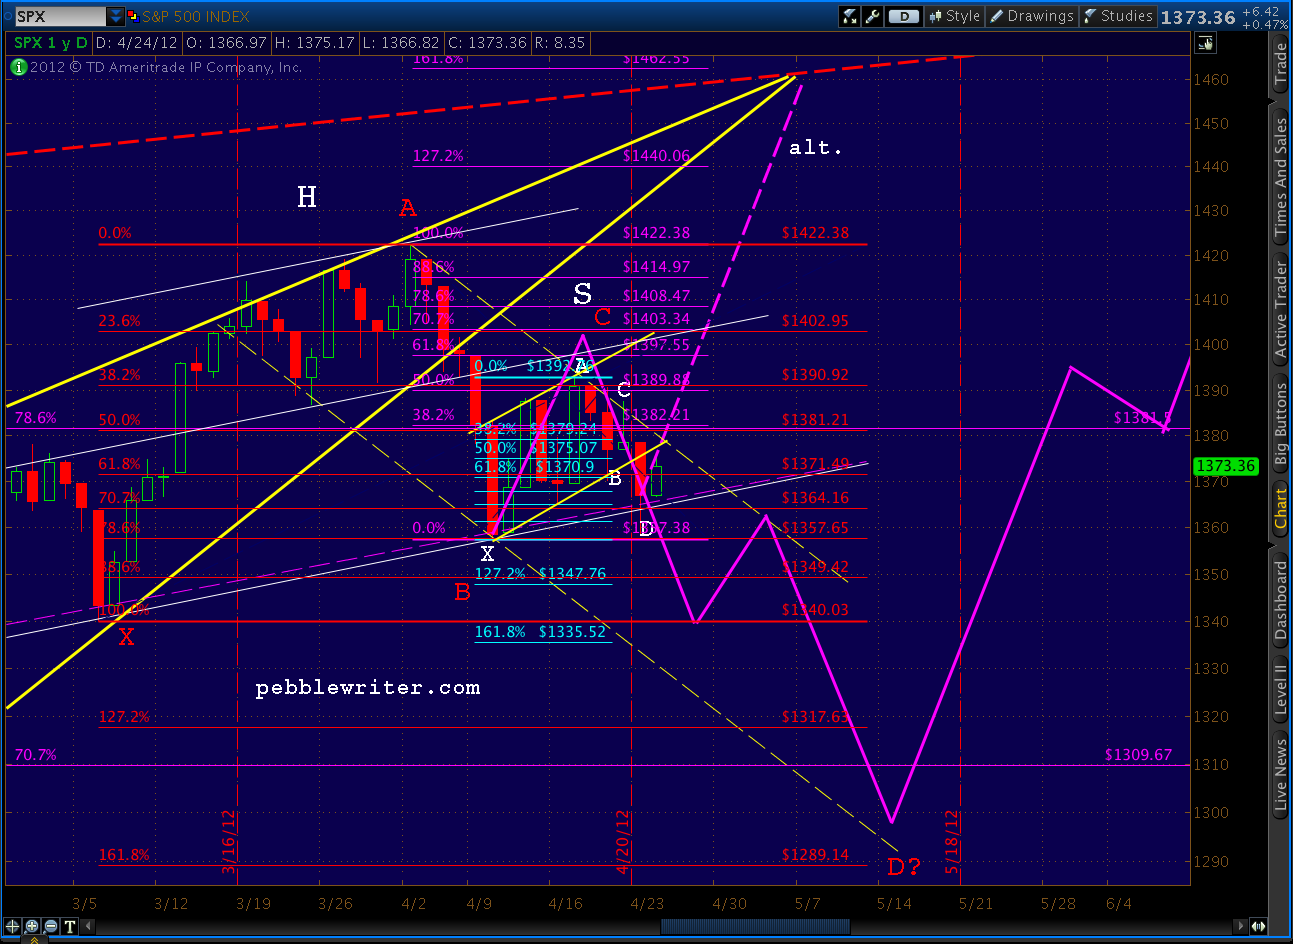
    Yesterday’s Bat pattern reversal we expected has confirmed this morning.  SPX, currently down 7.42, was off as much as 11.90 just after the opening.

    Bat patterns complete following a .886 Fibonacci retracement of a significant move — in this case, the 1422 to 1357 drop from April 2 to April 10.  88.6% of that drop was 1414.97, and we exceeded it just slightly before the market reversed course (at 1415.32.)

    Cash short positions established at 1415 were up almost 1% this morning.  At-the-money puts bought when SPX hit 1415 were up at least 100%.    If you bought a few, congratulations!  Your pebblewriter membership just paid for itself.

    The tricky thing with harmonic patterns is how much of a reversal to expect.  Some harmonics traders, therefore, practice scalping — establishing a position just before the expected reversal (with appropriate stops) and taking a profit shortly after.  This can be very profitable and, if done properly, entails little risk.

    The other method is to use these reversals to establish longer-term swing or momentum trade positions.  This method works well if there is a reason to believe the position has more room to run; i.e., other chart patterns or technical analysis hint at a continuation of the new trend.

    If you’ll indulge me, I’ll walk us through my thought process.  It doesn’t always work, but it provides a useful framework for the scalp/swing decision.

    In this case, the dominant chart pattern is the H&S pattern that completed but didn’t play out back on April 23.  We would expect a busted H&S pattern to go up and take out the head — 1422.  But, this pattern has continued to loiter, and now reverse, at the shoulder line already established.

    For that reason, it’s quite possible we’re establishing a complex H&S pattern, which simply means there are more than one shoulder on each side.  There are two shoulders on the left, although they’re not perfectly formed.  But, good enough?  Probably.

    We can’t put a number on it, but I did observe the other day that the pattern would be balanced time-wise by today.  While not an absolute requirement, balanced right and left shoulders contribute to a more reliable pattern IMO.  In other words, if the pattern is going to play out, it had better get on with it.  A substantial delay increases the odds that the alternate path to 1462 plays out — without a trip to the low 1300s.

    The other chart pattern I’ve written about a lot these past few days is the RSI channel.  Along with the Bat pattern, it correctly forecast yesterday’s turn as a back test of the major trend line (yellow, dashed) running through the middle of the chart.  Note that it can be viewed as a system of fan lines originating from August 8 when SPX had nearly completed its initial 246-point plunge [see: Analog.]  We’ll label this point “a.”

    Point “a” was just a point until the Oct 4 1074 bounce.  With the addition of a “b”, we had a trend line/fan line.  The bounce at “c” more or less confirmed it.  Shortly after, we broke the fan line and fell to “d.”

    Line a-d now becomes a new fan line, though SPX would go back up and back test line a-b starting at point “e” and continuing for months — until point “g” in February.  Along, the way, a new line was established at “f” — which correlated with the 20-point Dec 19 plunge.

    Point “f” established both a new channel (line d-j) and would also serve as the origination point for new fan line f-g that, together with a-g, would form a rising wedge within RSI.  The break and back test (at the apex) of that rising wedge would mark the topping out of RSI, and thus the beginning of the serious divergence that would begin to drag on the bull run.

    Note that the 1422 high didn’t occur when RSI peaked at “g” or even later at “j.”  It came at “1” — 4 little peaks later.  Of course, “j” wasn’t just another little peak.  It was a back test of the channel created by d-j and followed a major dip to “i” that correlated with a 23-point drop on Mar 6 — further defining the SPX rising wedge.

    Point “i” also helped establish the downward-sloping channel (red, dashed) on which I’ve been so focused lately.  The dashed fan line from “i” to “1” (the SPX high) provided a clue as to the drop to come — since “1” was established during a back test of that line.  When fan line i-2 was broken, it was followed by a 65-point drop in SPX.  And, the corresponding “k” in RSI helped validate the current channel.

    Note that i-3 is a third fan line and is simply a segment of the major a-i fan line.  Its back test is what we’re trying to complete right now.  Will it be a short, sweet back test like point “j”, or a long, drawn-out affair like the period from “e” to “g”?

    All channels work forever…until they don’t.  So, there’s no guarantee that this one will contain SPX’s moves going forward.  The key points I’ll be watching are the fan line k-4, which was established by the Apr 23 neckline tag (and H&S completion.)  A break of this fan line would really help the bearish case — while a RSI move up through “3” would be bullish, establishing k-4 as the lower bound of a new upward sloping channel.  In fact, a break up and out of the channel at any point would be bullish.

    If we do break beneath k-4, the next major fan line is a-k.  Both prior major fan lines got two bounces before they gave way — a common occurrence, so it’s entirely possible this one will, too — especially if it’s still within the channel.

    So, which is it?  Will the new channel hold, or will the alternate case play out?   The bulls have their work cut out for them, as an upward move to the apex means not only breaking out of the channel, but through the solid, purple trend line that dates back to November of 2010.  This same TL (or its lower parallel) figured into the reversals on Feb 18, May 2, July 7 and Oct 27 in 2011 — some pretty good company.

    The break above it from Jan 9 to April 4 2012 ushered in the 1280 to 1422 melt up.  We broke below it on April 4 — the SPX high — and have back tested it twice in the past week (the highlighted area.)  All things being equal, I suspect it would be much easier to break out of the red, dashed channel than above this TL.

    If I haven’t put you to sleep yet…

    Therein lies the reason I’m still clinging to the analog as my top scenario and the alternate case as just an alternate.  I think the bullish case is stretched very thin, meaning SPX needs to pull back and gather momentum if it’s going to take a run at 1462-1472.

    At these levels, it would have to bull its way through that purple TL in an already extended state.   The much easier way of achieving a higher high would be to go down and bounce off line a-k — corresponding to the low 1300s in SPX — and zip back up to the purple trend line.

    A new high on SPX at the century mid-line around 1462-1472, combined with a lower high on RSI would establish another significant divergence that just might unravel the bull run in a much bigger way.  More on that later.

    Conclusion:

    We started off with the question of whether to scalp or swing.  It’s largely a matter of wits and nerves.   The market is consolidating now, trapped in the channel created by the shoulder line and neck line of a H&S pattern — which is the perfect environment for day trading and/or scalping.

    But, one of these days, it’ll break out.  If it’s to the upside, that’s 60-70 points of swing trading that could be very profitable.  If the downside, I expect a swift 80-100 points.  When it does, swing traders will be very happy campers.  Scalpers will be kicking themselves for settling for a lousy 100% return.

    Either way, these are the charts we’ll be watching.  It should be exciting!

    ********************

    BTW, there are still about 12 hours left until the introductory pricing on pebblewriter.com runs its course.  Current Followers get $100 off the price of an annual membership.  And the first 100 annual members, regardless of whether they’re a Follower or not, will have their current annual subscription price grandfathered for the life of the site.

    For full details, click here.

    ********************

    P.S.  I promise not every post will be this dense.  Some of you want to know what time it is, not how a watch works.  But, there are plenty of guys out there who, for a small fee, will tell you whether the market’s going up or down.   My goal is to teach you why and, together, to discover new ways to make sense of it all.

    Good luck to all.


  • Analog Update: April 24, 2012

    The analog we’ve been watching since April 9 is playing out nicely so far.  We got the original bounce at 1357 as forecast, followed by a rise to the middle of our 1380-1400 target range.  The H&S pattern we expected did, in fact, set up and complete yesterday.

    Now, we’re back testing the little channel (solid yellow) formed by the right shoulder.  It was broken during yesterday’s plunge.

    As we discussed yesterday, if the wheels fall off the analog, it’s going to happen here — at the H&S neckline.  A hard bounce would likely send SPX up to tag the initial rising wedge apex at 1462-1472 (the purple dashed line.)  It can be viewed as a Crab pattern with the 1.618 at 1462 (in purple, points not marked.)

    But, I think we’re more likely to see the analog continue to work.  The key will be a failure of this morning’s rally/back test and a close below 1363.  Note that we’ve also established a channel to the downside (red, dashed) that coincides nicely with the harmonic picture.

    The pale blue Bat/Crab indicates a potential to 1335-1340, which would be a nice spot for a back test of the H&S pattern itself.  From there, the larger red Butterfly pattern takes over, with potential to 1317 (the 1.272) or 1289 (the 1.618.)  Though, a drop below last October’s 1292 would be a challenge.

    The key levels I’m monitoring today are 1378 — at which point the back test starts to intrude into the previous channel, and 1382 — at which point the larger red, dashed channel is jeopardized.

    Good luck to all.

  • Charts I’m Watching: March 22, 2012

    ORIGINAL POST: We’re finally seeing reactions on the harmonic pattern completions we’ve been watching for what seems like forever [see: Everything’s Coming Up Crabs.]RUT completed a Crab Pattern (in red) within the last leg of a Bat Pattern (purple) off the 2011 highs.  It never has cleared the TL off the May and July highs.  The May 2011 high was a double-top to 2007’s.

    COMP completed a tiny Crab within a little Butterfly pattern and tagged a key trend line off the 2007 highs.

    I call it a trend line because it’s exactly parallel to the line connecting the 2002 and 2009 lows.  A reversal here would make for four touches — i.e. a channel.  But, COMP could continue bucking its bearish divergence and go up to complete the larger Butterfly pattern (purple) at 3250-3295.

    DJIA still hasn’t made a new high since completing a Crab Pattern a stone’s throw away from a Butterfly Pattern (purple) completion at 13,338.64.  We’re still watching for a clean break of the rising wedge in the price chart and the trend line in the RSI chart.


    Though, it’s important to note that, at these prices, we came within 28 points of completing a Bat pattern (yellow) at the .886 (13,317) in the weekly chart.  That would make for a logical back test if/when the rising wedge finally breaks.  It might also be the 5th and final wave target if today’s move stays within the wedge itself — which is just as likely.

    Coming up….SPX.