Tag: EURUSD

  • Powell: Let’s Get This Party Started

    Jerome Powell gave a good news/bad news speech to the Economic Club of New York. He noted that employment is still 10 million below February 2020 levels and that a broader range of unemployment would put the current rate at 10%, adding, “We are still very far from a strong labor market whose benefits are broadly shared.”

    As the algos were spinning up their sell orders, he delivered the good news upon which the market relies: “Achieving and sustaining maximum employment will require more than supportive monetary policy.” He added that it could take “many years” to overcome the effects of long-term unemployment and scoffed at the idea of problematic inflation.

    From my vantage point, he’s right and he’s wrong. The strong earnings and cheerleading from pandemic lockdown beneficiaries have drowned out the wails from the pandemic’s have-nots: those who find that even a $1,400 stimulus check won’t pay the rent, the millions of small businesses and self-employed who couldn’t qualify for PPP loans, the millions for whom unemployment  benefits are unobtainable or inadequate.

    But, make no mistake about inflation. Yesterday’s CPI data reiterates our long-held conviction that, although official core inflation is mild, actual inflation is much higher.  Even the understated official CPI will soon soar to levels not seen since before the pandemic (when 10Y yields topped 2%) unless the manufactured rebound in oil and gas prices unwinds posthaste.

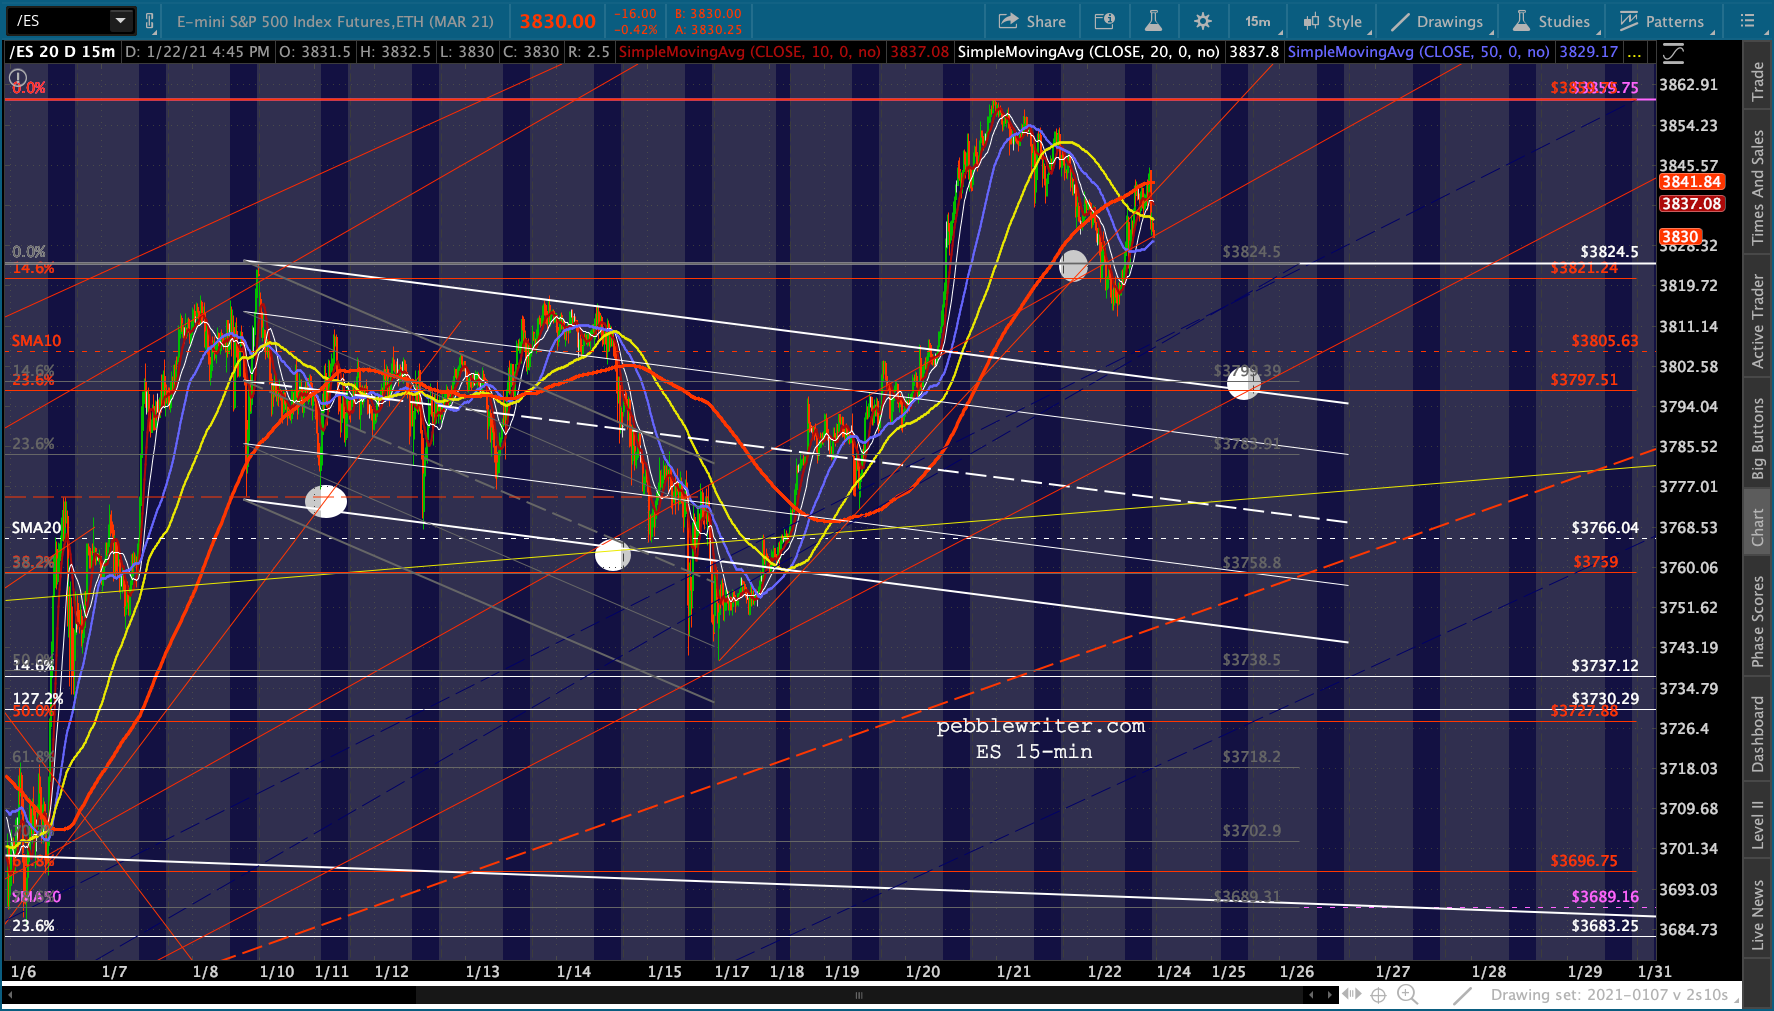
    The morning after, futures have regained most of their losses and are again knocking on the door of the 1.272 Fibonacci extension……thanks primarily to yet another VIX “breakdown” from its rising channel which, as we discussed yesterday, has produced another bearish (bullish for stocks) 10/20 SMA cross.Will it be enough to offset the cold water with which Powell just drenched the reinflation trade?

    continued for members(more…)

  • Charts I’m Watching: Feb 9, 2021

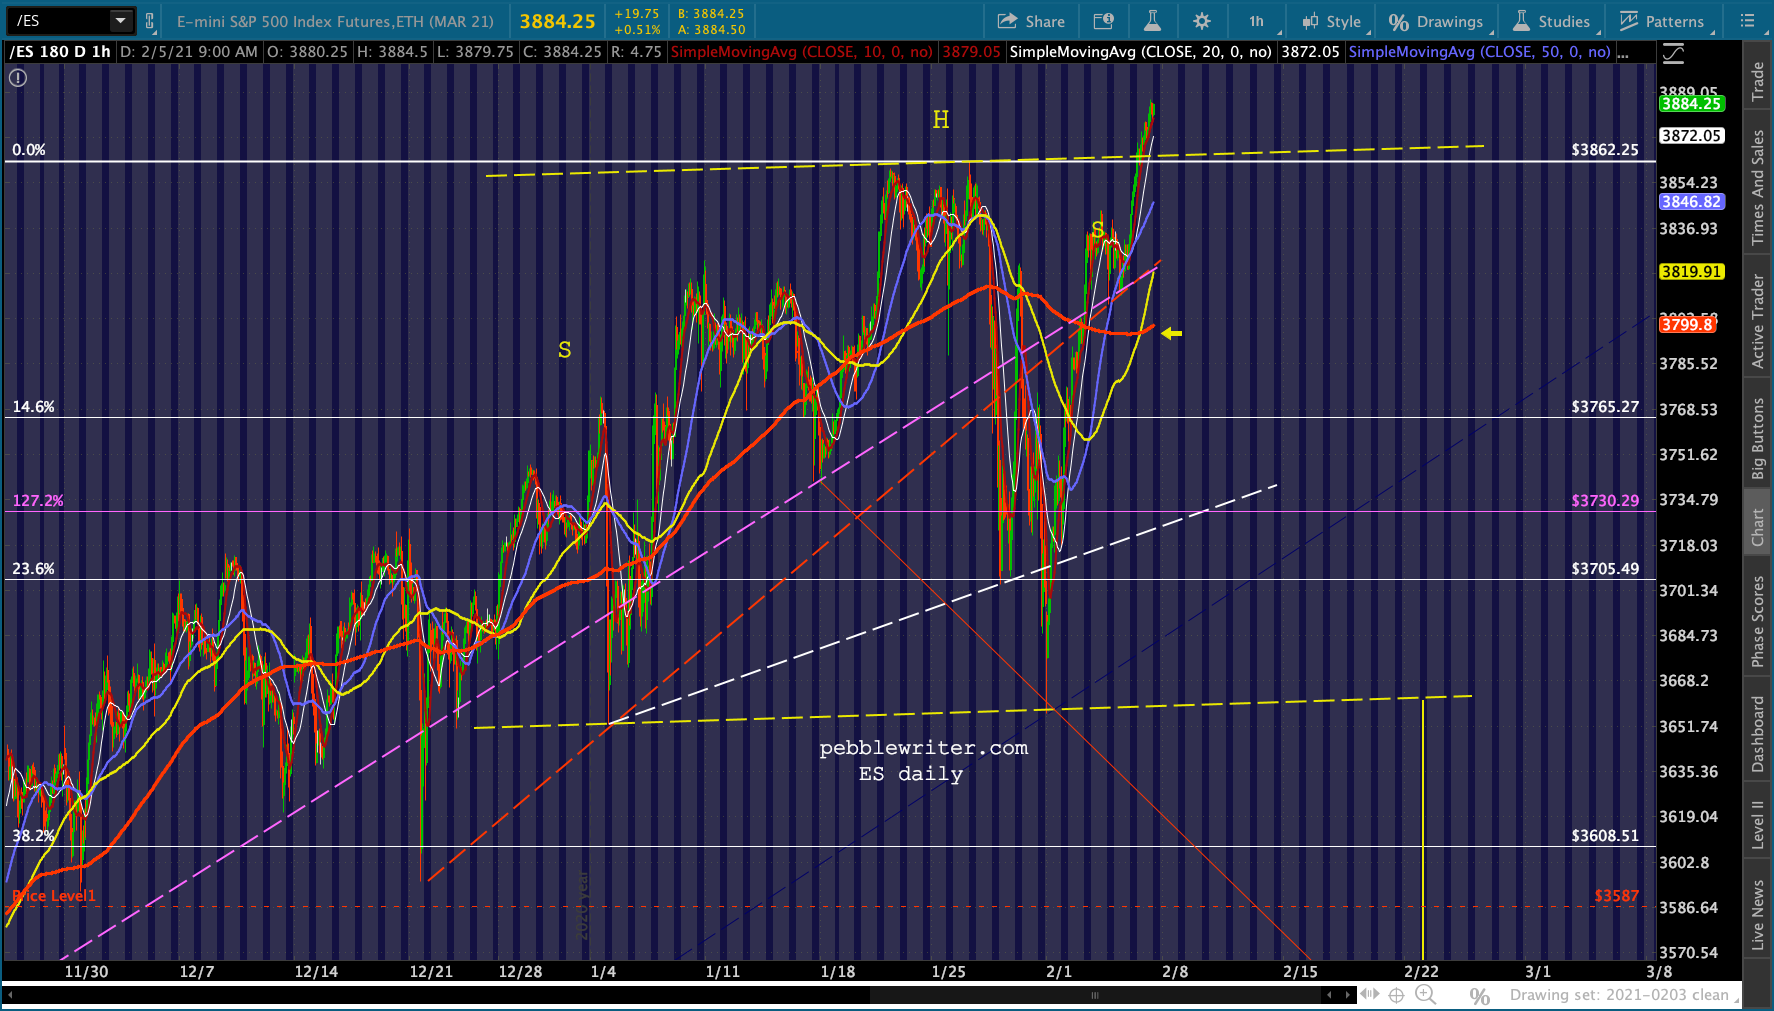
    Futures are off modestly as the algos have backed off their assorted breakouts and breakdowns now that the bearish H&S Pattern has been busted.continued for members(more…)

  • BTC: Musk’s Plus One

    See if you can spot the point at which TSLA disclosed its purchase of $1.5 billion in BTC.

    Yes, in a world where seemingly everything is making new highs, BTC joins the party – courtesy of Elon Musk.

    continued for members(more…)

  • Mission Accomplished

    In another obvious show of how easily this market can be manipulated, ES’ final bearish Head & Shoulders Pattern was busted in the final five minutes of trading yesterday. This morning, SPX’s H&S Pattern will also be busted with a burst higher in the wake of another disappointing jobs report.

    And all it took was for the “Bad News is Good News” algo to pin futures to their ramp job highs until 9:31. The BN=GN algo, of course, has nothing to do with additional stimulus.

    We already know $1.9 trillion is on the way to some who desperately need it and countless more who don’t. It also has nothing to do with additional QE. That’s an ongoing $120 billion per month, rain or shine.

    No, it is about the usual tricks employed by central banks and their proxies: shorting VIX… …shorting bond futures……ramping WTI futures……and shorting the yen. They have all been employed over the past week just to make sure that any lingering bearish patterns were undeniably busted. Just another day in the “markets.”

    continued for members(more…)

  • VIX: Just a Flesh Wound?

    In Friday’s post VIX: Back From the Dead we noted that VIX had recovered from the breakdown below trend dating back to Nov 27. This morning, it’s testing overhead resistance from Jan 4 and, if it’s able to break through, will likely take on resistance from Dec 21 or even Oct 29. Bears might want to hold off on the champagne just a bit longer, though. One of VIX’s favorite tricks is to race up to resistance in the pre-market so it has someplace to reverse lower from.

    The FOMC will issue its latest pearls of wisdom on Wednesday. And, as ES’s chart aptly illustrates, they are loathe to allow a significant decline in the lead-up to these exercises in obfuscation.

    Here’s the chart we posted Friday evening. continued for members(more…)

  • Moment of Truth for Bonds

    ZN broke down from its rising red channel back on the 6th. Since then, it has found support in a falling channel – from which it is now threatening to break down.This is a moment of truth for bonds and the many correlated assets such as GC, shown above.  Stocks might not be amused.

    continued for members(more…)

  • This Is Getting Old

    Lots of calls and emails yesterday from folks wondering how the hell the market could be up so strongly in the face of the violent unrest in D.C.

    When the capitol was breached, shortly after 2pm, the S&P 500 was already up 55 points on the day.  This came on the heels of a sharp 22-point plunge on the open.  Altogether, the S&P 500 rallied 78 points from the daily lows before finally topping out.

    We know why this happened. As is so often the case, the algos were directed to erase any signs of dissatisfaction with the events of the day: an abysmal ADP employment reading, FOMC minutes, a brewing constitutional crisis, etc.

    Note the slight breakdown of the futures around the time ADP employment (-123K vs prior month +304K and +120K consensus) was released at 8:15.  Now, see if you can tell when Fed minutes, which the Fed obviously knew reflected a less than rosy assessment of the economy, were released.

    I’ve marked it in case it’s not obvious.  Note that it didn’t stop until ES had made a new all-time high (by 1.5 points at 2:15.)Now, here’s what happened to VIX as the market opened and the day progressed.  The breakdown of a falling red channel and the 10-day moving average are pretty common and effective algo signals. I’ve marked the release of the Fed minutes with a yellow arrow. As fate would have it

    Sure, there’s too much liquidity in the markets thanks to central banks’ obvious agenda to prop up stocks. But, the cash on the sidelines we always hear so much about didn’t suddenly materialize yesterday at 9:30.

    Let’s be honest about what’s really moving markets like this: the systematic and deliberate crushing of volatility which, in turn, signals the machines to buy anything that isn’t nailed down. It happens over and over – and especially when the market’s protectors fear a potential downturn.

    As I wrote yesterday…

    Either this is the start of a chart-busting rally, or things are about to get very ugly right as ES’ 50-day SMA has reached its Dec 21 lows.


    continued for members(more…)

  • Update on Bitcoin: Jan 4, 2021

    BTC reached our next upside target at 29,890-30,108 [see: Dec 22 Update on BTC.]  Had it remained in either the rising pink or purple channel, it might have taken quite some time. But, as we discussed last month, it broke out of both channels and topped the Fib target at almost exactly the time forecast by our cycle model.

    continued for members(more…)

  • Collateral Damage

    Maybe Warren Buffett can get through to Congress. In a CNBC interview aired this morning:

    “It’s so important that small businesses, which have become collateral damage in a war that our country needed to fight, but we, in effect, voluntarily had an induced shut down of parts of the economy, and it hit many types of small businesses very, very hard… We made some provision for that in March in terms of the CARES Act, but then nobody really knew how long this self-inflicted recession would last with this particular effect on small businesses, so we need another injection to complete the job.”

    Congress, the Treasury and the Fed have done a terrific job of “saving” corporations that already had access to plenty of cheap capital and whose stock prices could then vouch for the strong recovery from the pandemic.  The rest of the economy?  Not so much.

    For all the independent restaurants, mom and pop stores, non-big box retailers, things are dismal. And, to all the unemployed folks barely hanging on to their house or their apartment, it will get much worse if Congress doesn’t act in the next few days to prevent them from being evicted during the depths of winter in the midst of a pandemic.

    Naturally, futures are up 25 points.According to VIX, it probably won’t last.

    continued for members(more…)

  • The Yield Curve Model: Dec 8, 2020

    One of my favorite market indicators is our yield curve model. It has warned us several times in advance of significant correctionsthis year.

    Warnings over the past few years have included:

    July 16, 2018: The Yield Curve Update – We were a little early. SPX closed at 2798 that day, rose to 2940 before crashing 20% by Dec 26.  The final 13% was signaled on Dec 5: The Yield Curve’s Warning.]

    April 25, 2019: The Yield Curve Model Warns Again – SPX gained 21 points over the next four sessions before quickly shedding 226 points.

    February 20, 2020: Buckle Up – SPX (which had topped out the day before) crashed by over 35% over the next month.

    August 25, 2020: Update on AAPL – We were about a week early, but the model signaled a correction which saw SPX fall 11%, followed by another 9% the next month.

    The recent breakout of the 2s10s is clearly a bearish signal – though it hasn’t yet paid off.  Is the model still working?  First, a little history. Among other things, the model holds that breakouts above significant resistance are bearish for equities.

    If we plot the 2Y and 10Y together, we can see that significant sell-offs in stocks were marked by more rapid declines in 2Y yields than in 10Y yields (i.e., a widening of the spread between the two.)

    The shaded areas below illustrate the period during which stocks experienced their most significant corrections between 2000-2013. Though the 2Y and 10Y both declined during these periods, the 2Y yields clearly fell faster.

    But, as we saw in 2015-2016 and again in late 2019, not all corrections involved a steepening. These selloffs occurred without the yield curve model signal being triggered. Did the model stop working?  Hardly. The decline earlier this year was a stark reminder of its predictive power.  What made these corrections different?  More importantly, what is the model signaling now, and how likely is it to play out?

    continued for members(more…)