Posts

  • Update on NDX: Jun 9, 2017

    Last year at about this time we noted that NDX had completed a golden cross — where the SMA50 crosses above the SMA200 — normally a strong buy signal.  But, as we also discussed, such signals had been head fakes the past several times in a row.

    The 50-day recently crossed above the 200-day — a golden cross.  However, this has been a head-fake several times in a row:

    –  the Sep 30, 2015 death cross marked a bottom instead of a top
    –  the Nov 17 golden cross preceded the high by only two weeks
    –  the Feb 5, 2016 death cross was followed by a bottom the very next session

    On the other hand, NDX had also reached potentially significant resistance: two channel tops and a key Fibonacci level.

    If the golden cross was to be believed, we’d see a strong breakout.  If it was another head fake, NDX was due for a tumble.  Unlike the Dow and the S&P 500, NDX had yet to even recover to its Mar 2000 highs.

    It was a head fake.  NDX went sideways for a week before plunging nearly 8% in just 15 sessions.  The bulk of the drop (6.4%) occurred on just three days: Jun 23, 24 and 27. Clearly things were accelerating.On the 27th, the SMA50 actually dropped below the SMA200 — the dreaded death cross — on an intraday basis.  As bad as things had been, were they about to get even worse?

    Readers might remember the Jul 2008 death cross which preceded a 46% drop, and the Sep 2000 cross which resulted in a 79% crash.  In other words, death crosses are not usually very healthy for stocks.

    But, wait, did I mention that NDX experiences frequent head fakes?  On Jun 28th, when the death cross officially occurred, NDX gapped higher.  And, then it kept going. In three weeks, it gained a total of 16% (136% on an annualized basis!) and reached new, all-time highs — not bad for a bearish signal.Since QE started in late 2008, every single NDX death cross except one has signaled a bottom — usually the same day but within, at most, the next two sessions. The one exception, in Dec 2012, took 12 sessions.

    If this doesn’t make you a believer in the Plunge Protection Team, I don’t know what will.  And, considering how critical NDX’s top stocks are to the market’s overall direction, it’s understandable.

    NDX broke above its all-time high on Aug 16, but then spent almost 4 months trying to break out before finally doing so on Dec 7.  Since then, it has been a fairly straightforward meltup.  The only hitch, now, is that NDX has reached a key Fib level that could prove problematic.

    With the NDX providing much of the market’s leadership, is this something to be concerned about?

    continued for members... (more…)

  • Update on VIX: Jun 9, 2017

    Just a quick update on VIX, which moments ago pushed below its Dec 15, 2006 lows of 9.39 — the lowest VIX had been in the lead up to the 2007-2009 market crash.The only time VIX has ever been lower was on Dec 22, 1993, when it fell as low as 9.31 shortly after its creation.For implications and forecasts, please refer to our last major update on VIX in How Broken is the Market?

  • Pulling Out All the Stops

    When unexpected unpleasantness unfurls, you can count on central banks to pull out all the stops. Such is the case with the British election results which, like Brexit, have wreaked havoc on FX markets.

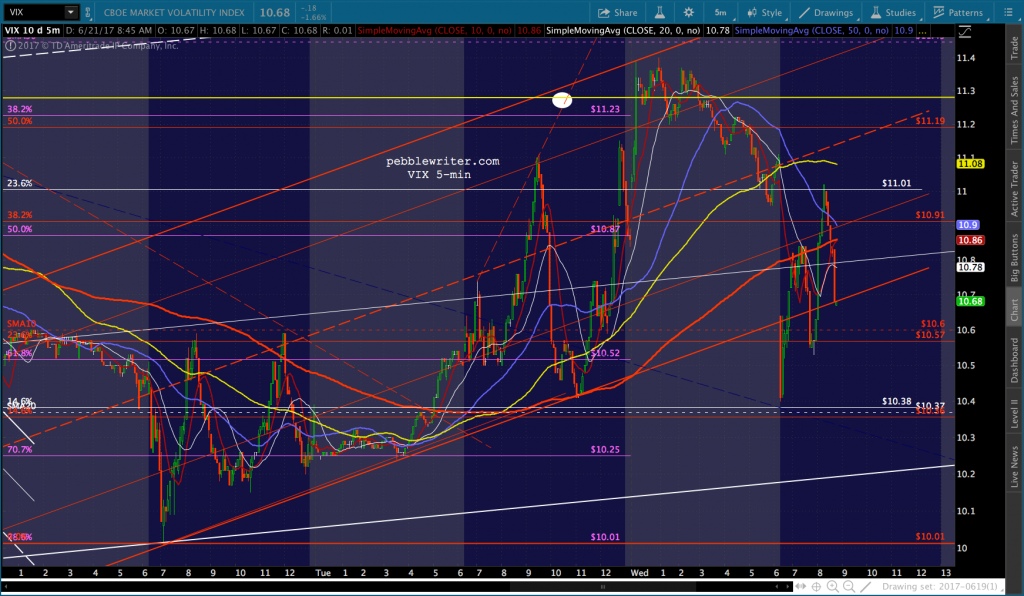
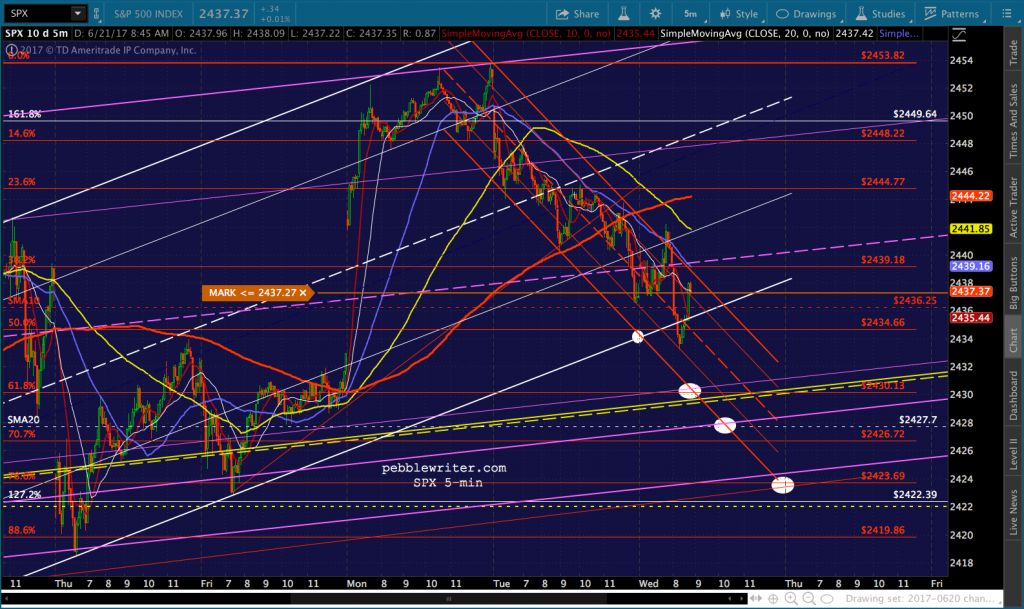
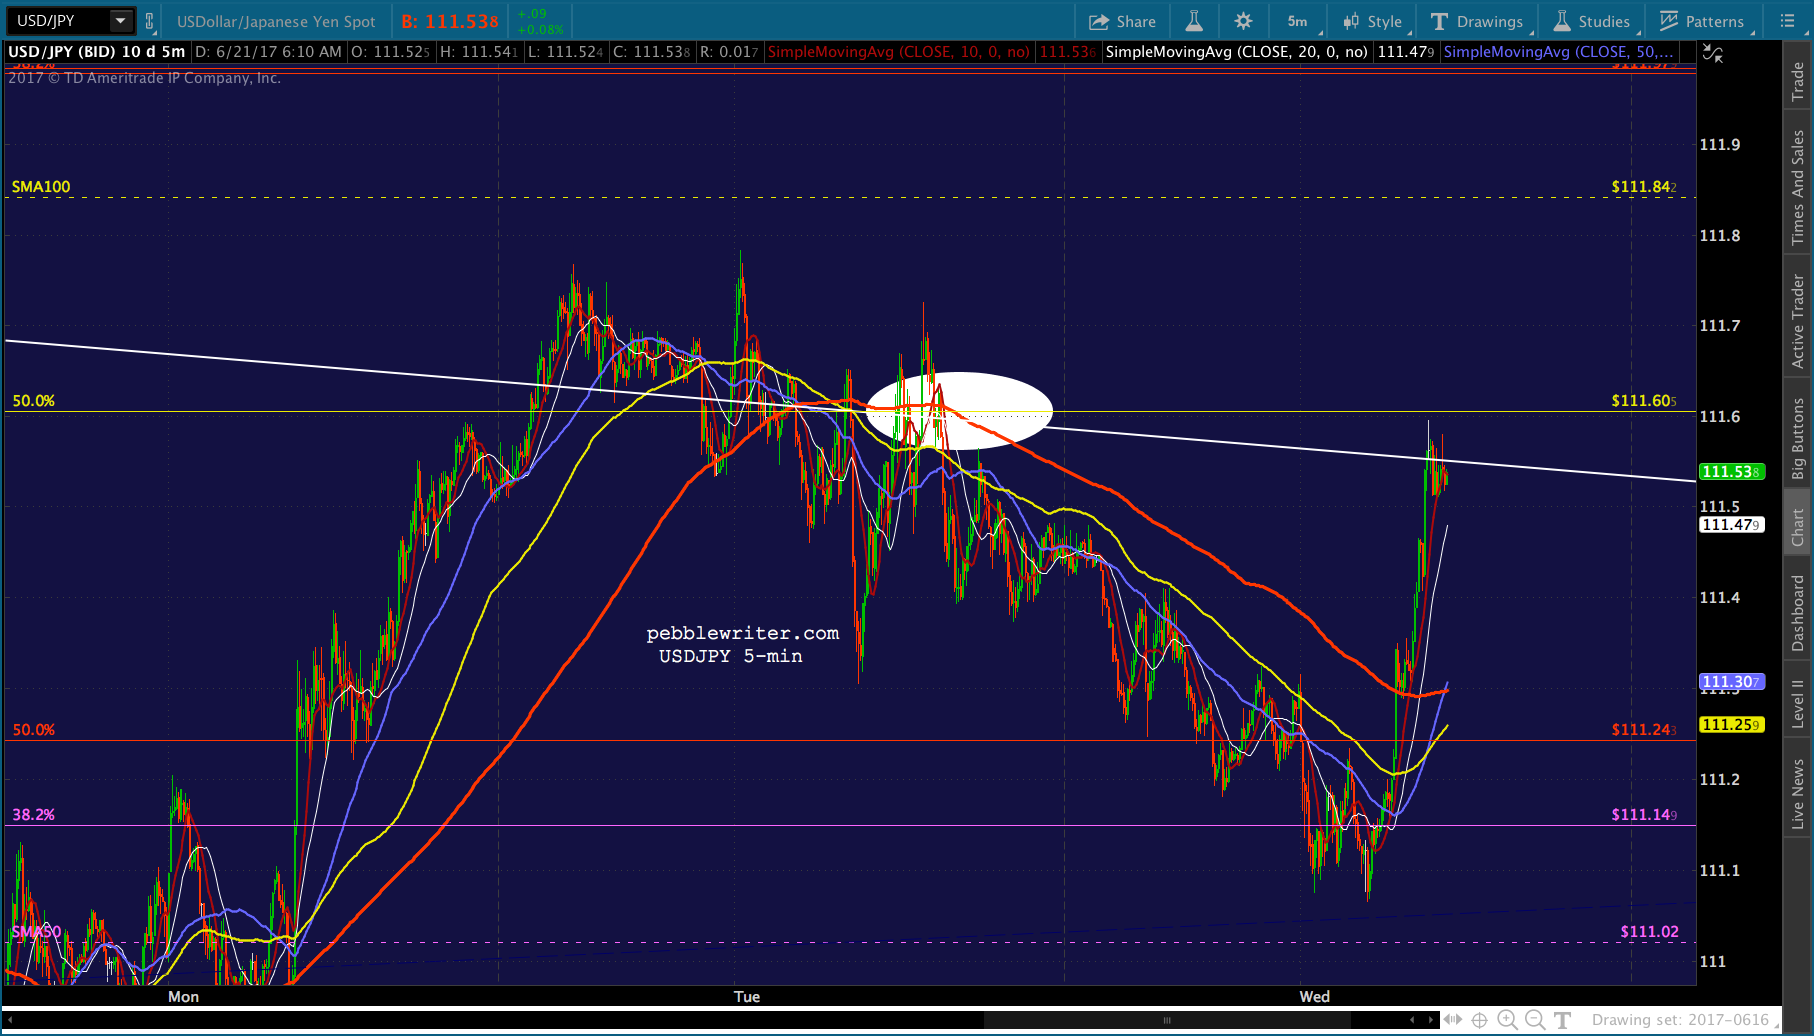
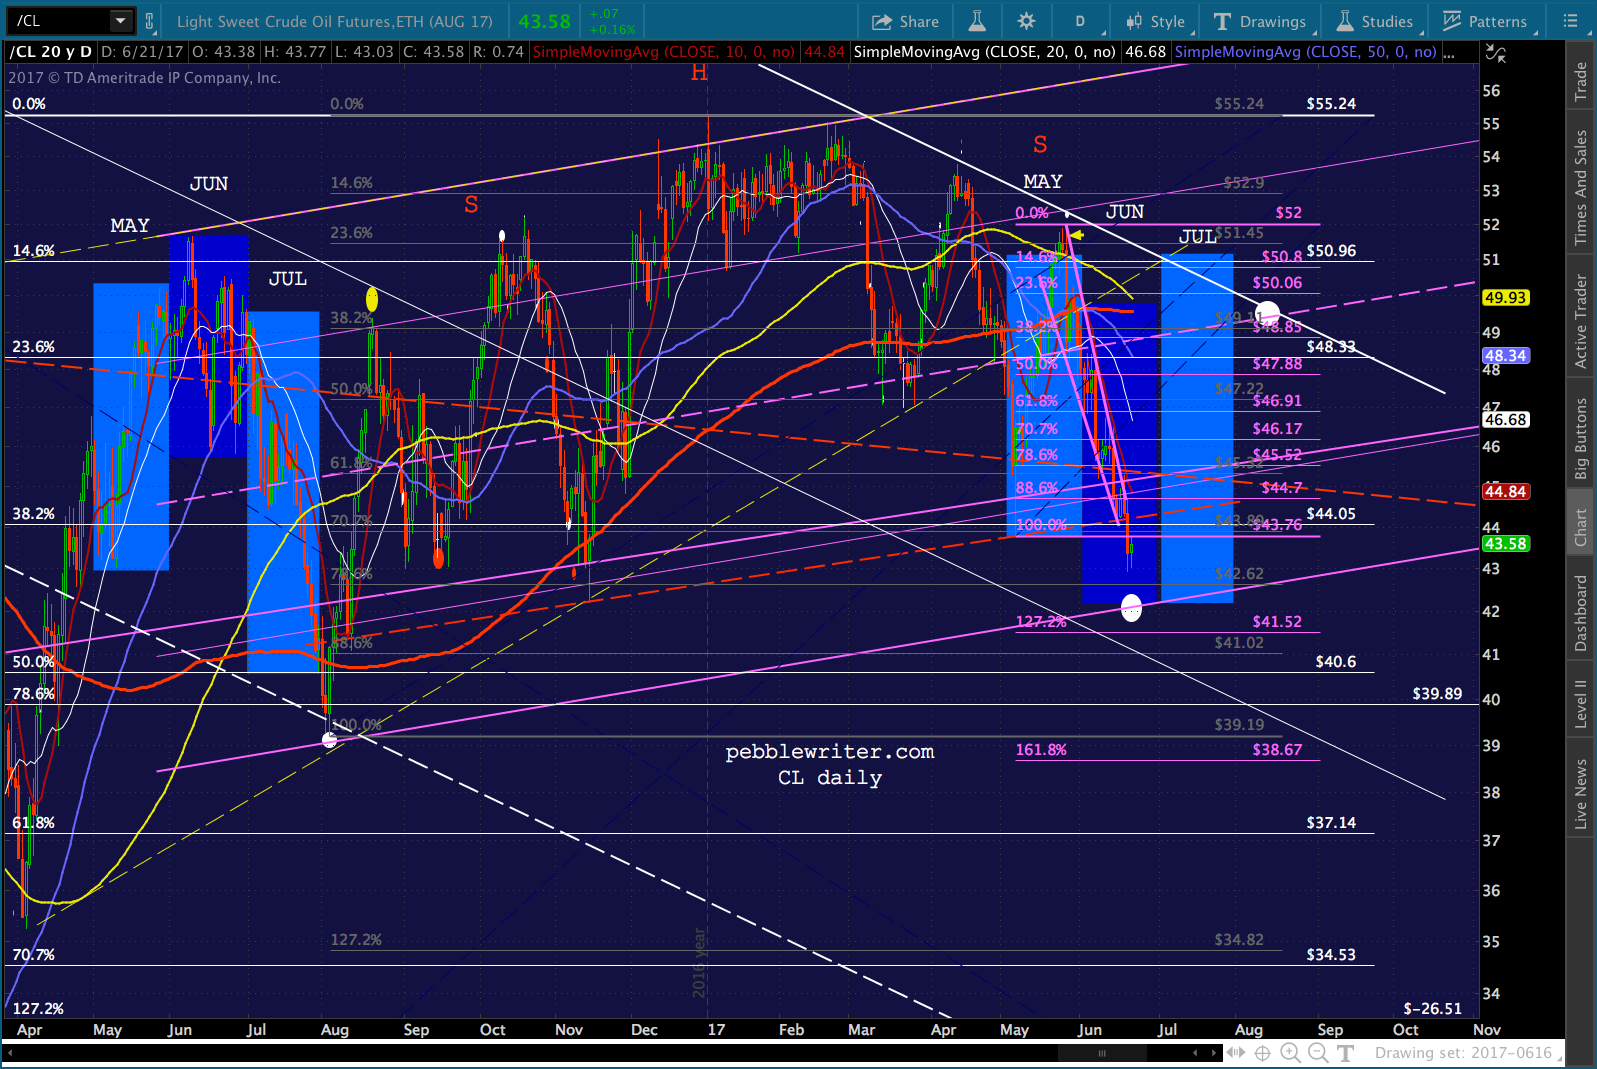
    EURGBP, having broken down from its rising red channel dating back to mid-2015, was well on its way to a perfectly nice backtest at .80ish. Instead, it’s backtesting the broken red channel itself. Hence…the stop pulling.It should start with nice bounces from USDJPY and CL — which, as discussed yesterday, have already reached interim bottoms — and, of course, a sharp plunge by VIX.

    Look for USDJPY to pop through its SMA200 for good measure… …and CL at least hold its own in the midst of strong selling pressure.

    continued for members… (more…)

  • How Central Banks Can Avoid the Next Meltdown

    Let’s face it.  The reflation trade is dead.  It’s not that we don’t have inflation.  It’s just that the way in which inflation is reported in the US makes it appear not to be a problem.

    Not only does this save mountains of moola on cost of living increases, it makes it much easier for the Fed to keep interest rates at historic lows (very important when you’re in hock to the tune of $20 trillion.)

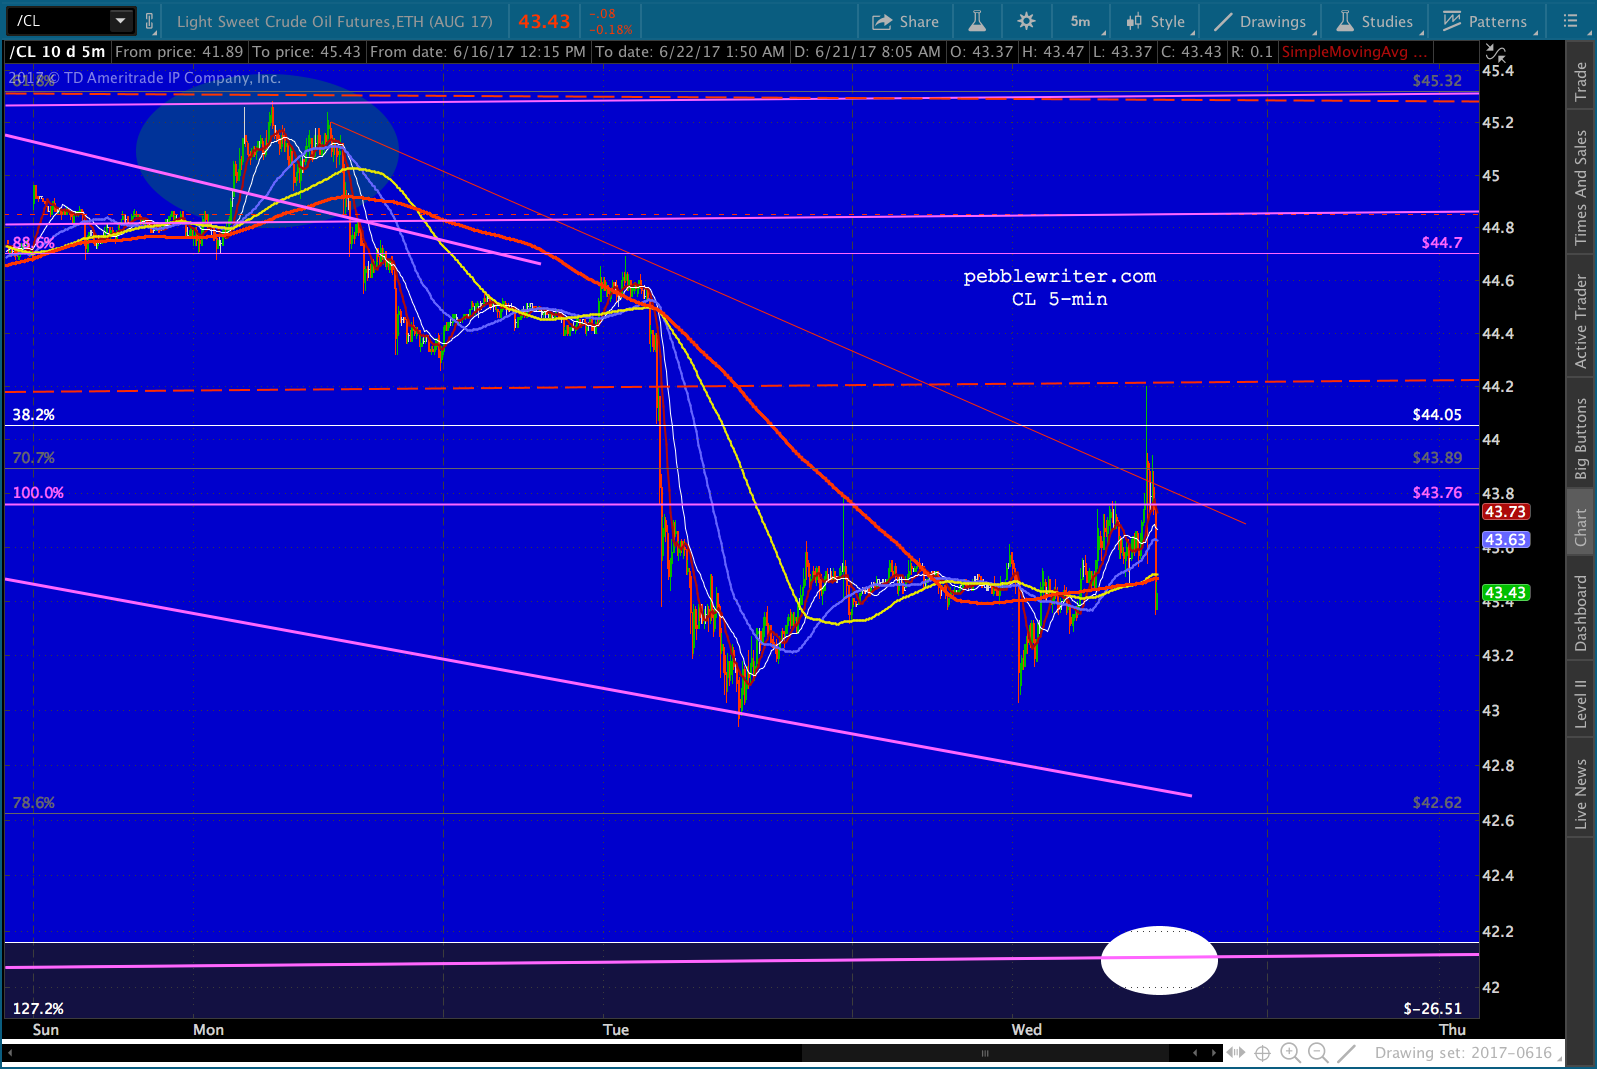
    Keeping this thought in mind is important when it comes to predicting what the Fed is going to do, say, next week.  And, it has sure come in handy when forecasting the price of oil, gold, the USD, etc. (oil nailed our next downside target overnight.)

    Now, the $64 trillion question: if the reflation trade is dead, what about the Trump Rally?  It seems stocks have been operating in another universe — where earnings, geopolitical events, and macroeconomics no longer apply.

    Regular readers know that I’ve poo-pooed the Trump Rally from the start [see: Why the Trump Rally is a Fraud and Central Banks and Markets for starters.]  It was built on a foundation of a historic crash in VIX and spike in USDJPY.

    No doubt, some fundamental investors piled on, buying the idea that Trump could bend the laws of mathematics to his will (lower taxes and increased spending without increasing the debt/deficit.) Others correctly reasoned that such an exercise would produce inflation, which is usually a good thing for at least nominal, if not real, returns.

    And, a considerable number of trend followers jumped on board once key technical levels were taken out.  But, the fundamental crowd has probably realized, by now, that there’s a difference between campaign promises and signed legislation.

    If reflation isn’t, and the fundamentalists lose faith in Trump’s magic, what’s to keep markets ratcheting higher?

    continued for members…
    (more…)

  • Update on Gold: Jun 7, 2017

    Several weeks ago [see: May 17 update] I noted that, although gold had broken down through its SMA200 and fallen out of a prominent rising channel, I wasn’t buying the downside scenario this suggested.

    I’m not crazy about this scenario, even though the backtest says it makes sense.  I think DX is heading lower than 97.583, and this would suggest higher GC prices.

    That would require that GC reenter the rising red channel, of course.  But, stranger things have happened — especially when the underlying is so heavily manipulated in the first place.

    As it turned out, gold did exactly that – blowing through the backtest and reentering the rising red channel.  Yesterday, it pushed through an important fan line and briefly topped its Apr 17 highs.With DX well on its way toward our downside target, does gold have still more upside left?

    continued for members… (more…)

  • Dollar Struggles

    The weakening dollar continues to weigh on equities.  The FOMC has its work cut out for it as investors are increasingly having a hard time believing that a rate hike is on the way.

    After three weeks of avoiding its SMA200 like the plague, USDJPY broke down through it last night and is headed for our next lower target.  This has left ES on the brink of a channel line of support.

    continued for members… (more…)

  • The Mechanics of This Rally

    Last week, both SPX and ES reached Inverted Head & Shoulders targets we established nearly a year ago [see: CIW July 11, 2016.]  Not too surprisingly, they topped those targets on Friday, then spent the day defending them.  This pattern of slicing through upside resistance and then defending the hell out of it has been a constant over the past several years.  But, it’s been ever more blatant since last year’s election.

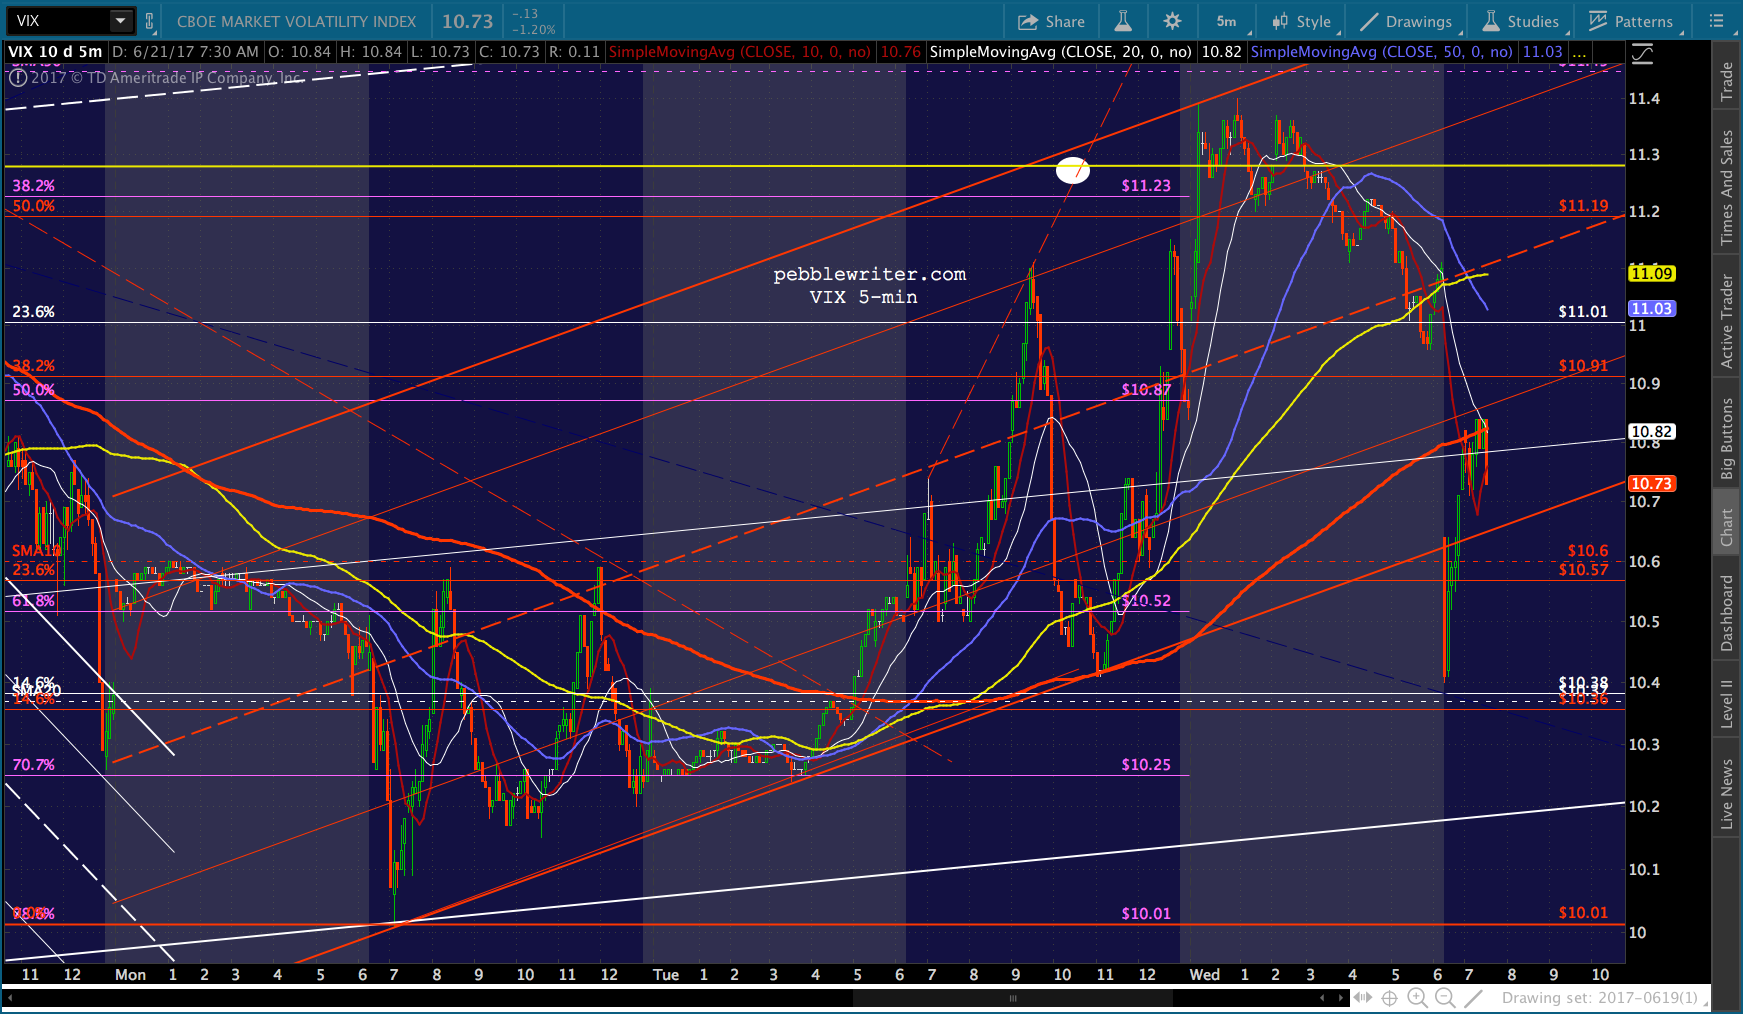
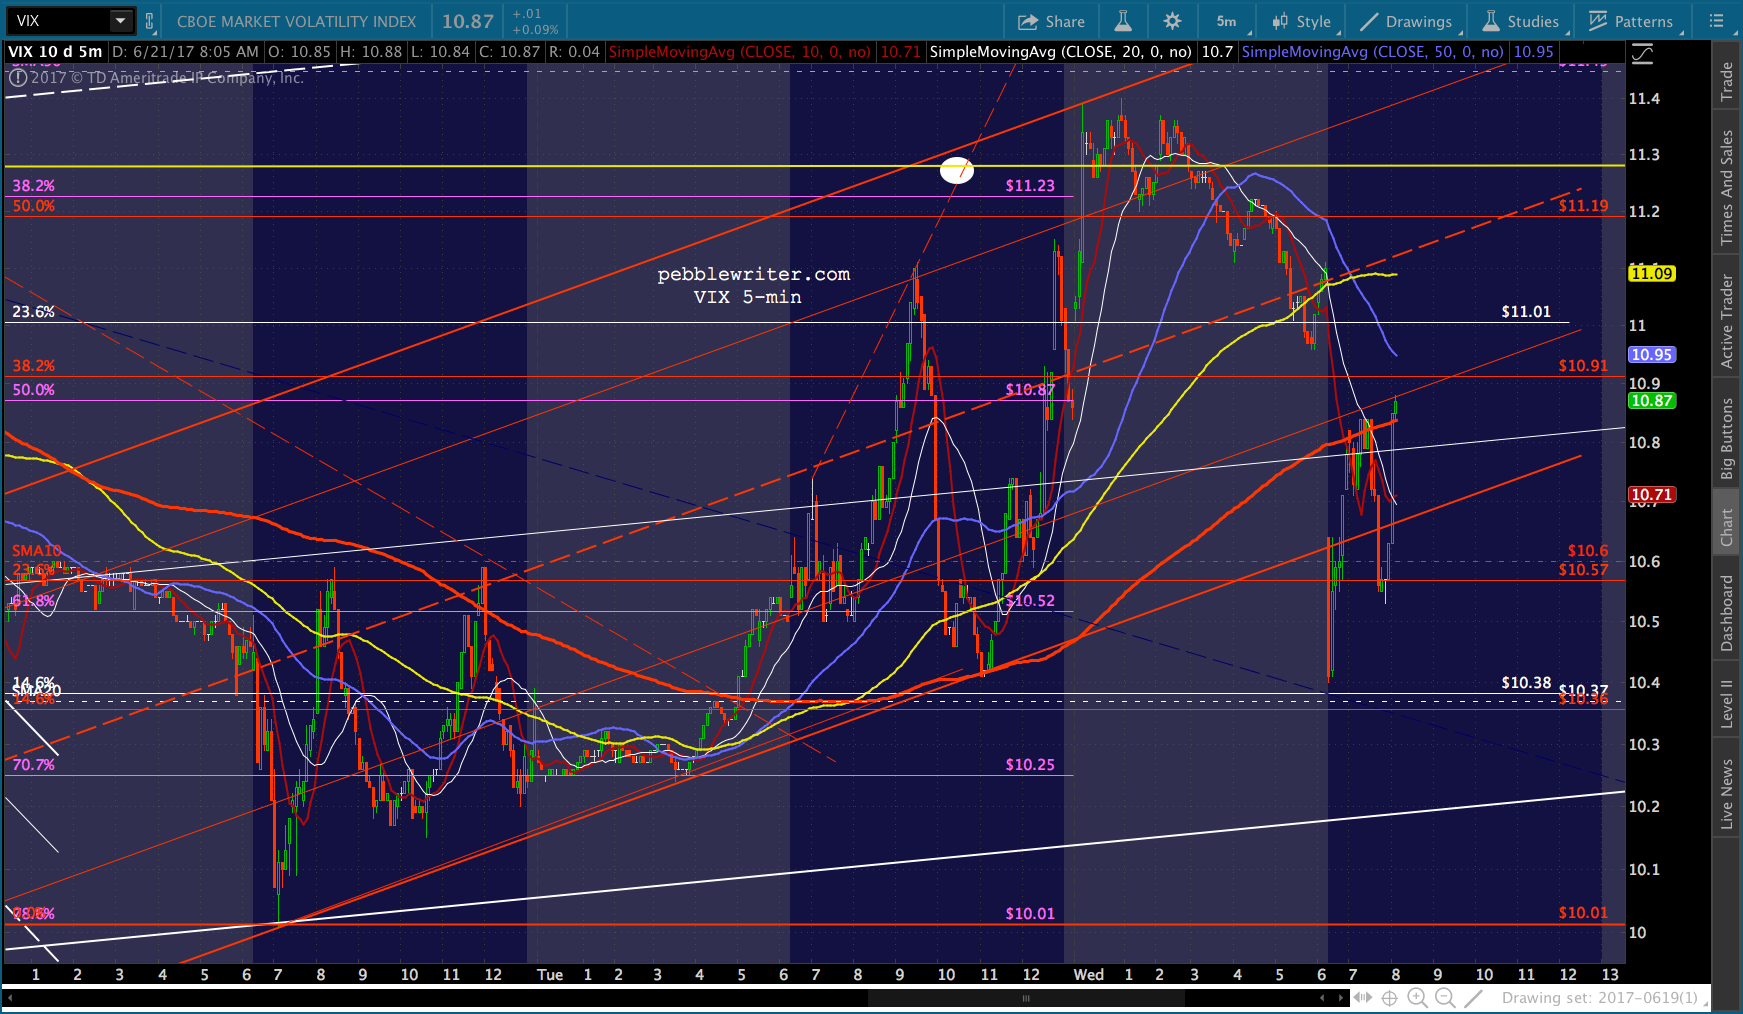
    We’ve covered the whys, wherefores and hows extensively.  Consider, for instance, how VIX continues to test all-time lows, constructing arbitrary channels and trend lines which it can then “break down” through at key moments.

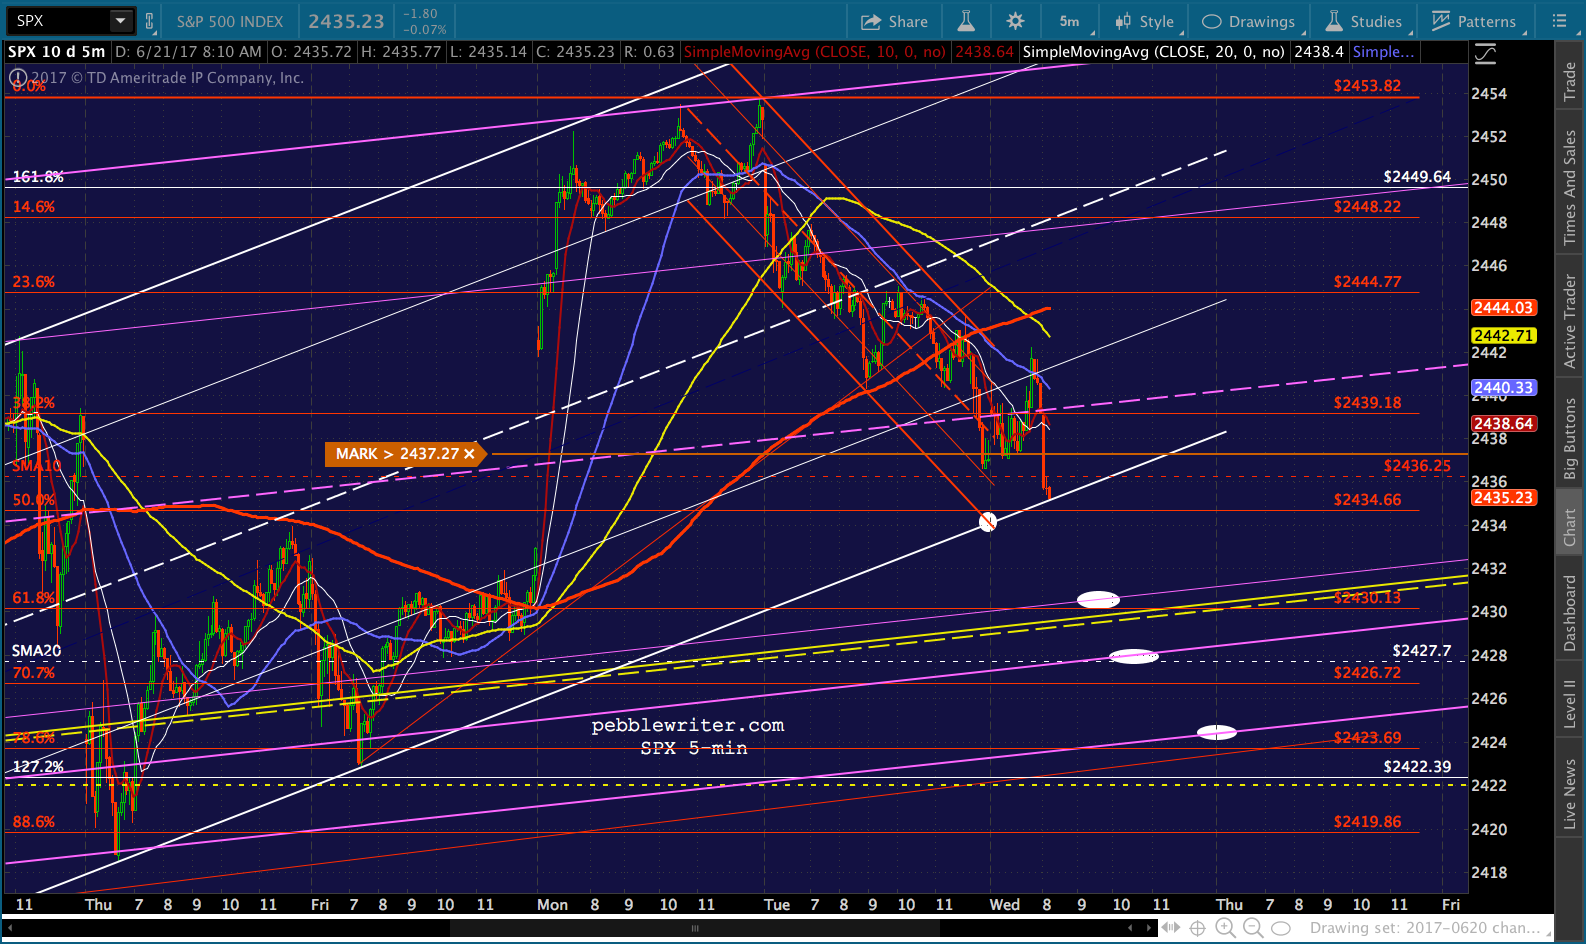
    Another favorite trick is ramping higher overnight, when futures are easily supported, only to plunge during the session when stocks need a boost.  With futures currently off a couple of points, we should see it play out this morning. Another common occurence we’ve examined at length is the use of well-timed rallies in oil and USDJPY.  On May 19, I identified a trade opportunity for USDJPY, noting that it was likely to drop from 111.40 to its SMA200 — then at 109.76.  It was a nice short with a modest but healthy payoff.  All it had to do was continue lower in the red channel shown below.Instead, it constructed a series of bounces and sharp rallies which boosted stocks and, ultimately, enabled it delay the tag until it constituted a higher low.  Instead of dropping to 109.76, it waited until the SMA200 had risen to 110.30.  When the tag finally occurred, it was at 8pm on a Sunday night.In the time it took to write the above, VIX has “broken down” through TL support, presumably because SPX’s 3.42-pt drop was getting out of hand.  Somewhere, someone is calculating how much further it would need to be hammered in order to get stocks back to green.I remember chuckling in 2014 when Bernanke said that rates would never normalize during his lifetime.  How could he be so certain?  His economic forecasting skills had certainly fared poorly.  Apparently, his hubris had emerged unscathed.

    JP Morgan now calculates that one-third of the world’s $54 trillion in tradable bonds are currently owned by central banks, confirming what we chartists have observed for years: interest rates are too important to be left to the vagaries of unpredictable investors and traders.

    The same can obviously be said for equities.  As trading volume continues to drop and passive strategies attract an ever-larger share of assets, entire markets have become more easily manipulated by central banks.  The BoJ and SNB buy shares outright.  The ECB and Fed intervene indirectly by manipulating the primary inputs to algorithms that drive so much of the daily price action.

    I had an interesting chat with a fellow student of the markets yesterday.  He posed the question: “is this 1995 or 1999?”  I think that’s the most important question investors can be asking themselves right now.

    I’ve maintained since March that a June rate hike was problematic.  In April, I started incorporating it into our big picture forecasts.  And, on May 12 I made it official with the post Bye Bye Rate Hikes.  Ten years since the onset of the Great Financial Crisis (and over four years since the S&P 500 recovered enough to make new, all-time highs), markets have never been more dependent on the activities of central bankers.

    continued for members…
    (more…)

  • Charts I’m Watching: Jun 2, 2017

    Yesterday saw ES and SPX zoom through our initial upside targets to tag our secondary targets — the IH&S targets we set back on Apr 21.  More significantly, SPX finally reached the upside target we identified back on July 11 when a much larger IH&S Pattern completed.  The instigator, again, was VIX which, unless it intends to make new all-time lows, is running out of things to break down through. The other big development this morning is the DXY breaking down and approaching our next downside target.  This is allowing EURUSD to break out towards our upside target and USDJPY to (finally) approach our downside target.

    As we surmised Wednesday, the falling red channel was busted and the SMA200 tag delay in order to get through the end of May on a high note and to ensure that the tag occurred on a higher low than it would have been back on May 18.  I’ve left the red dot where the SMA200 was on that day.It still doesn’t bode well for equities.

    continued for members… (more…)

  • The Same, but Different

    Yesterday started out with a VIX-driven pop that quickly fizzled and nailed our downside target before rebounding and hitting our upside target.  Since SPX closed right at resistance, it needed a boost overnight.  So, why not go back to the same clever trick that worked the day before?

    Yes, VIX’s red channel has broken down again.  And, the algos are eating it up… to the tune of +5 on ES.

    Will it pop and drop, again, or will this one take?

    continued for members… (more…)

  • The Big Picture: May 31, 2017

    I suspect today will be another one of those days, like yesterday, when every little dip in SPX is met with a corresponding dip in VIX, i.e. more melting up.  The 5-point gain in the futures came courtesy of the rising VIX channel “breaking down” at 7:15 ET (the white arrows.)  Sadly, that’s all it takes these days.

    FWIW, I’ll leave yesterday’s downside targets for SPX and USDJPY in place just in case the VIX bashing lets up.

     *  *  *

    Instead of tracking those squiggles, I’m going to take the day and make some sense of yesterday’s word salad that started out as an update on oil.  In analyzing oil, I was able to solve some puzzles regarding the relationships between oil, equities, currencies, interest rates, debt and inflation that been nagging me for quite some time.

    Did you know, for instance, that although interest rates have been sliced in half since 2008, we’ll spend more servicing the federal debt in 2017?  At the current run rate, we’ll spend over $500 billion for the first time in history — more than Medicaid and almost as much as on Medicare or the military.  Some of the projections for future growth are downright frightening.From a central banker’s perspective, it must be terrifying — particularly if you take inflation into account.  Traditionally, higher inflation has been countered with higher interest rates.  But, how does that pencil out when debt and interest expenses are already past the point of no return?

    This quandary helps explain many of the zigs and zags in the markets over the past 10 years.  I suspect it will become even more important in the year ahead as we forecast the Fed’s actions and their likely outcome on markets.

    continued for members…
    (more…)