

Yesterday saw ES and SPX zoom through our initial upside targets to tag our secondary targets — the IH&S targets we set back on Apr 21. More significantly, SPX finally reached the upside target we identified back on July 11 when a much larger IH&S Pattern completed. The instigator, again, was VIX which, unless it intends to make new all-time lows, is running out of things to break down through.  The other big development this morning is the DXY breaking down and approaching our next downside target. This is allowing EURUSD to break out towards our upside target and USDJPY to (finally) approach our downside target.
As we surmised Wednesday, the falling red channel was busted and the SMA200 tag delay in order to get through the end of May on a high note and to ensure that the tag occurred on a higher low than it would have been back on May 18. I’ve left the red dot where the SMA200 was on that day. It still doesn’t bode well for equities.
continued for members…
EURUSD seems destined for 1.1470…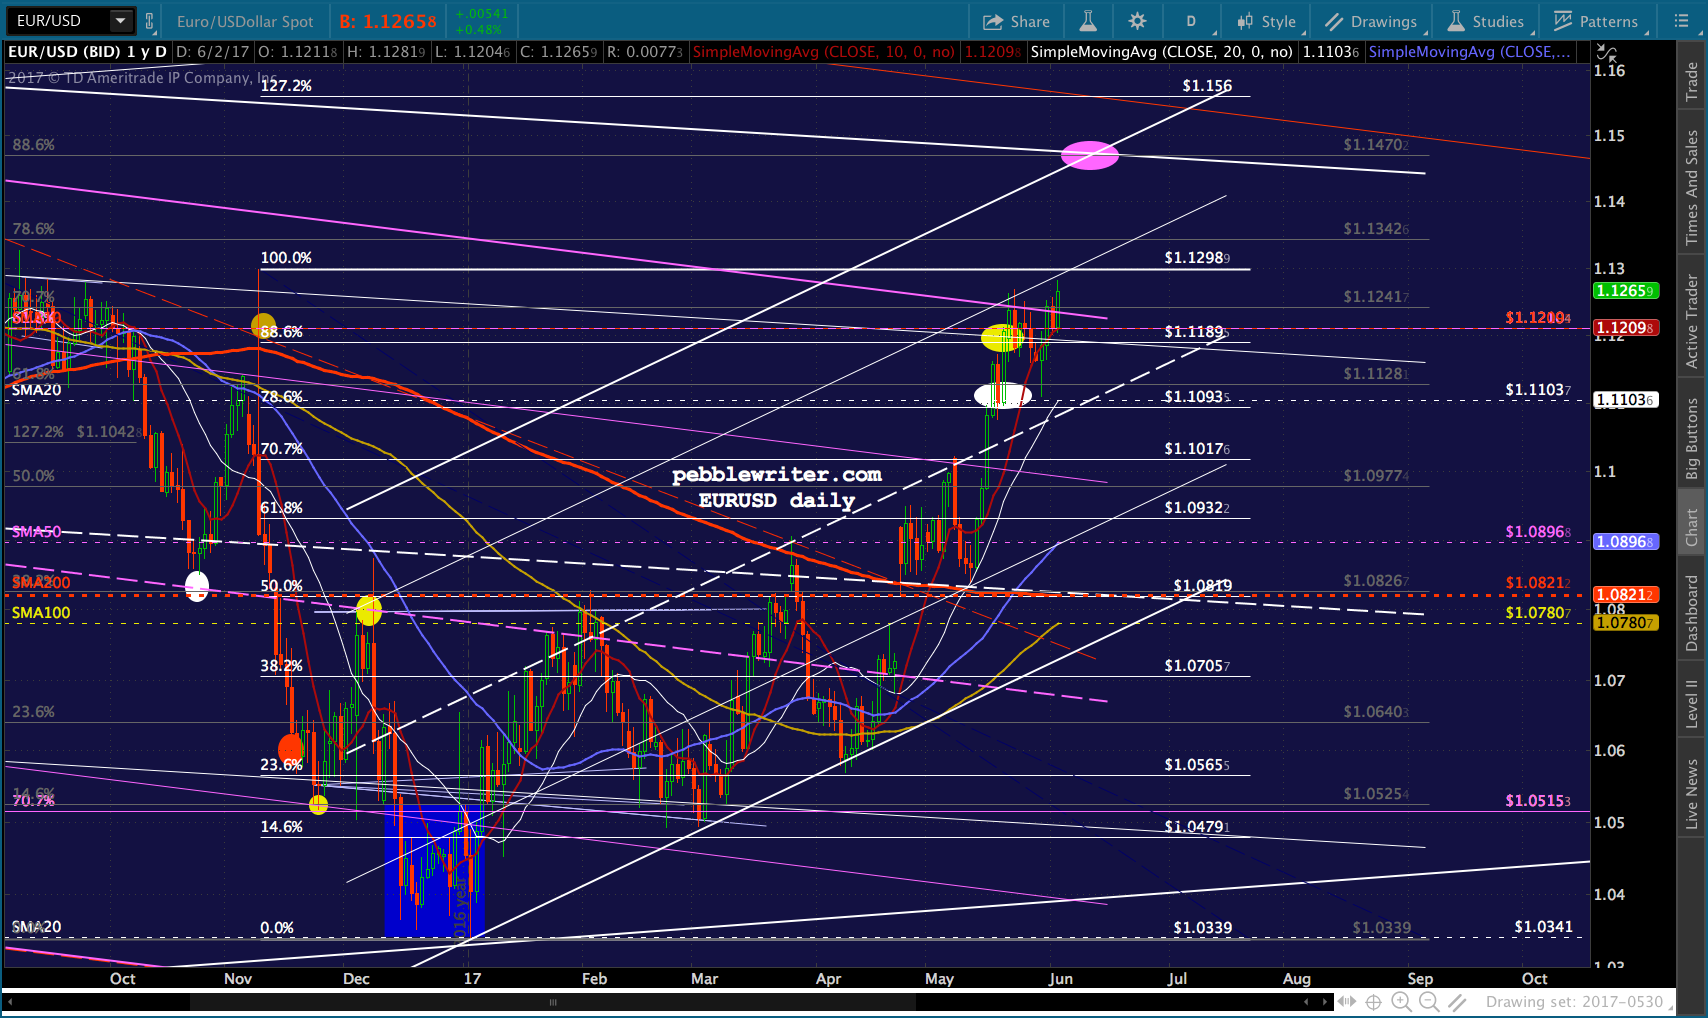 …and, DXY for the purple channel midline at around 96.154.
 CL continues to struggle.
 ES was maneuvered up above its smaller yellow channel top and IH&S target. But, it remains to be seen whether or not it will hold.
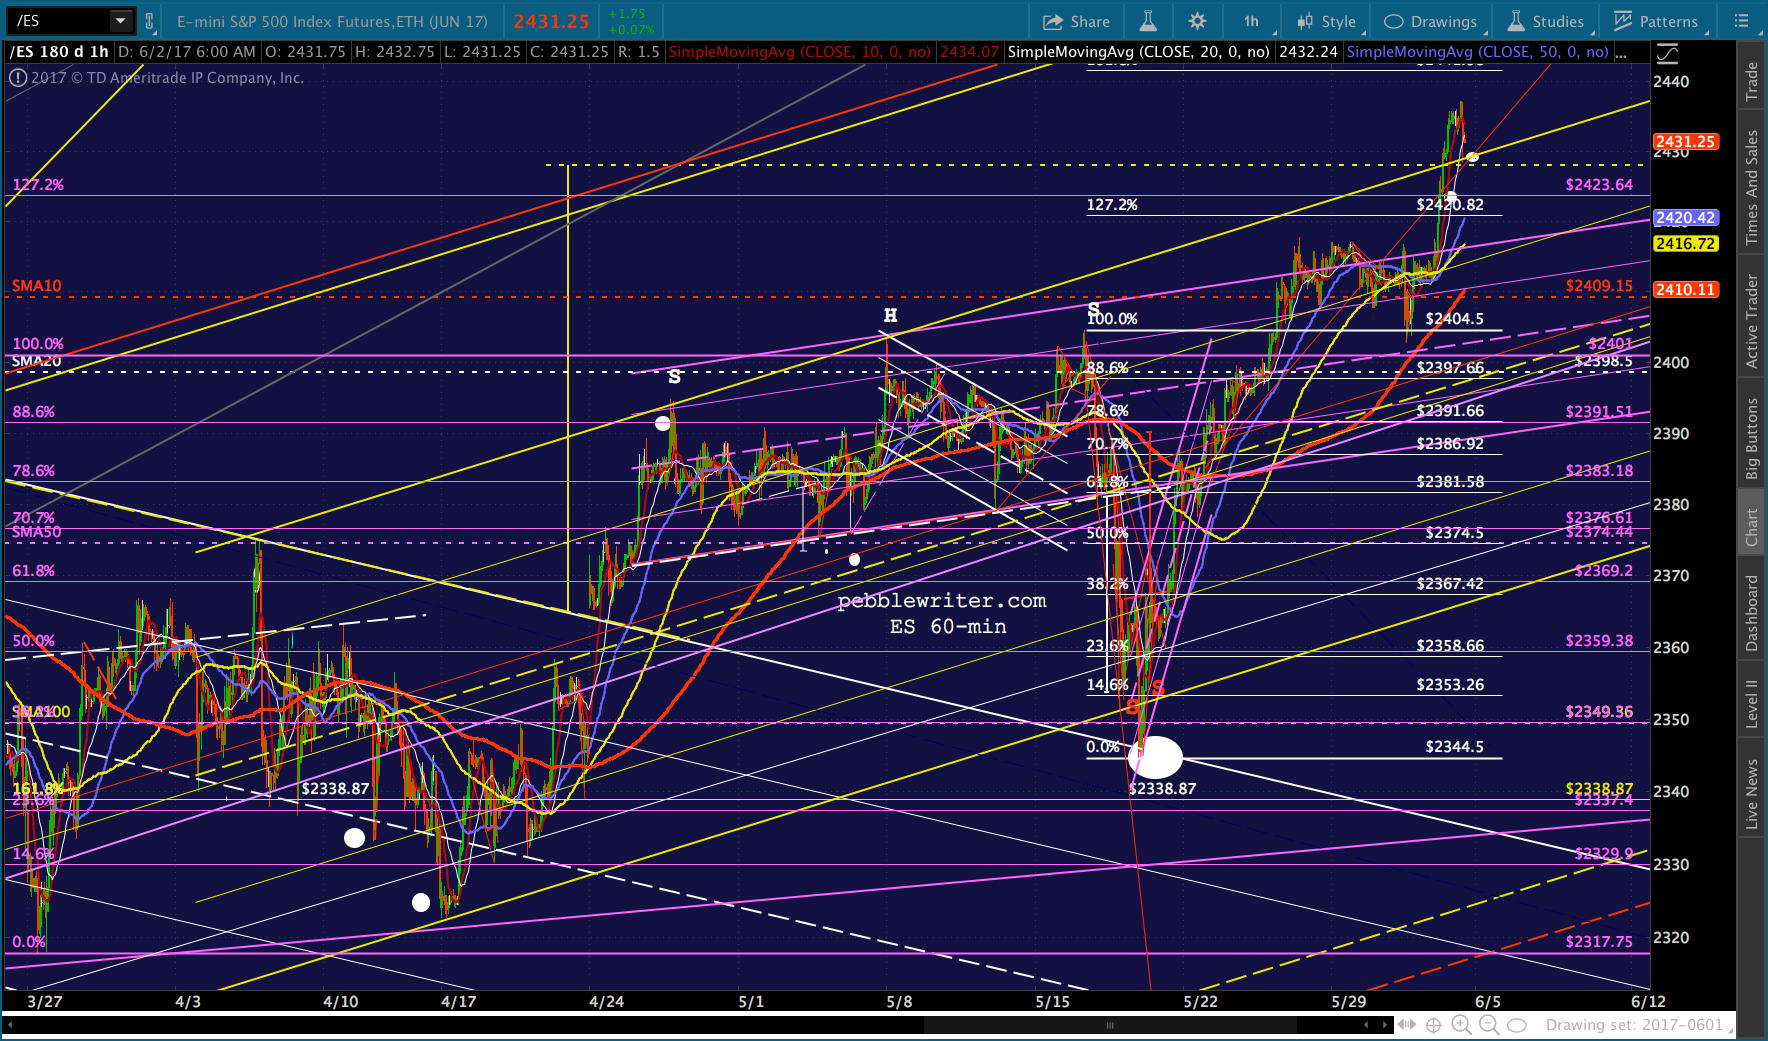 Note that SPX is similarly positioned and is backtesting the broken yellow channel bottom.
 This is a minor channel, and had served as an expansion of the white channel that originally guided prices higher following the Feb 2016 plunge.
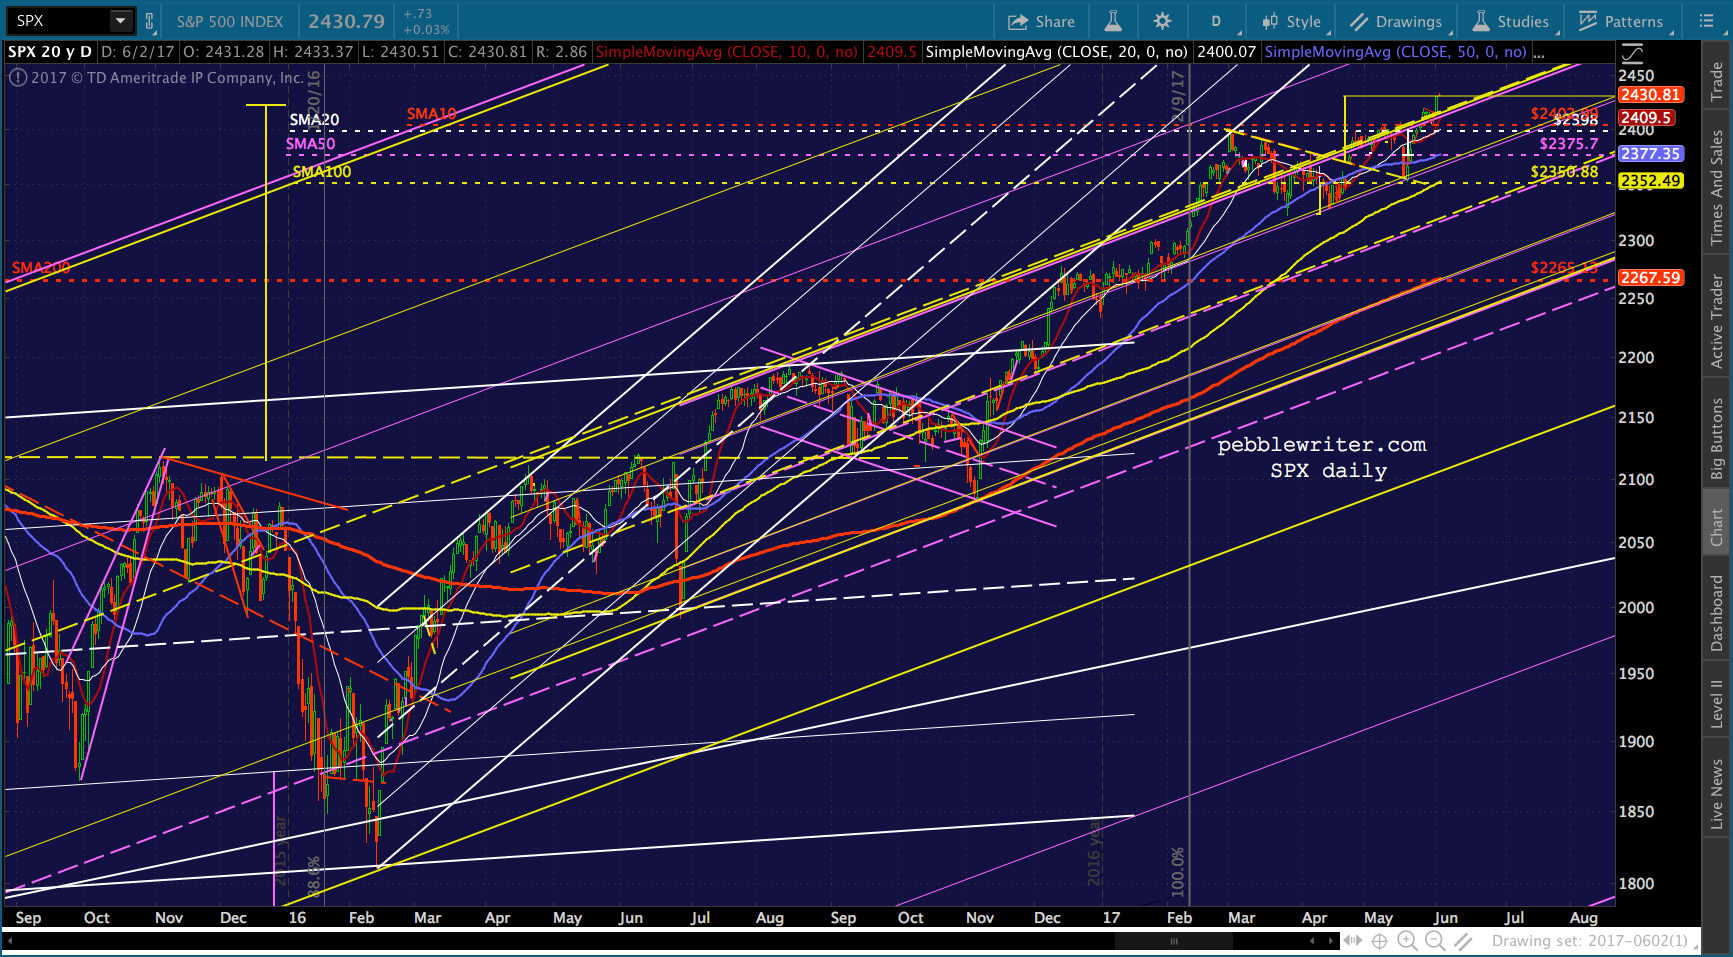 Once the white channel broke down, we might have expected to see prices drop a lot. But, instead, they put in a shallow falling channel (in purple, from Oct 11 – Nov 8) which they broke out of (VIX) in order to start a new, parallel rising red channel.
 It is this channel which broke down on May 17. This time, however, the drop was limited to a week or so. It is being backtested today. If the backtest holds, then I suspect we’ll get more sideways action in order to flesh out the rising purple channel which I think will ultimately provide upside guidance.
 All of this, of course, is in service of breaking out of the flat white channel that SPX broke out of on Dec 7 (the red arrow below)…
 …when VIX broke down (white arrow)…
 …and, USDJPY and DXY overshot their channel tops.
 It’s difficult to know exactly what to expect from SPX. It has spent 15 months in the rising yellow channel lodged in between the .236 and midline of the large yellow channel. It has tried mightily to break out. But, there’s not much impetus.
The Fed doesn’t really want to raise rates. We simply can’t afford it. But, if they fail to do so, it’ll be tough for USDJPY to make much headway. Increasing oil prices would help stocks, but also increase inflation pressures — meaning an undesirable rate hike.
VIX is a smidge away from all-time lows, so that’s always a possibility. But, then, what would they use to bail stocks out of the next slump?
I see us treading water at least into July, with gains coming from cycling USDJPY, CL and VIX (i.e. ramping during the trading session and resetting each night.) There are quite a few events that could knock stocks back (Korea, Syria, Russia, China, etc….) The goal will be to aggressively mitigate the effects and support stocks — in other words, lots of dip buying.
It’s silly, too, because the yellow channel top is rising at roughly 9% per annum — a reasonable rate of increase given the crappy economy and earnings (for most stocks.)
This being Friday, it seems they’re in support mode right now. If SPX were to close here, the SMA10 is at 2409.47. That would make for a nice backtest. So, I’d remain short if you’re able to hedge or handle the risk of a gap higher over the weekend.
Today is my daughter’s high school graduation, so I’m going to duck out early. I’ll hopefully get a chance to post later in the day.
GLTA.