

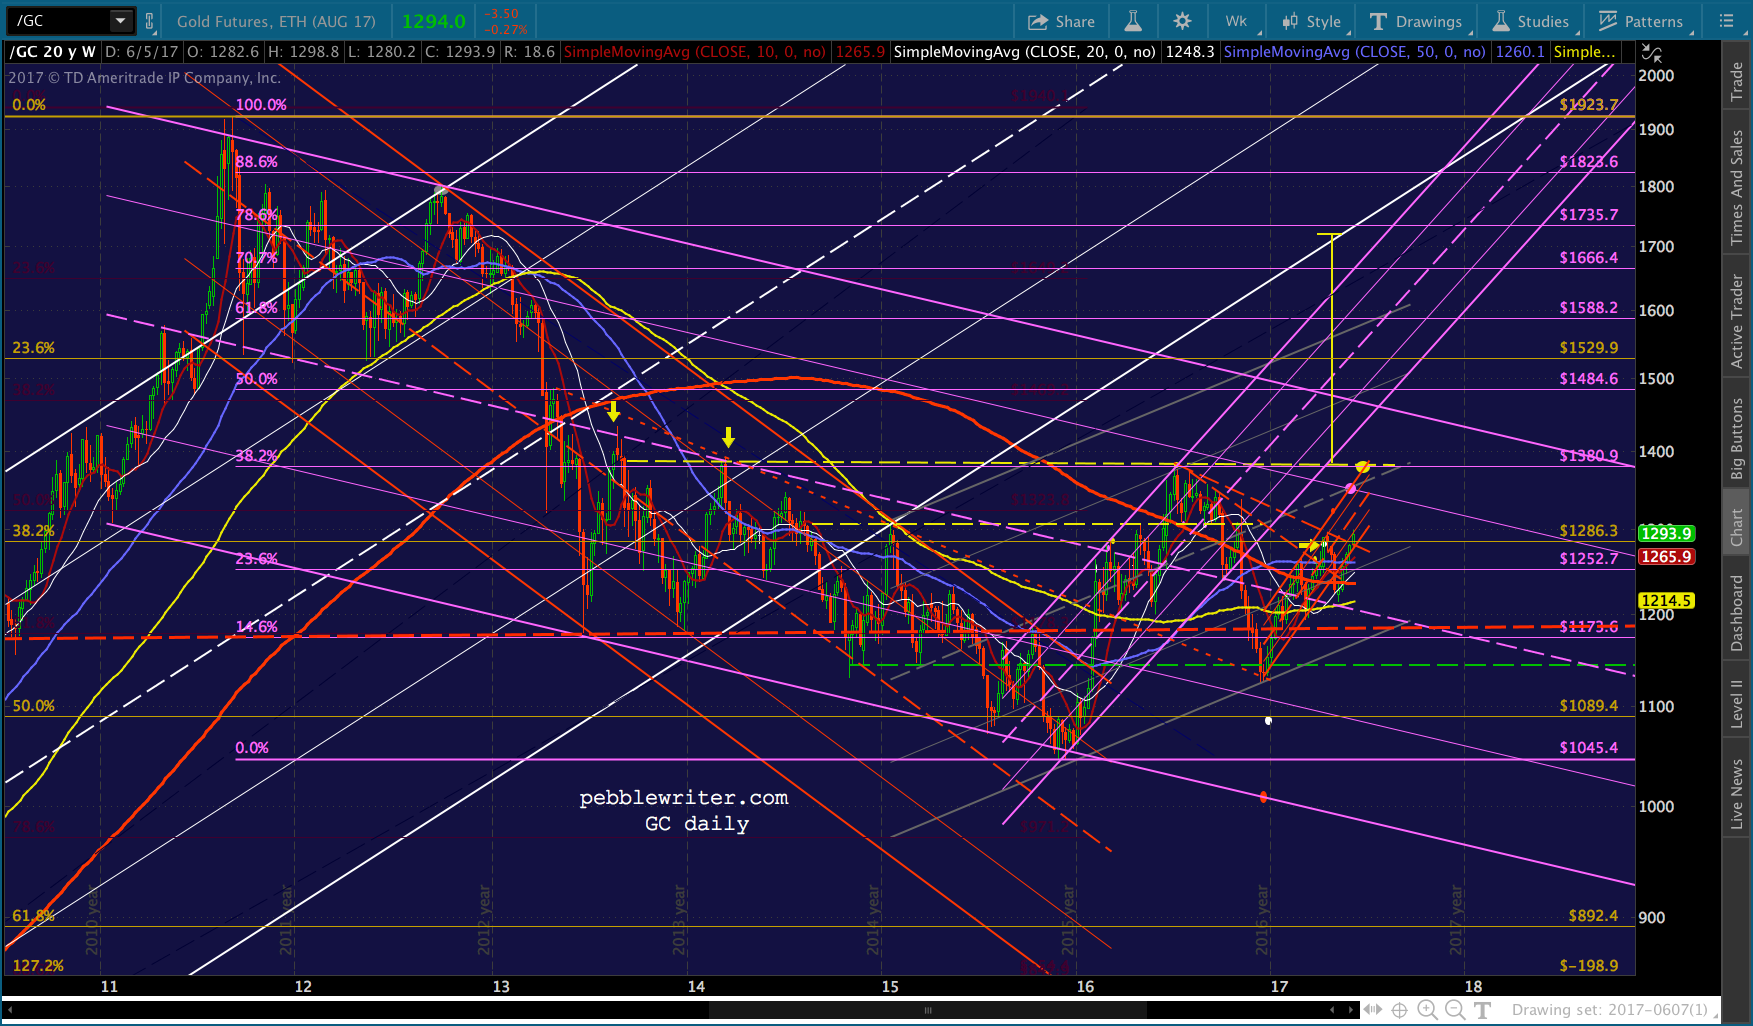
Several weeks ago [see: May 17 update] I noted that, although gold had broken down through its SMA200 and fallen out of a prominent rising channel, I wasn’t buying the downside scenario this suggested.
I’m not crazy about this scenario, even though the backtest says it makes sense. I think DX is heading lower than 97.583, and this would suggest higher GC prices.
That would require that GC reenter the rising red channel, of course. But, stranger things have happened — especially when the underlying is so heavily manipulated in the first place.
As it turned out, gold did exactly that – blowing through the backtest and reentering the rising red channel. Yesterday, it pushed through an important fan line and briefly topped its Apr 17 highs.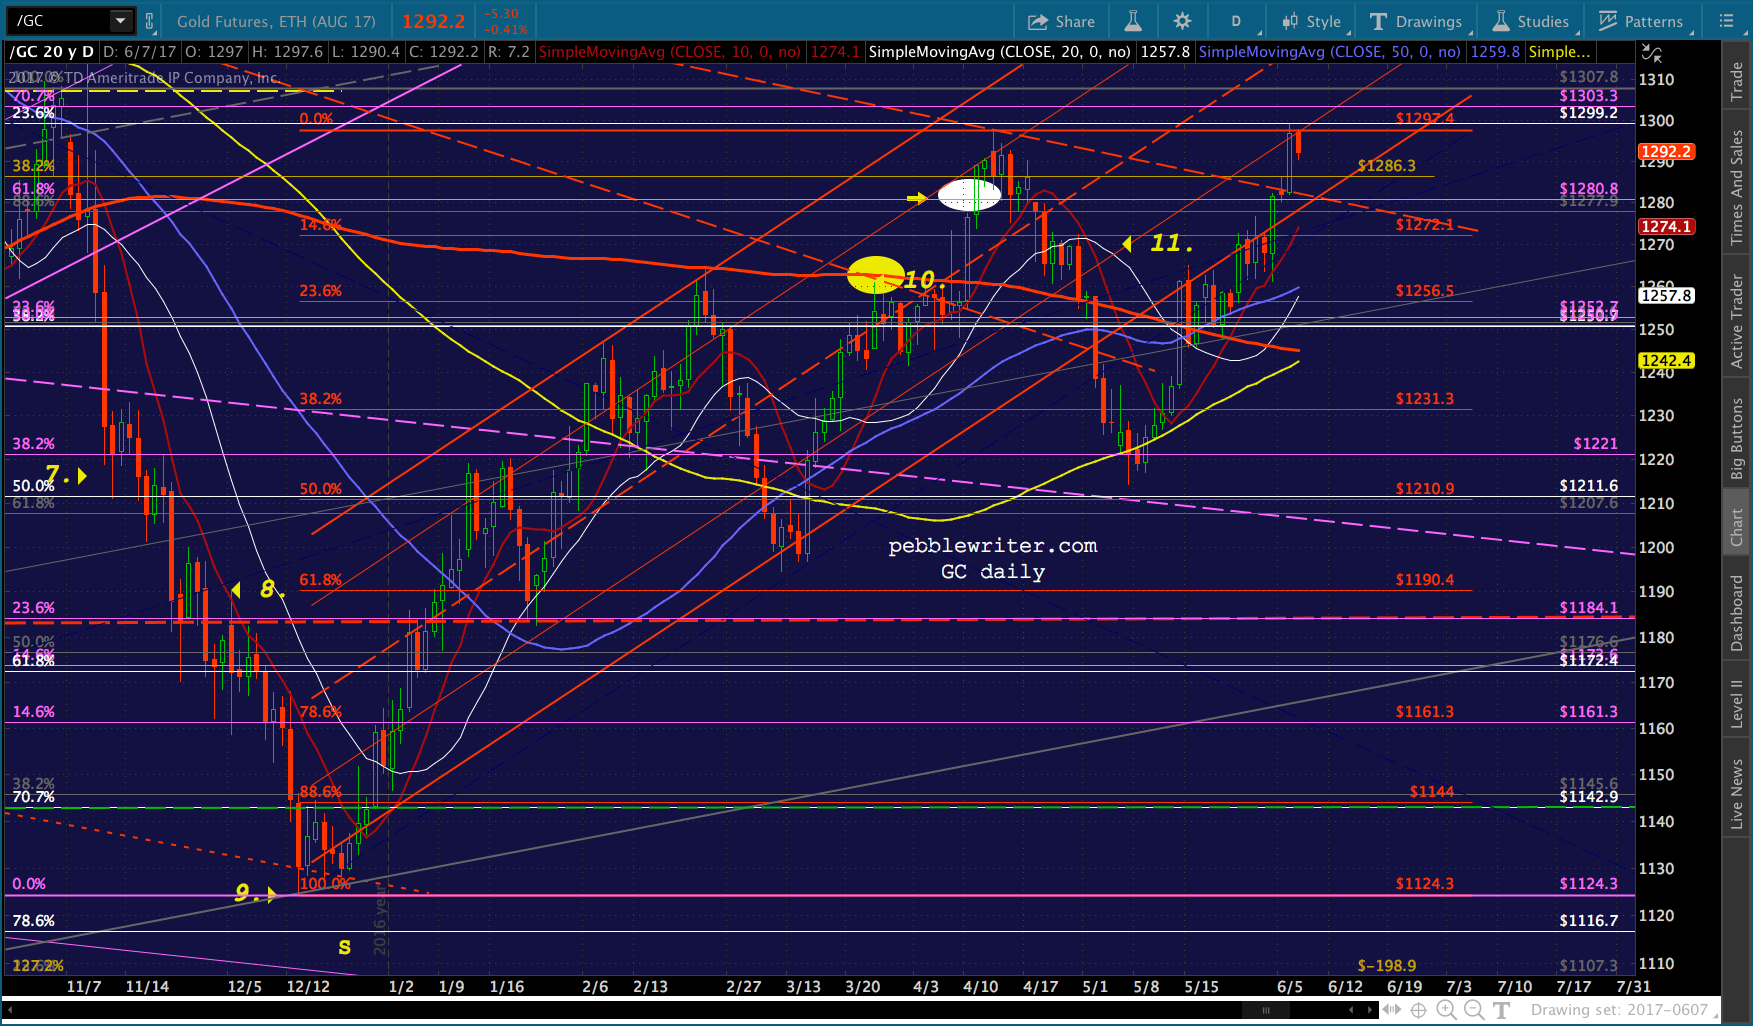 With DX well on its way toward our downside target, does gold have still more upside left?
continued for members…
A reminder of our upside targets from the May update:
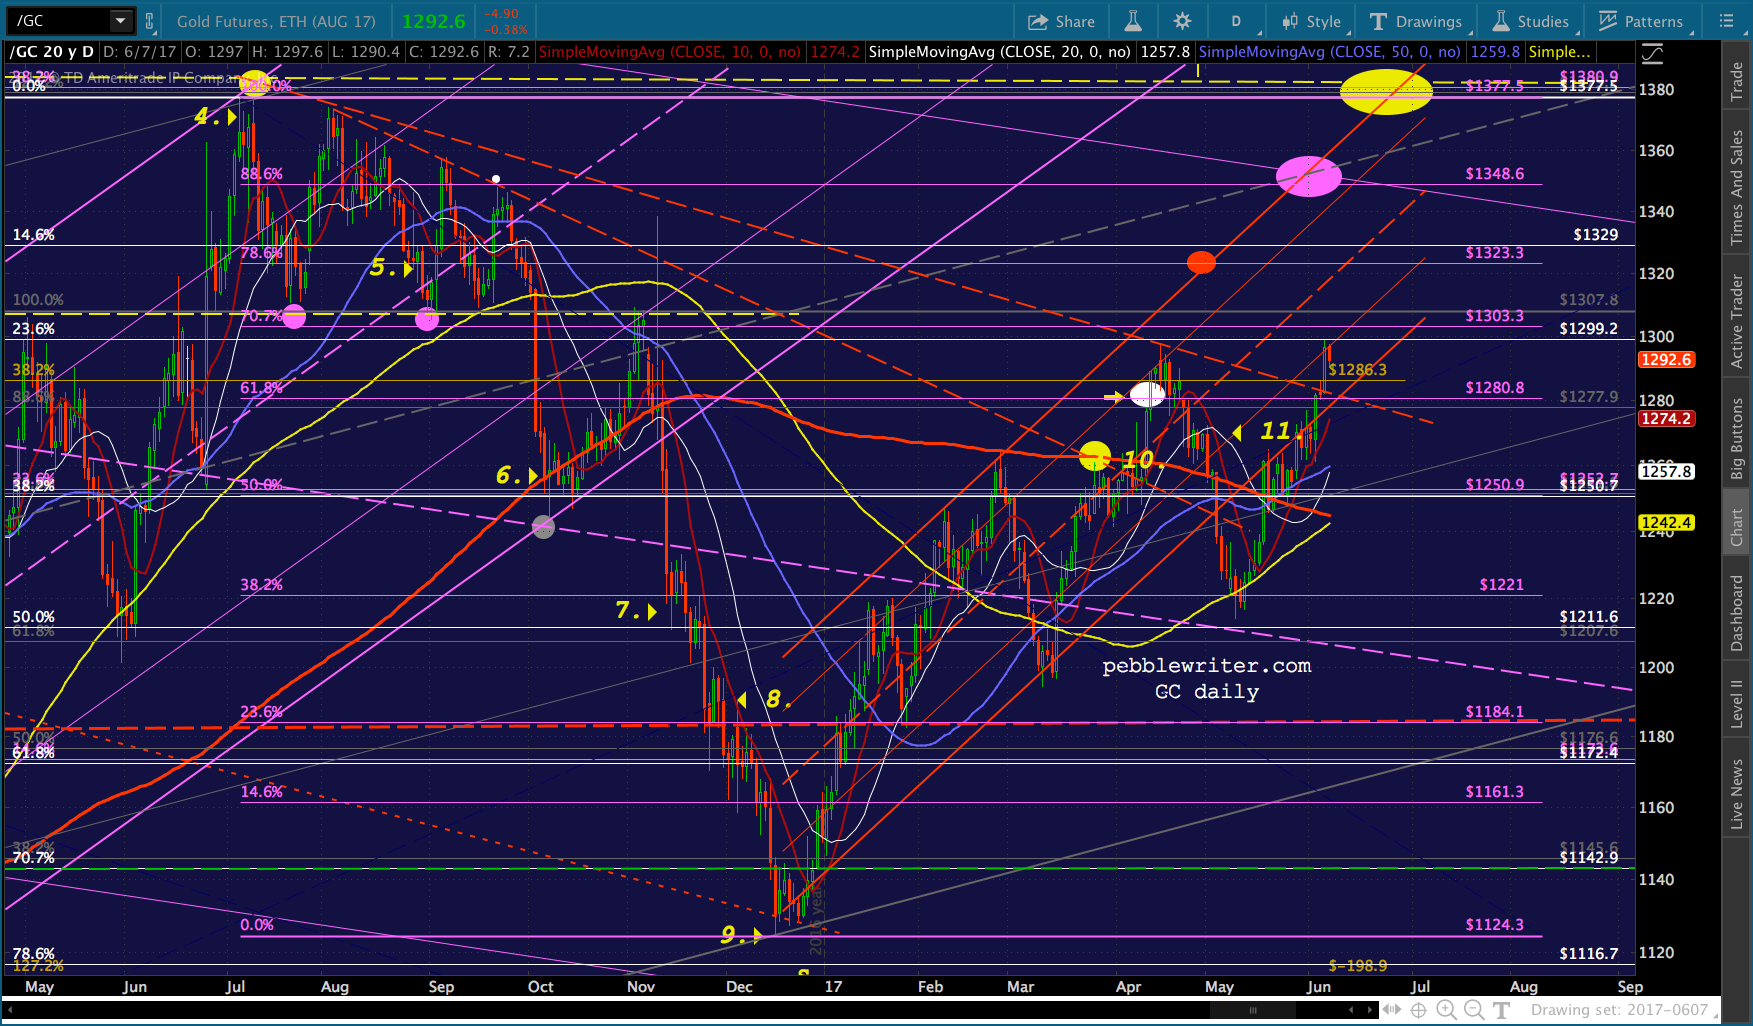 Remember, the purple target at 1348.60 is the: (1) .886 retrace of the drop from 1377 on Jul 6, 2016; (2) the .786 line of the falling purple channel; and, (3) the midline of the rising gray channel. And, the yellow target at 1377.50 is the neckline of a huge IH&S Pattern that targets 1721.
 My target for DXY has been 96.10 as early as next week (coincides with the FOMC decision.) This is also the time frame for either of the GC targets.
 If DXY falls through the midline of the purple channel then, sure, GC could complete the IH&S and keep going. But, I think it’s unlikely. I think central bankers are loath to see gold break out, just like they’re loath to see the dollar break down past a certain point.
Remember, if the dollar breaks down: the yen carry trade is kaput and inflation will spike (we import nearly everything), and interest rates will likely increase (we can’t afford that.)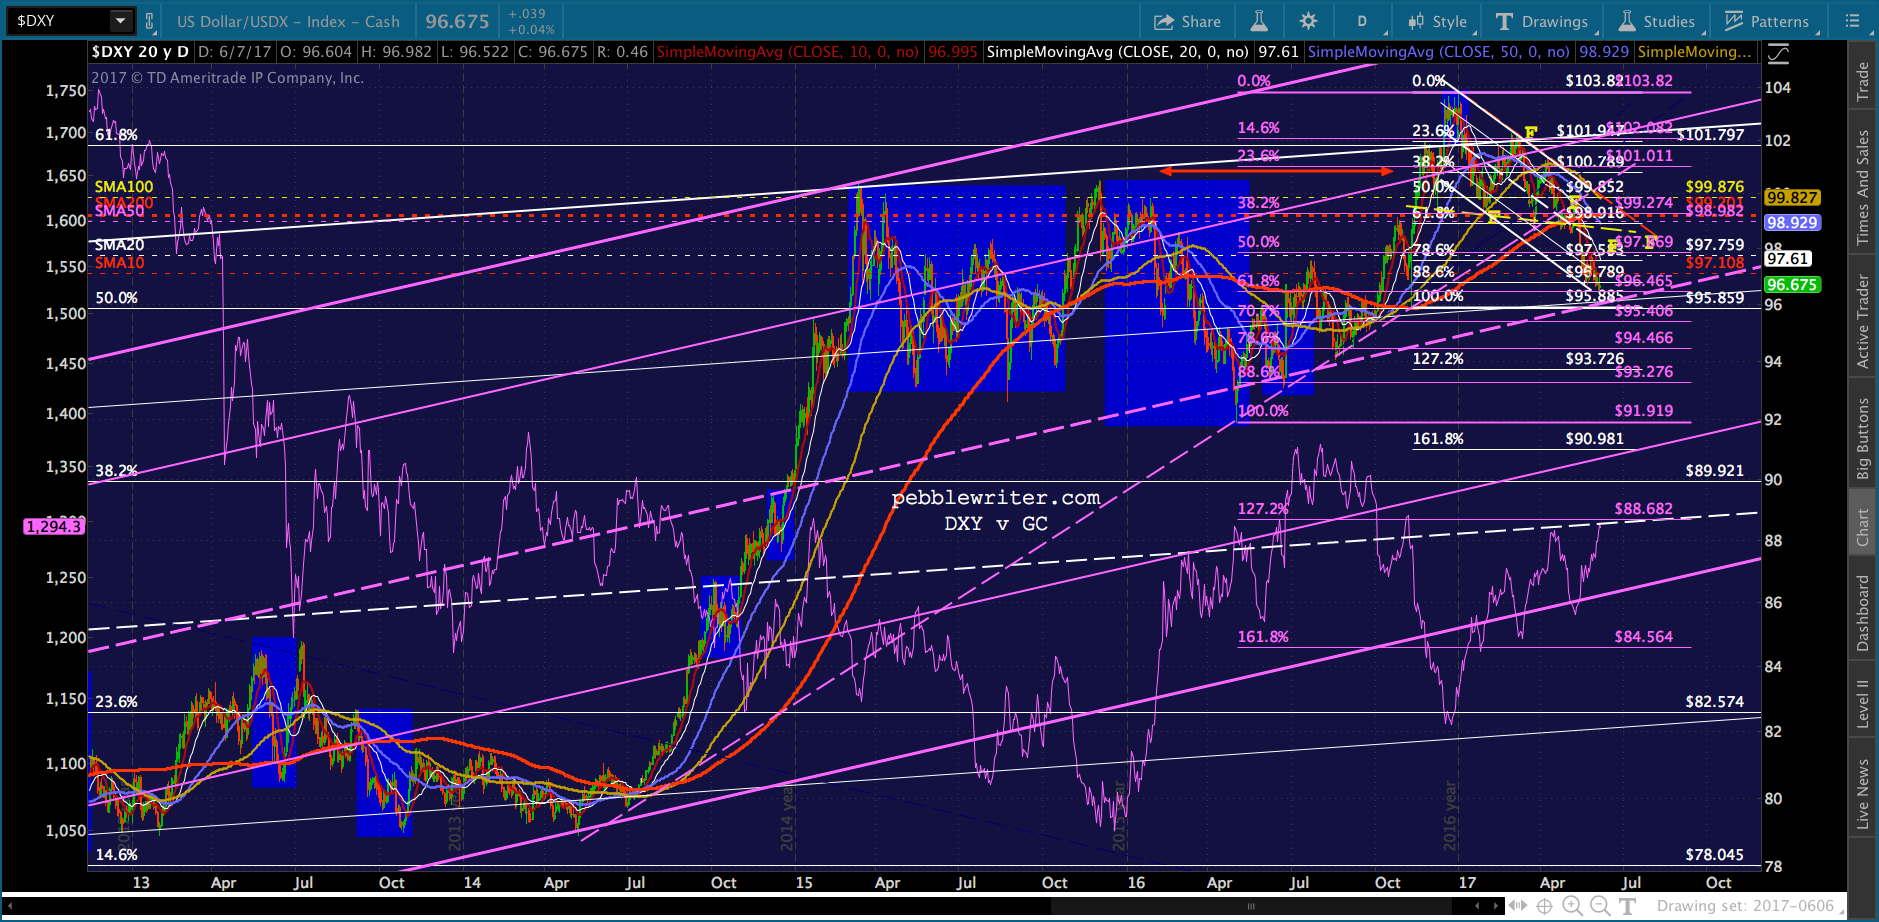 So, I believe they’ll draw a line in the sand at 1377, if not 1348 — assuming it gets past the TL from the Sep 2011 top (in yellow, currently about 1300.)
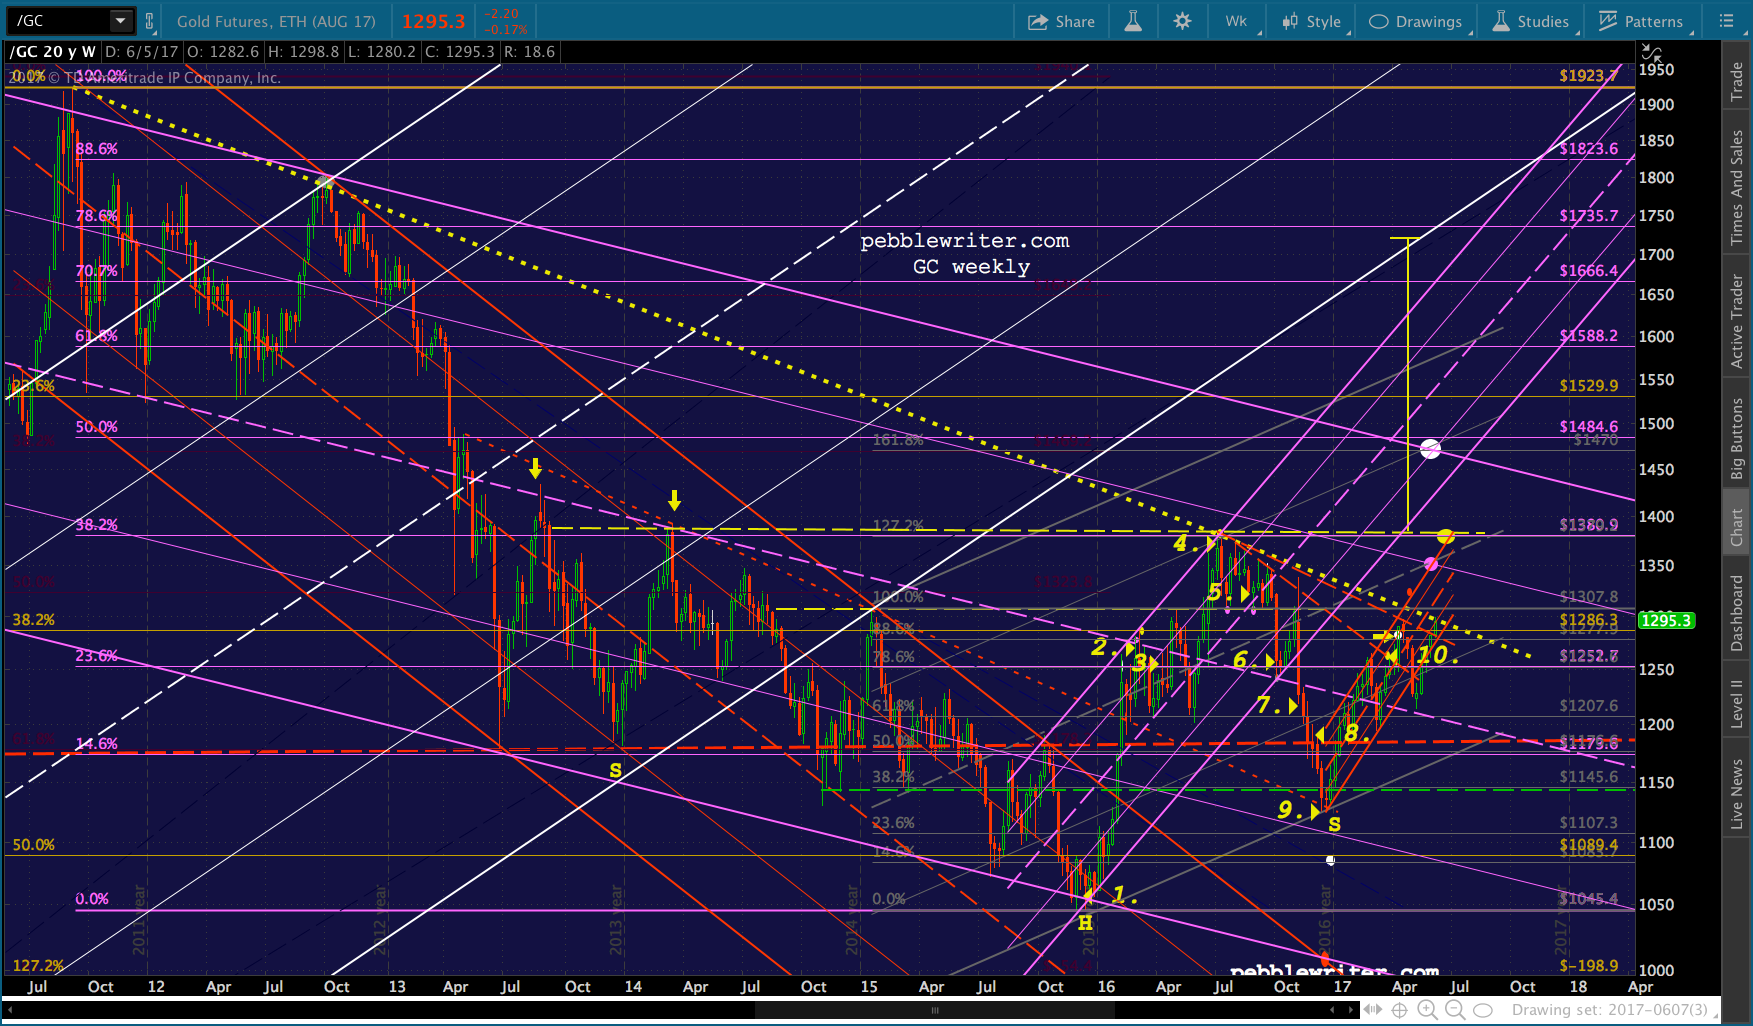 Whether or not they’ll be able to hold that line is another question. The charts certainly argue for 1721. And, IMO, there’s a great fundamental argument for it as well. What we’re really talking about is whether they can effectively cap the price at least as well going forward as they have in the past.
 Clearly, equities benefited from DX pushing above the purple channel midline (the yellow arrow) in the first place.
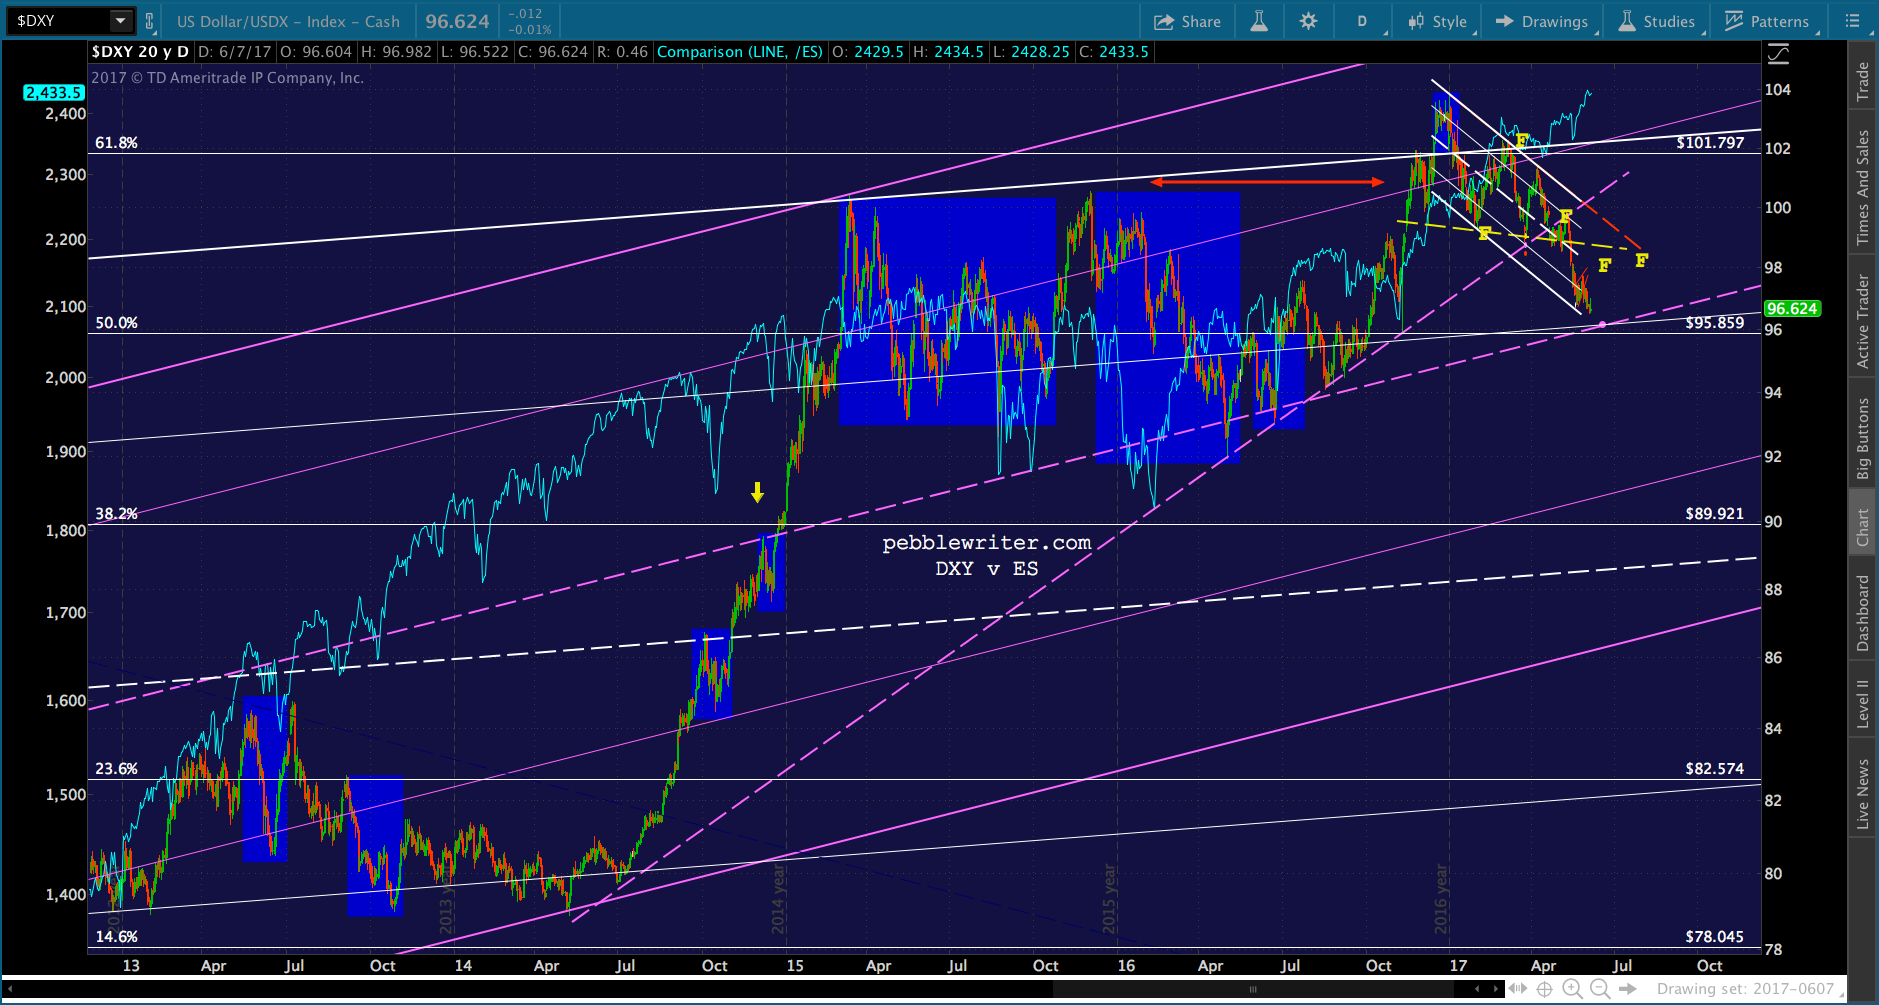 They have not fared well when GC spiked higher. Note GC’s breakouts in Oct 2008 and Jul 2011 both precipitated huge selloffs in equities.
 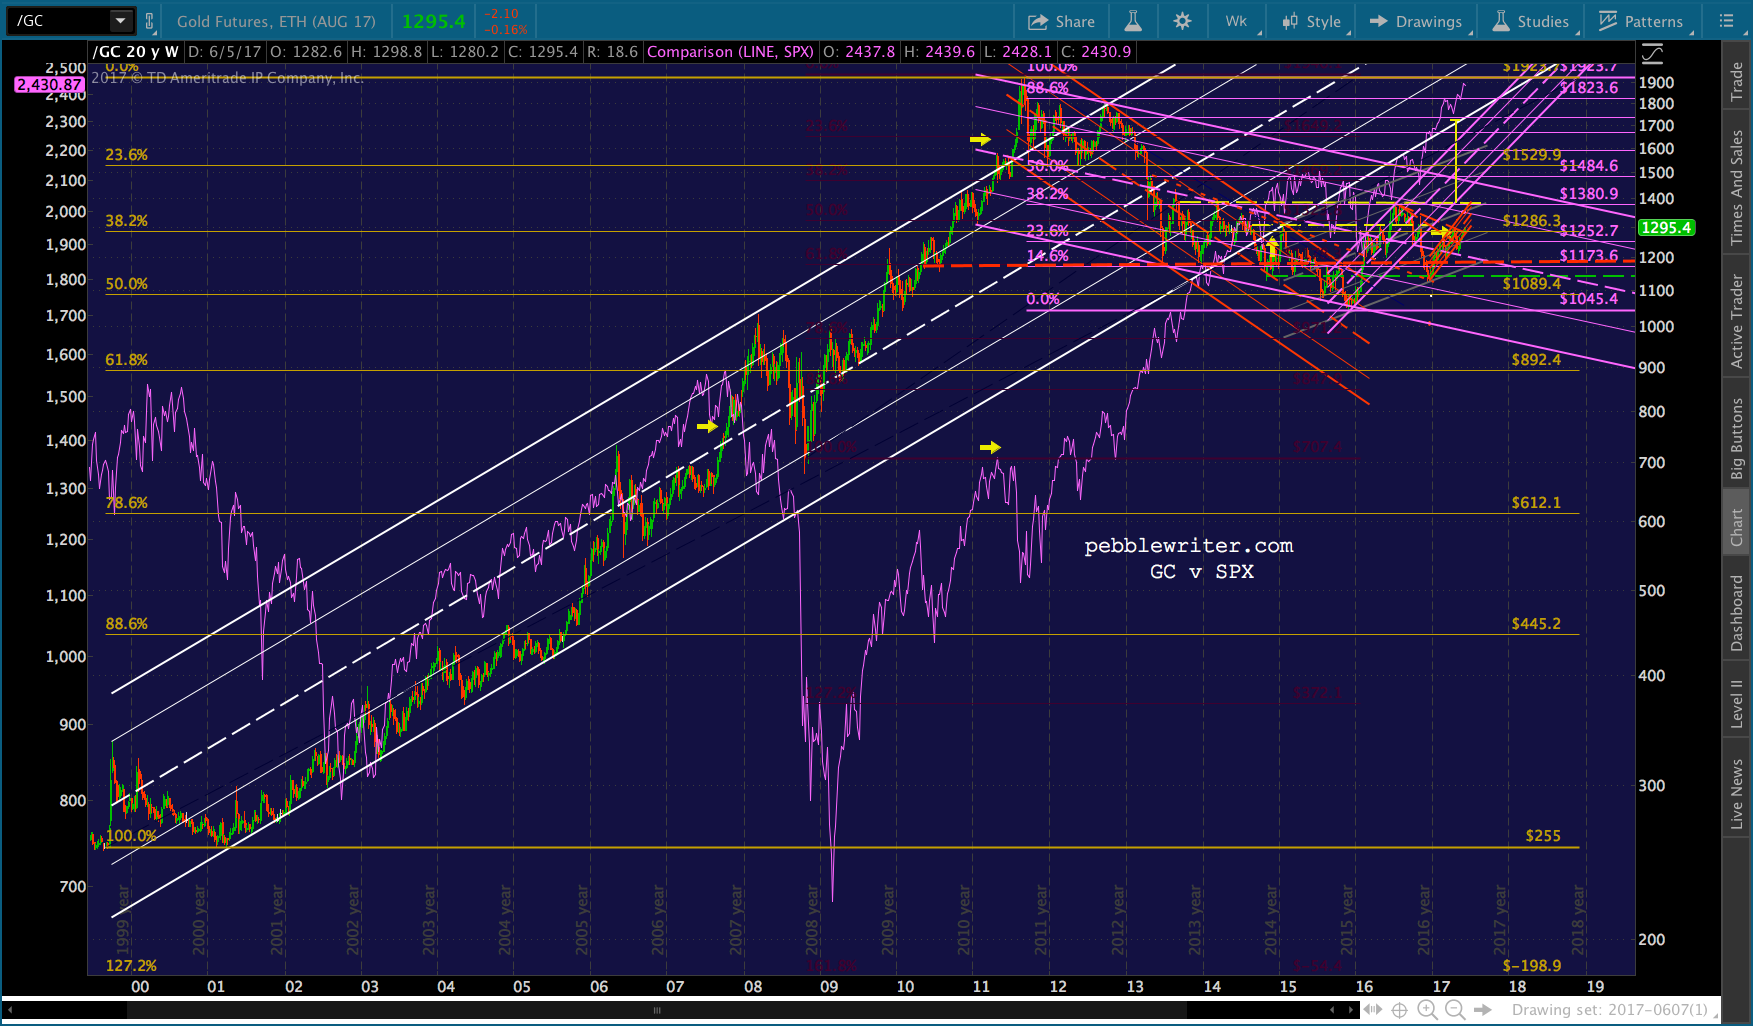 The government has been playing a game with inflation data for years, substantially understating it in order to save huge sums in cost of living increases. For the past 8 years or so, it has become even more important.
Interest rates must be kept exceptionally low, and higher inflation would make that difficult if not impossible. Since higher gold prices (supposedly) reflect higher inflation, suppressing the price of gold has been used to reinforce the low-inflation narrative.
Unfortunately for TPTB, it is becoming increasingly difficult to hide the fact that inflation is a problem and is becoming worse with every tick higher in the prices of housing and gas. Something has to give.
Stay tuned.