

Yesterday, VIX experienced its 4th biggest drop ever, plunging 25.9% from Friday’s close even though France’s election delivered the very same results that just about everyone expected.
It has dropped even more this morning, and is now off 33.3% from Friday’s highs — despite the fact that there’s the potential for war on the Korean Peninsula and the probability of a government shutdown later this week.
Is there any logic to this? What should we take away from the behaviour of the “Fear Index?”
Between 2014-2016, VIX very rarely tagged the bottom of a huge, rising channel (shown below in yellow.) When it did, this meant that fear was unusually low.
 Without fail, however, every tag on the yellow channel bottom meant that stocks were at or very near a significant top.
Things changed, however, following the US election. VIX plunged right in the middle of stock futures’ 5.7% mini-crash. This was beyond ridiculous. Selling VIX as futures are plunging is the equivalent of cancelling your homeowners policy as a tornado is ripping the roof off your house. Who would do such a thing?
 It would have to be someone with unbelievably deep pockets — someone for whom ensuring that stocks continued to march higher was more important than the many billions of dollars they might lose in the process. In other words — central banks.
In a note on Apr 21, Merrill Lynch reported that central banks have already “invested” over $1 trillion YTD — an amount on track to top 2008’s $2.8 trillion by 25% and more than double last year’s $1.7 trillion.
Some central banks, like the BoJ and SNB, invest directly in equities in order to manipulate stock prices higher. It’s more effective than big, clumsy measures like QE. Over the years, however, they’ve discovered they can get more bang for their buck by using more refined measures like the yen carry trade, oil futures and VIX to drive algorithms.
Simply put, algorithms look to a variety of indicators to tell them when to buy and sell stocks. If oil spikes higher, stocks will too. If USDJPY rallies, you can bet that stocks will be close on its heels. And, if VIX sheds 25% in a day, well…we’ve seen what happens, haven’t we?
Machine trading is gradually replacing real, live people — traders in pits who might look up, scratch their heads and ask “wait a second, does that make any sense!?” Just a few weeks ago BlackRock, the world’s largest investment manager with $5 trillion under management, announced it was laying off human traders and increasing its emphasis on machine trading.
When VIX drops, algos don’t ask why. They simply read it as a reduction in risk and trigger buy orders. However, as VIX approaches long-term support such as the huge, yellow channel, algos know that the rally is almost over. At least, that’s what they used to think.
In its last “normal” tag, on Aug 9, 2016, VIX correctly signaled a drop in ES that extended to 163 points at its election night lows. But, as mentioned above, VIX was hammered that night and, by mid-November, had broken down through channel support (the white arrow) in order to produce new all-time highs in stocks.
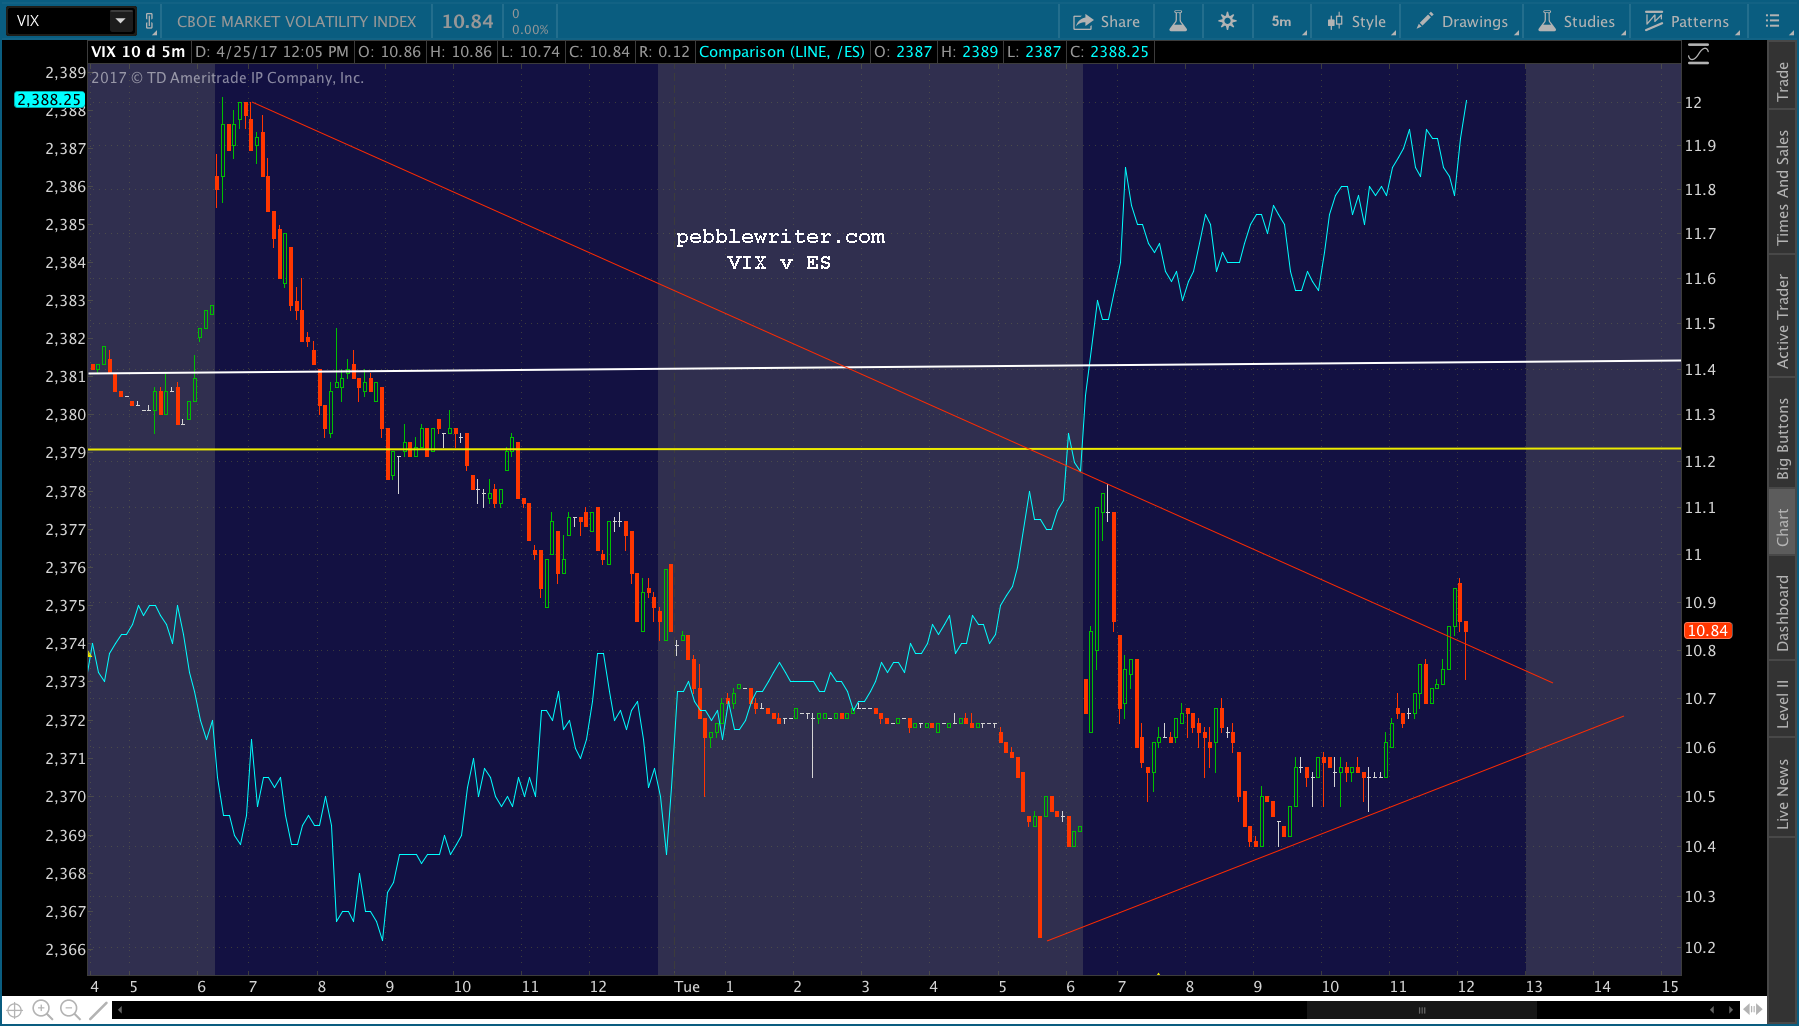
The next time VIX tagged the yellow channel line, on Dec 21, it produced a very modest 34-pt drop in ES. Were the algos learning? Was VIX signalling a fundamental change in the level of risk in the markets? Since Dec 21, VIX has dipped below the yellow channel bottom 27 times — an astounding one out of every four sessions. More importantly, the dips always come at crucial moments, when ES and SPX are in danger of breaking trend (thin purple lines below) or need a boost to get up over resistance.
The latest example, of course, is this week. ES and SPX have both been locked in a falling channel since their all-time highs on Mar 1. Yesterday, based largely on VIX’s historic plunge, futures broke out of that channel and are threatening to make new, all-time highs. Improbably, this has occurred during a week of highly elevated geopolitical and macroeconomic risks.
At 10.22 this morning, VIX almost reached the Feb 1 lows of 9.97 (the day it plunged 23% to convince algos that the Fed’s rate increase was no big deal.) The last time VIX was this low was in Feb 2007, just months before the S&P 500 peaked and crashed 58%. I’m not suggesting that a crash is imminent. But, I think it’s important to realize that the “market” is broken, and that its gains (e.g. the “Trump Rally“) possess all the integrity of a campaign promise.
There was a time when VIX was a great indicator of fear in the markets. Now, it’s just another tool with which to drive stocks higher. Put simply, the tail is wagging the dog. And, the people doing the tail-wagging are not only determined, they have access to an unlimited amount of free money.
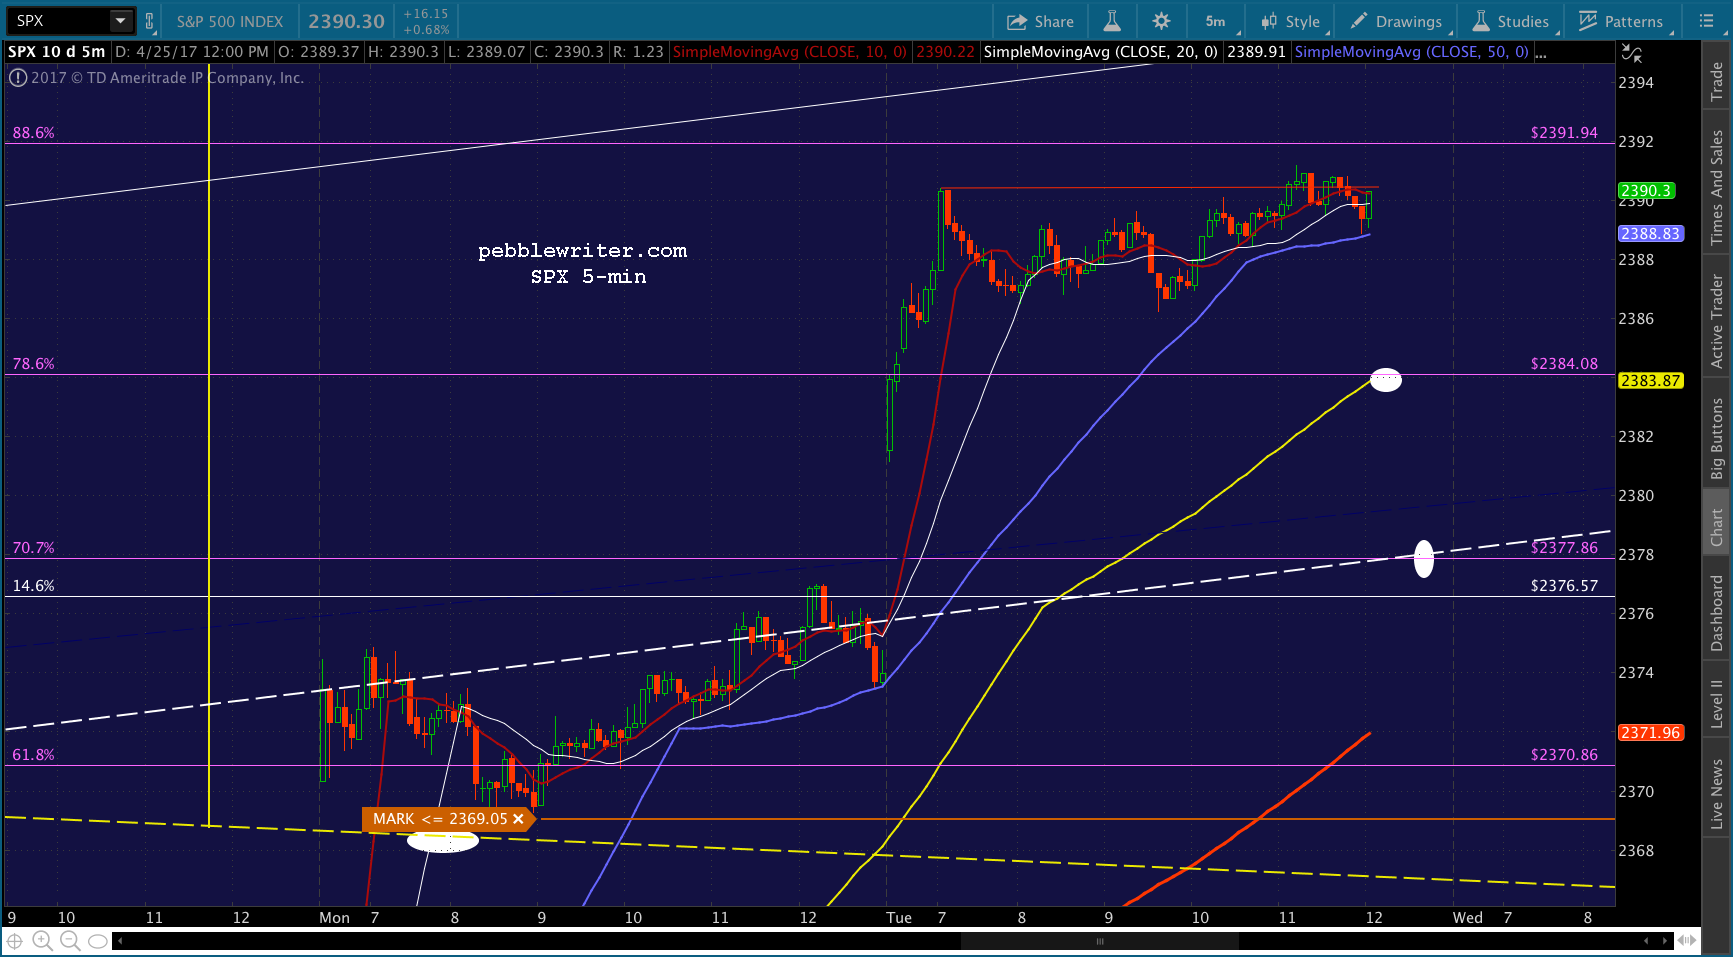
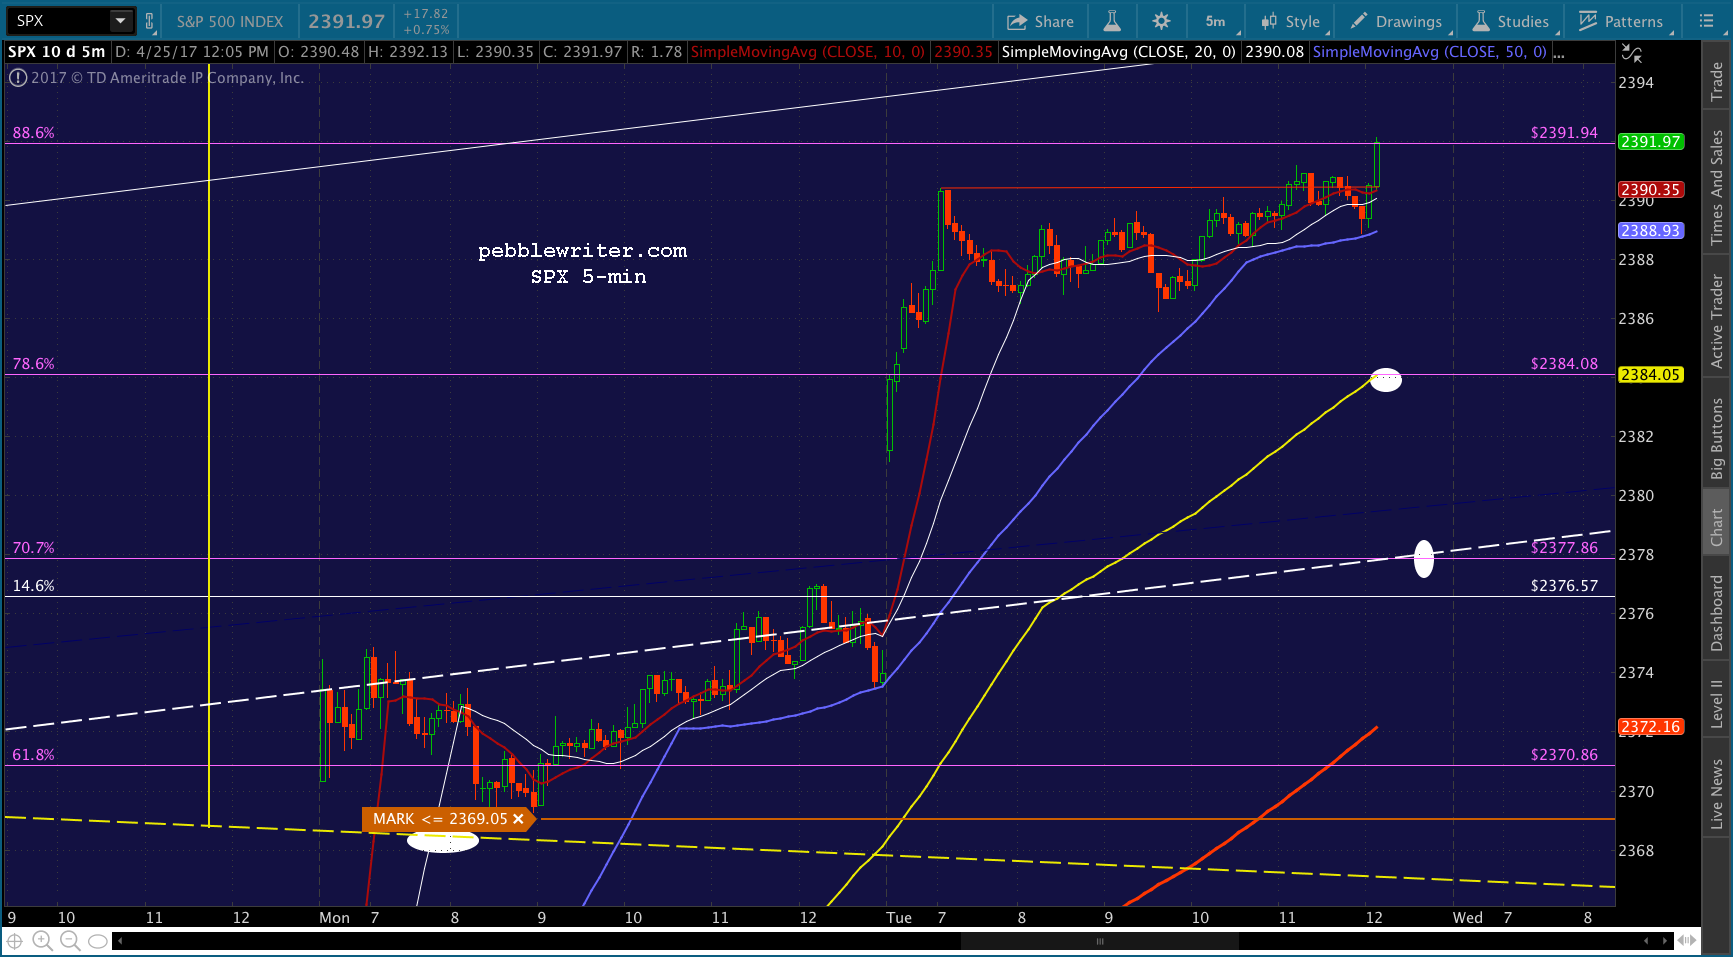
Now, on to today’s forecast. SPX backtested to within .79 of our target at the yellow neckline yesterday before deciding that appearances aren’t all that important.
continued for members...
UPDATE: 11:10 AM
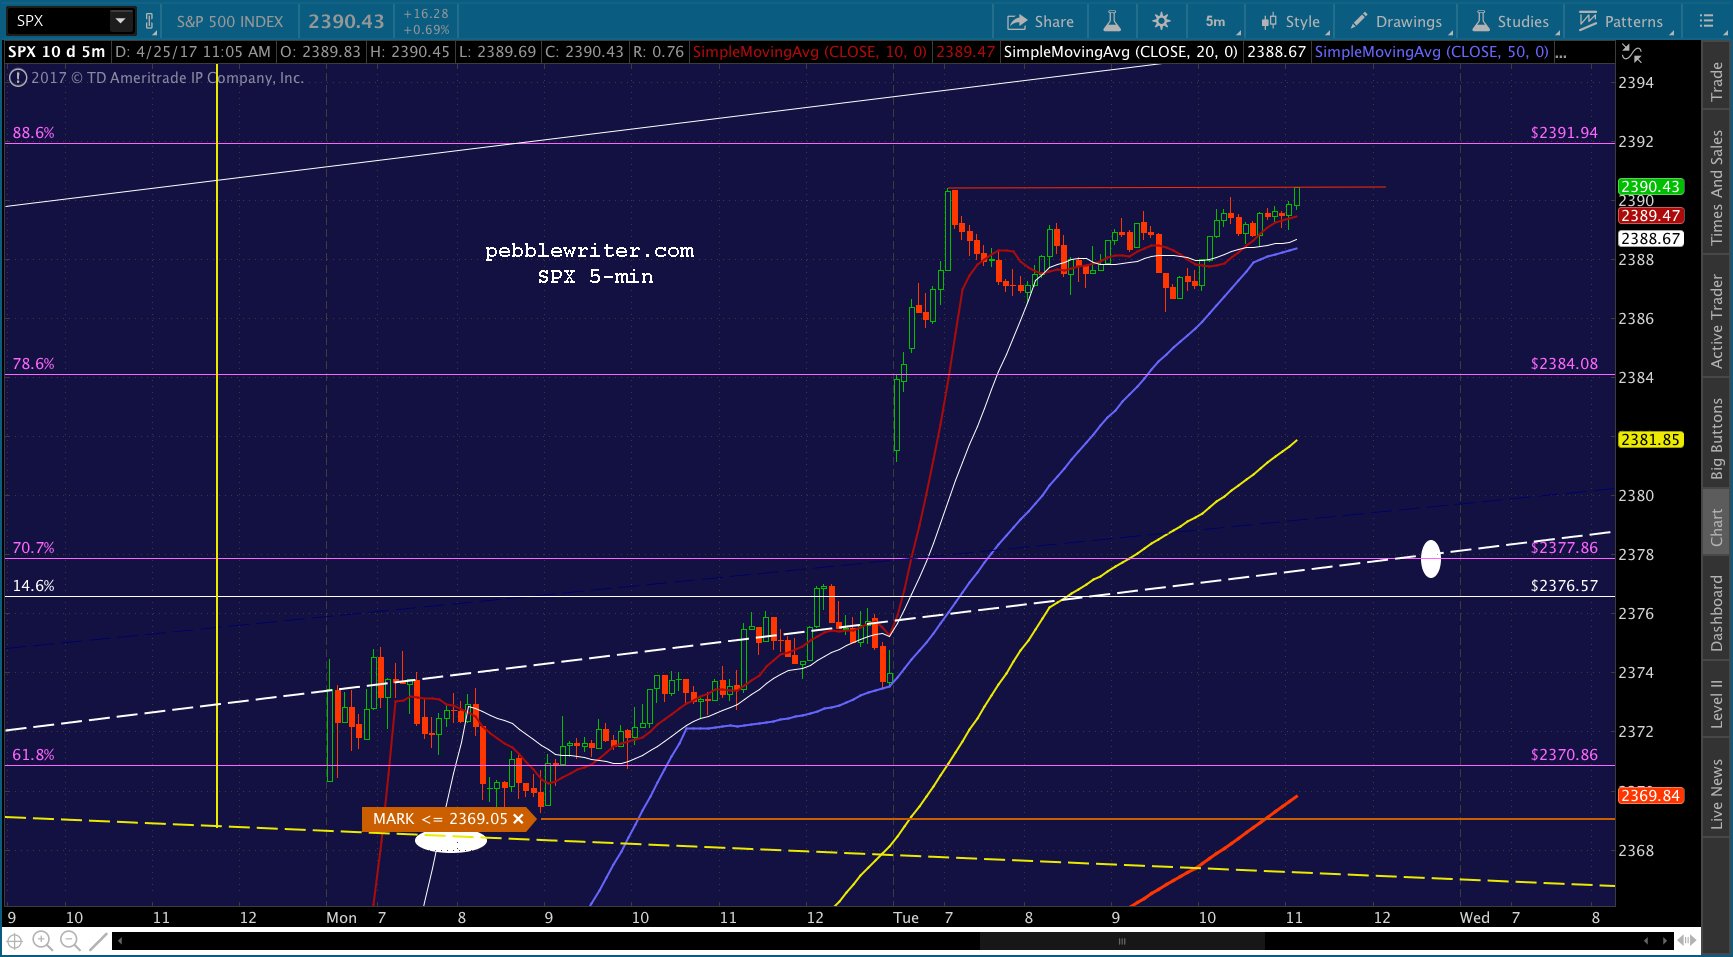
SPX has now popped through our next upside target at 2384 and has nearly reached the purple .886 retracement of the drop from its all-time highs.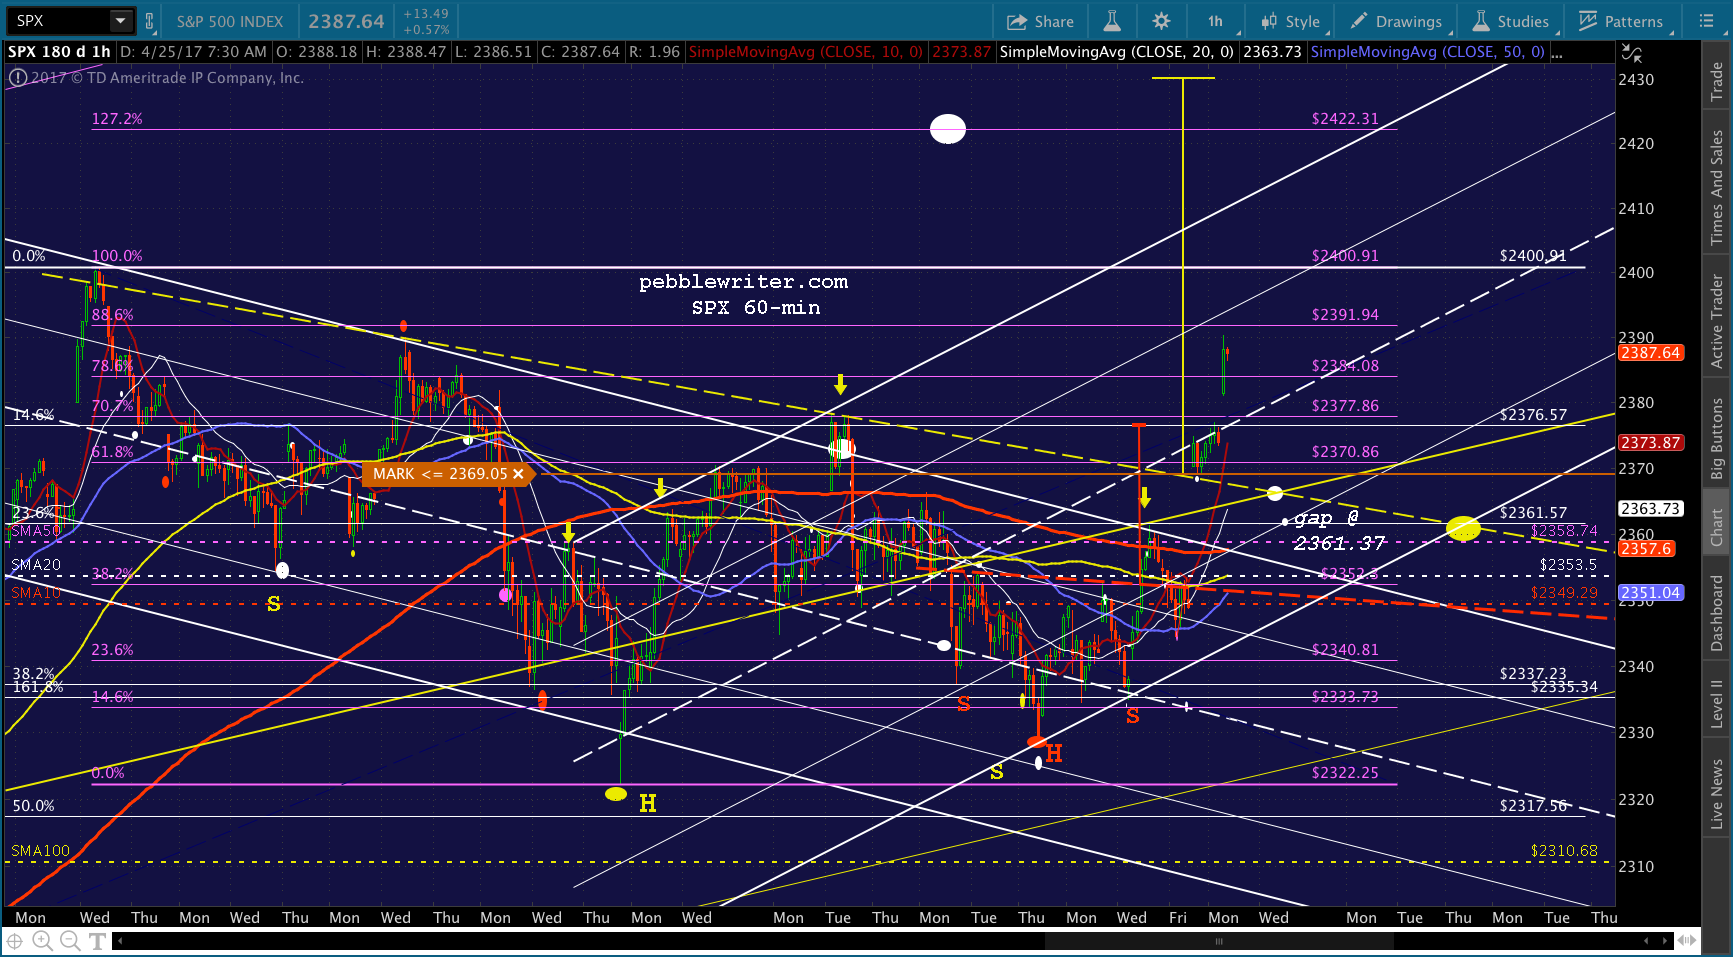 While VIX is clearly a huge factor in the rally…
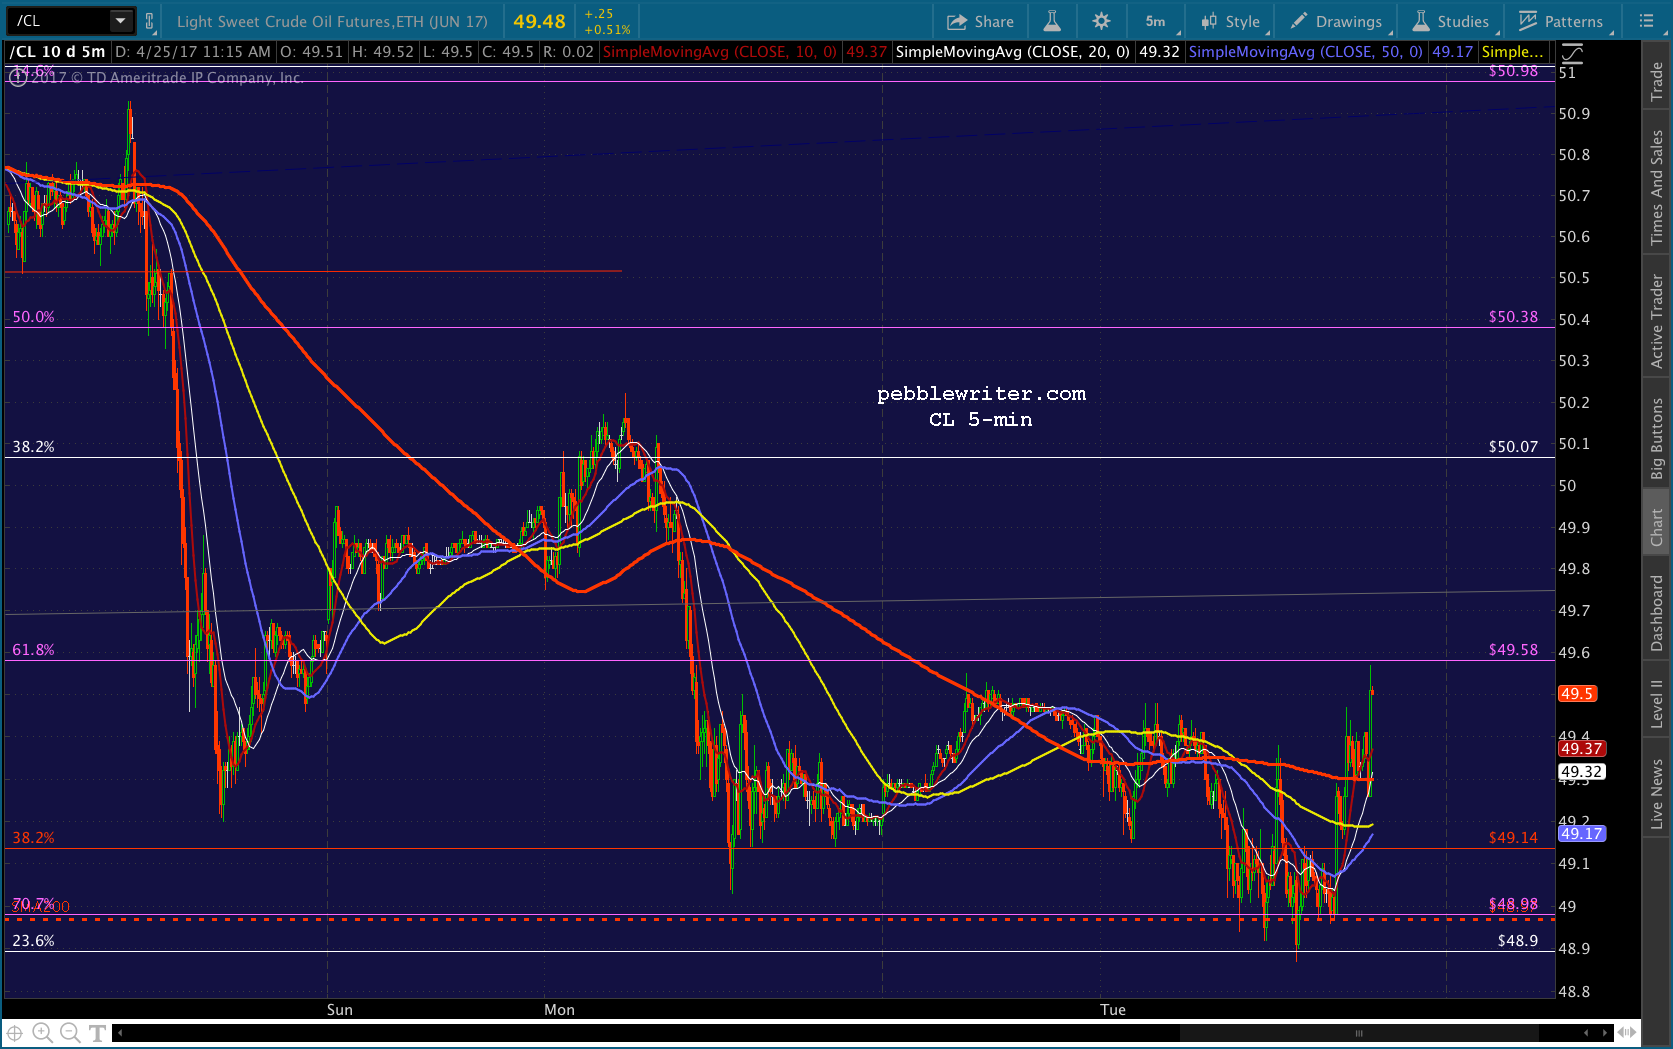
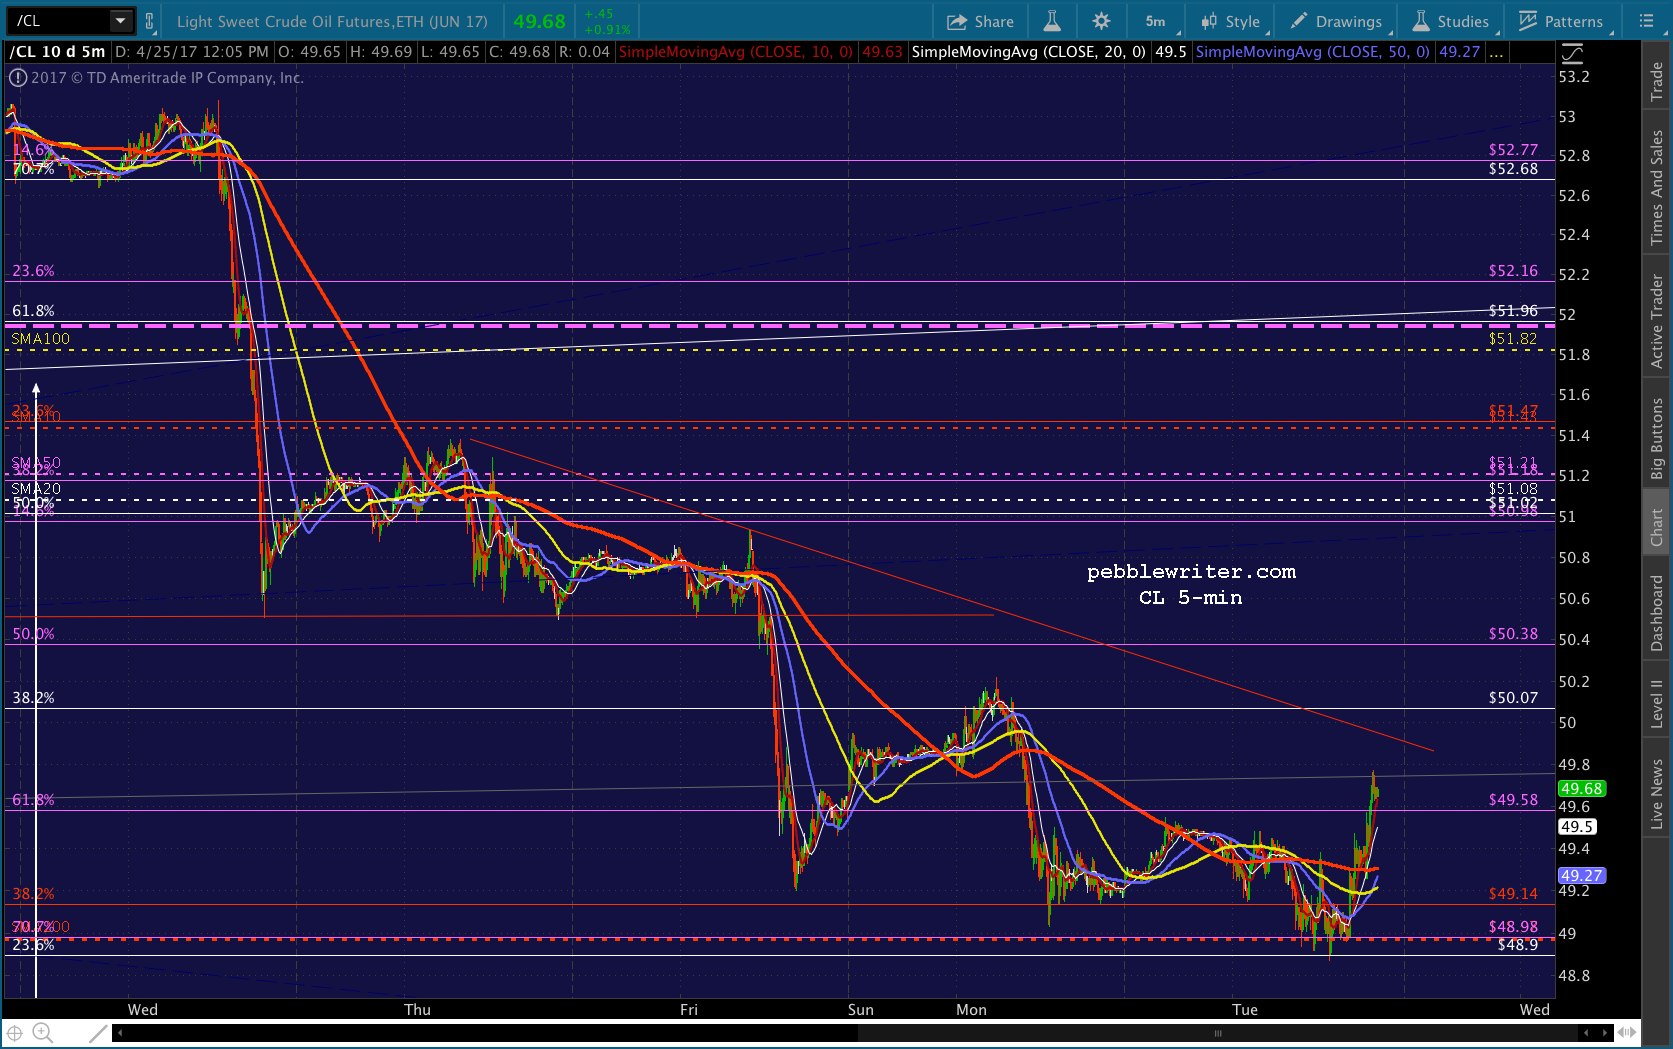
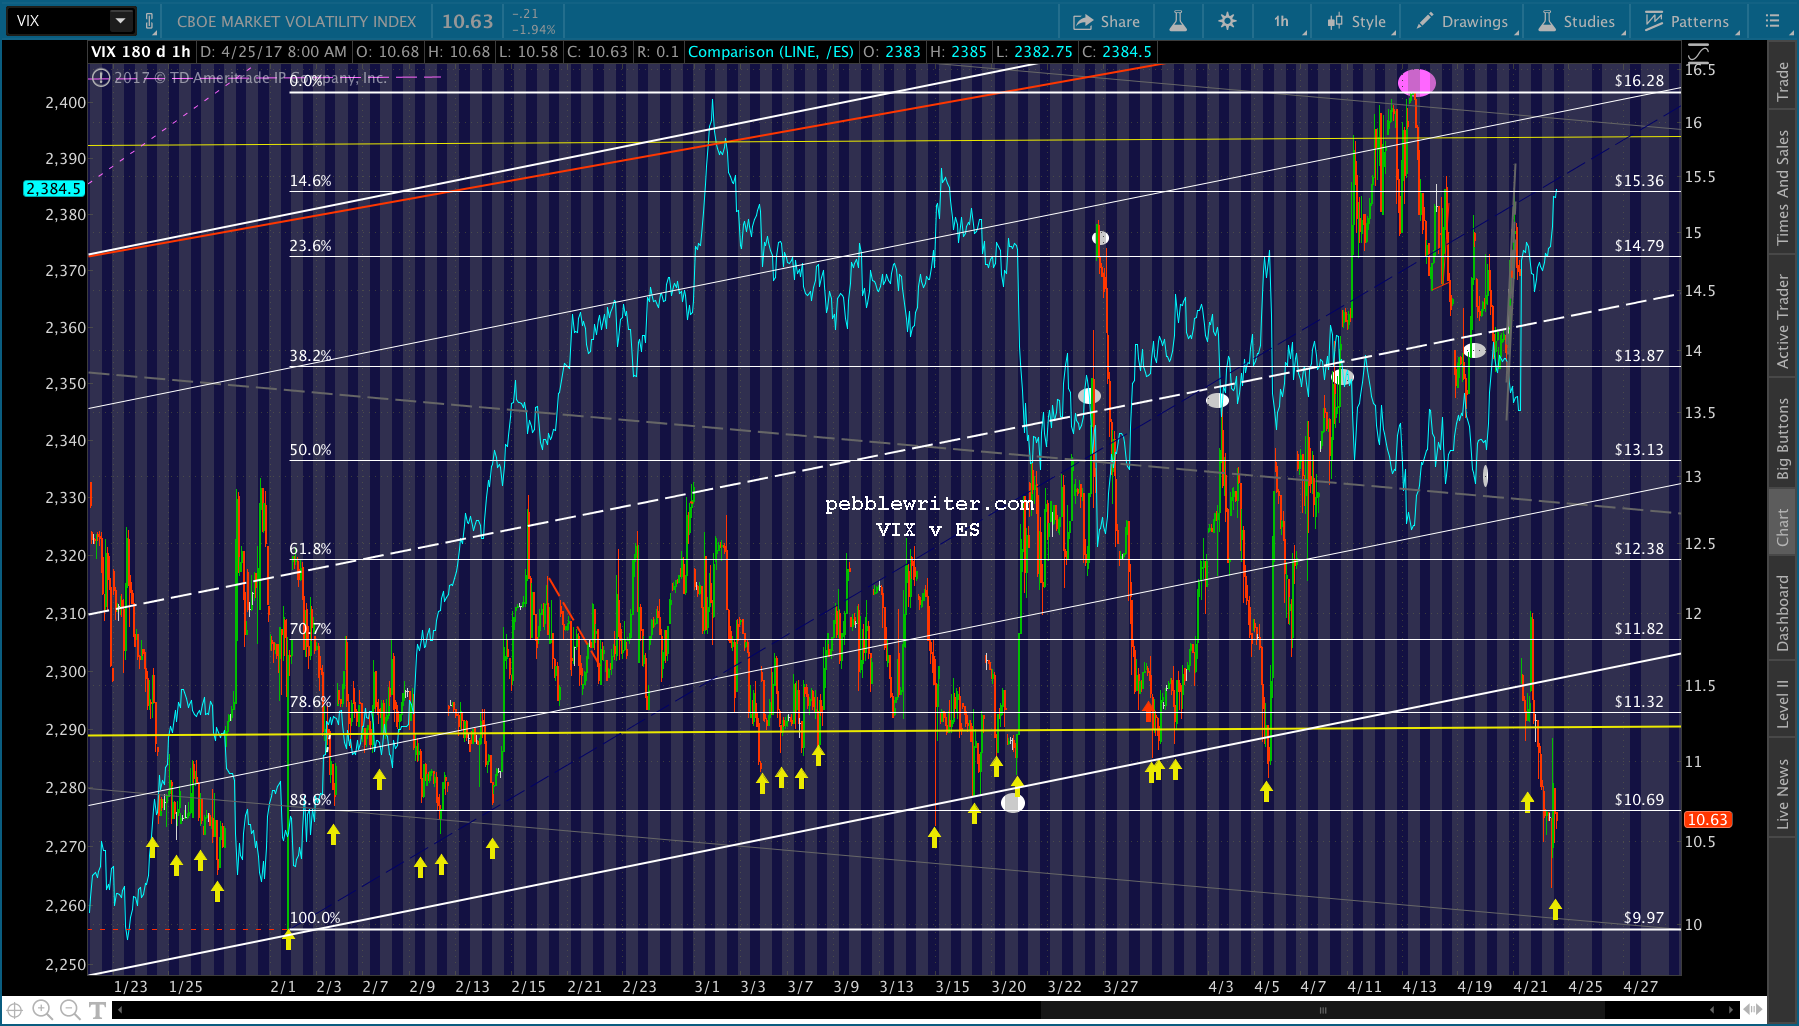 …it’s important to note that CL has reached its SMA200 and is very close to bottoming out.
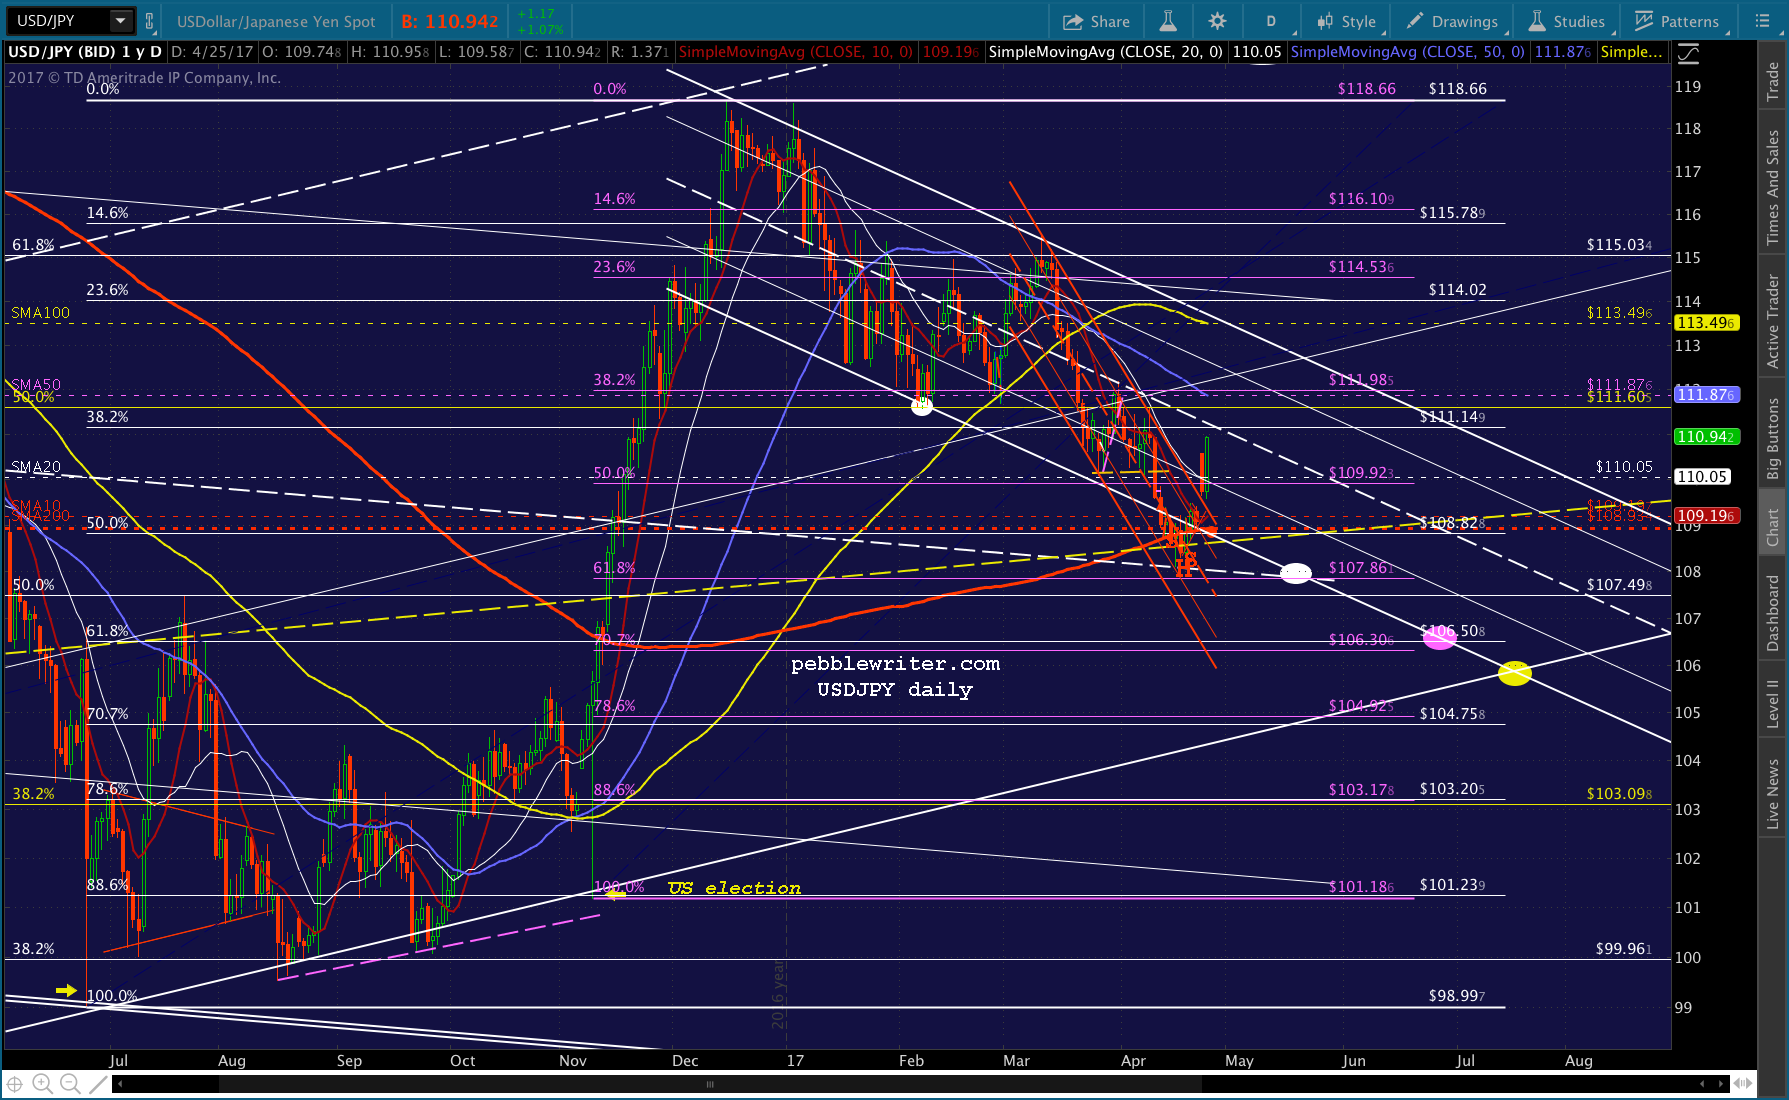
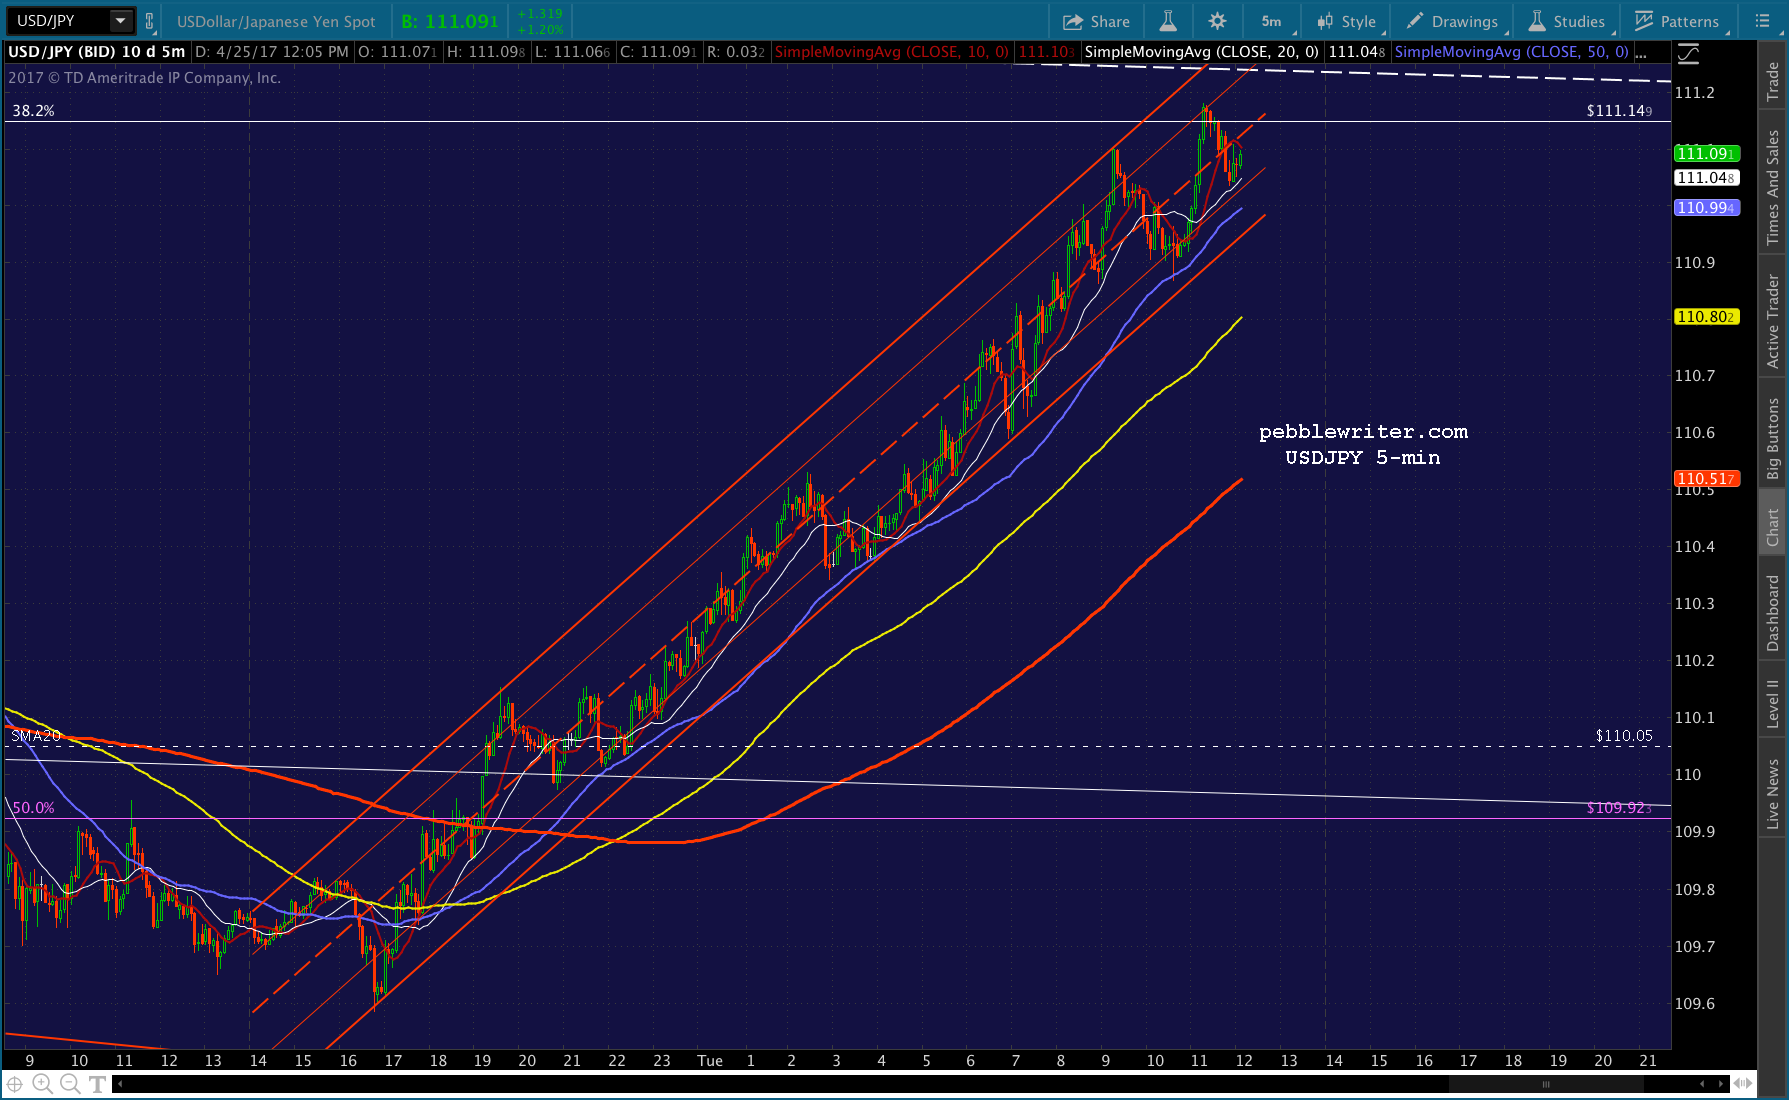
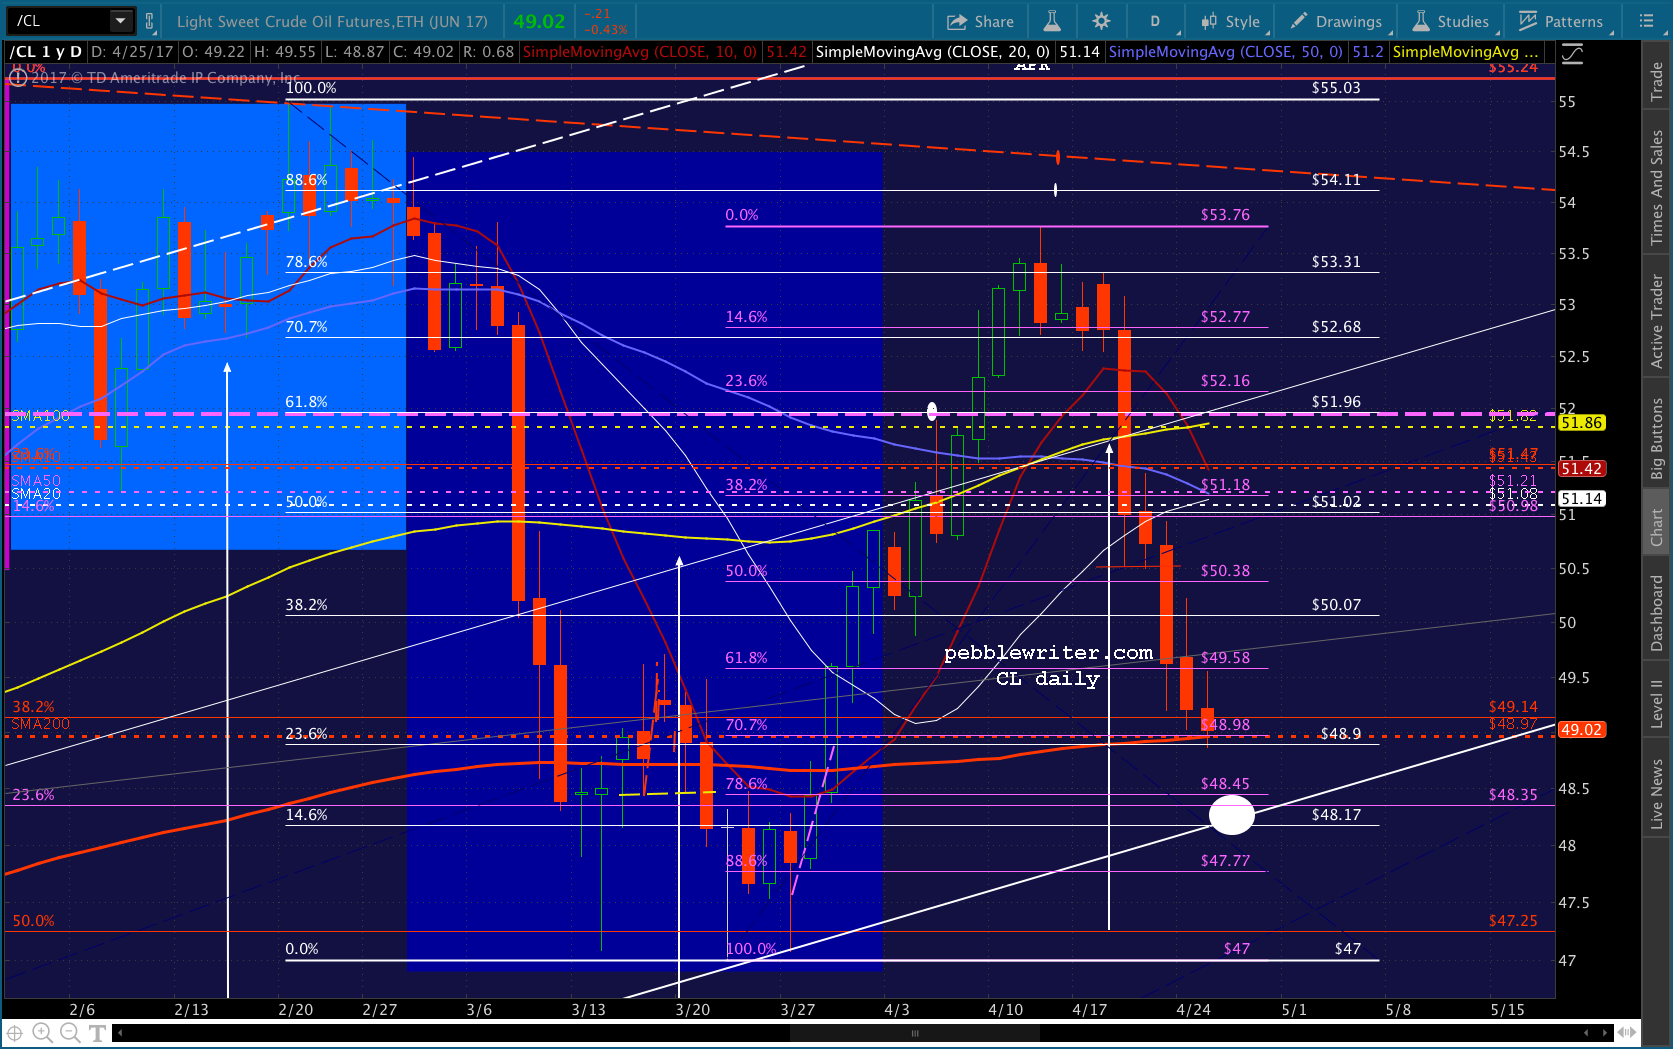 And, USDJPY’s breakout continues to play out.
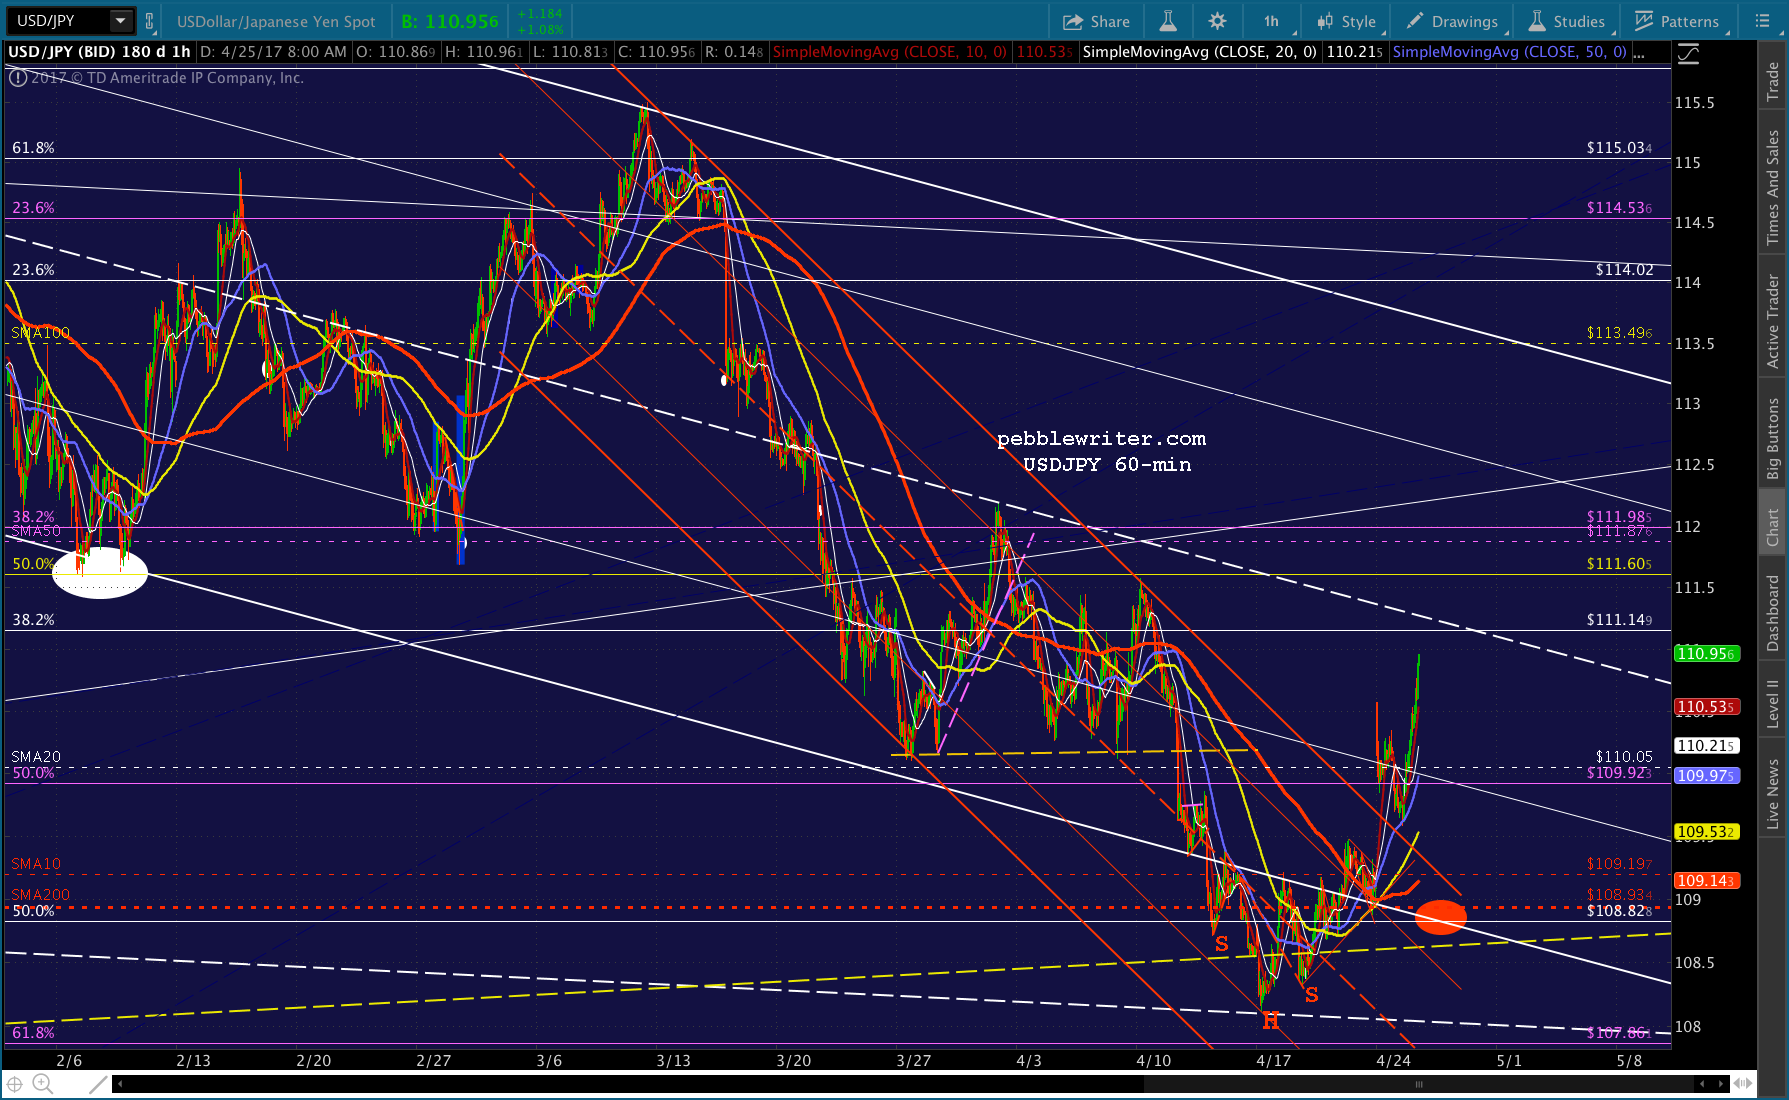
 Although it would make sense for CL to continue down to its white channel bottom at 48.17, it would always bounce here at the SMA200 for a few days and wait until May 2 to tag the purple .786 at 48.45. This would obviously support stocks through the end of the week/month.
Likewise for USDJPY, which has the white channel midline at 111.27 and the SMA50 at 111.87, but no real resistance until the white channel top at 113.50 (also the SMA100.)
This being the end of the month, we can assume TPTB will want to keep SPX on the rise for the next few days, and will also want as much of a buffer as possible in case things go south with Korea and/or the budget impasse.
This raises the questions, then, of whether we’ll get another retracement before making new highs and, if so, when and where.
We had a significant pullback at the purple .618 which could have set up a rally up to the 1.272 and, ultimately, the 1.618. As that rally was unfolding, SPX ran out of juice at the .707. This Fib isn’t terribly reliable. It’s too high for a Crab Pattern (which should reverse at the .618 or lower) and not quite high enough for a Butterfly Pattern (the .786.)
As it turned out, the reversal at the .707 was much bigger than the one at the .618. So, like it or not, that’s our Point B. What does this portend for a reversal at the .886 or just shy of it?
The strategy of leapfrogging important Fib levels has worked pretty well for them so far. There’s a very good chance that they’ll continue to do so — holding SPX where it is through the rest of the session and popping above 2391.94 overnight.
If, instead, SPX drops through its SMA5 20 between now and then, by all means play along. But, I’d be very hesitant to hold short overnight. I’d view it more as a scalping opportunity, with the real shorting opportunity to come over the weekend. Of course, that’s also the point of greatest risk to shorters. But, what else is new?
UPDATE: 12:12 PM
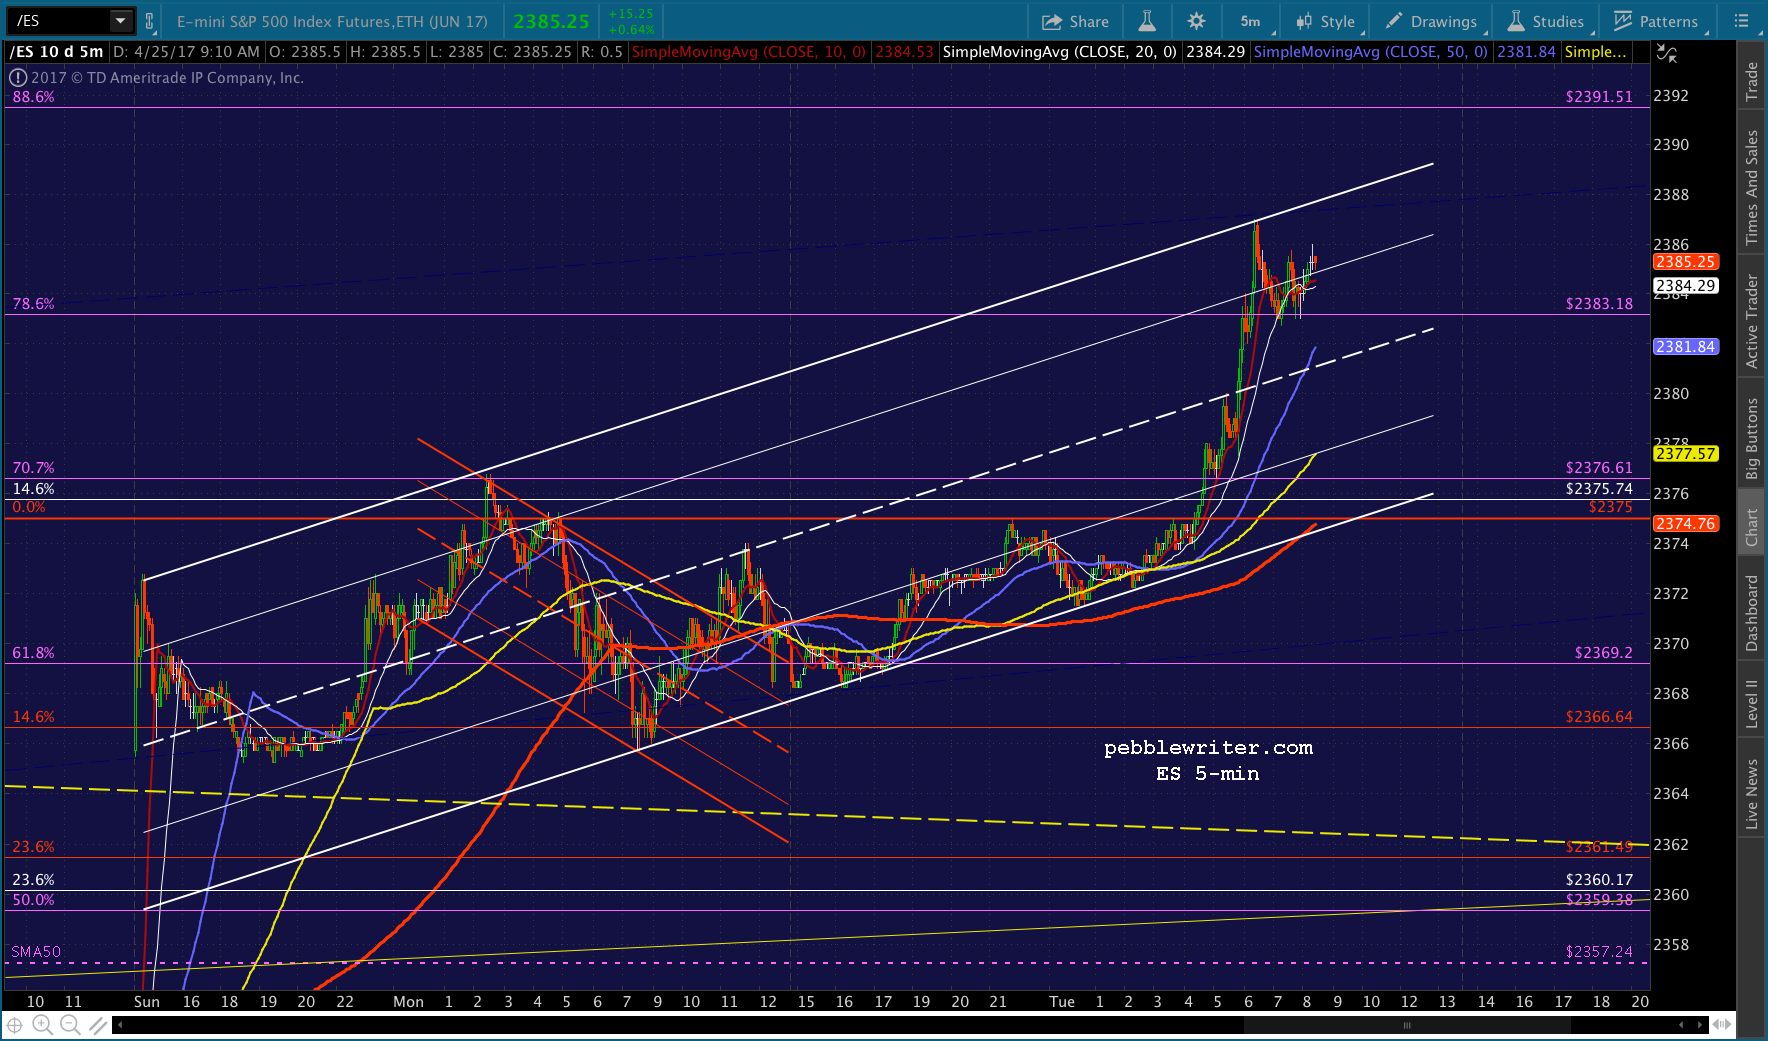
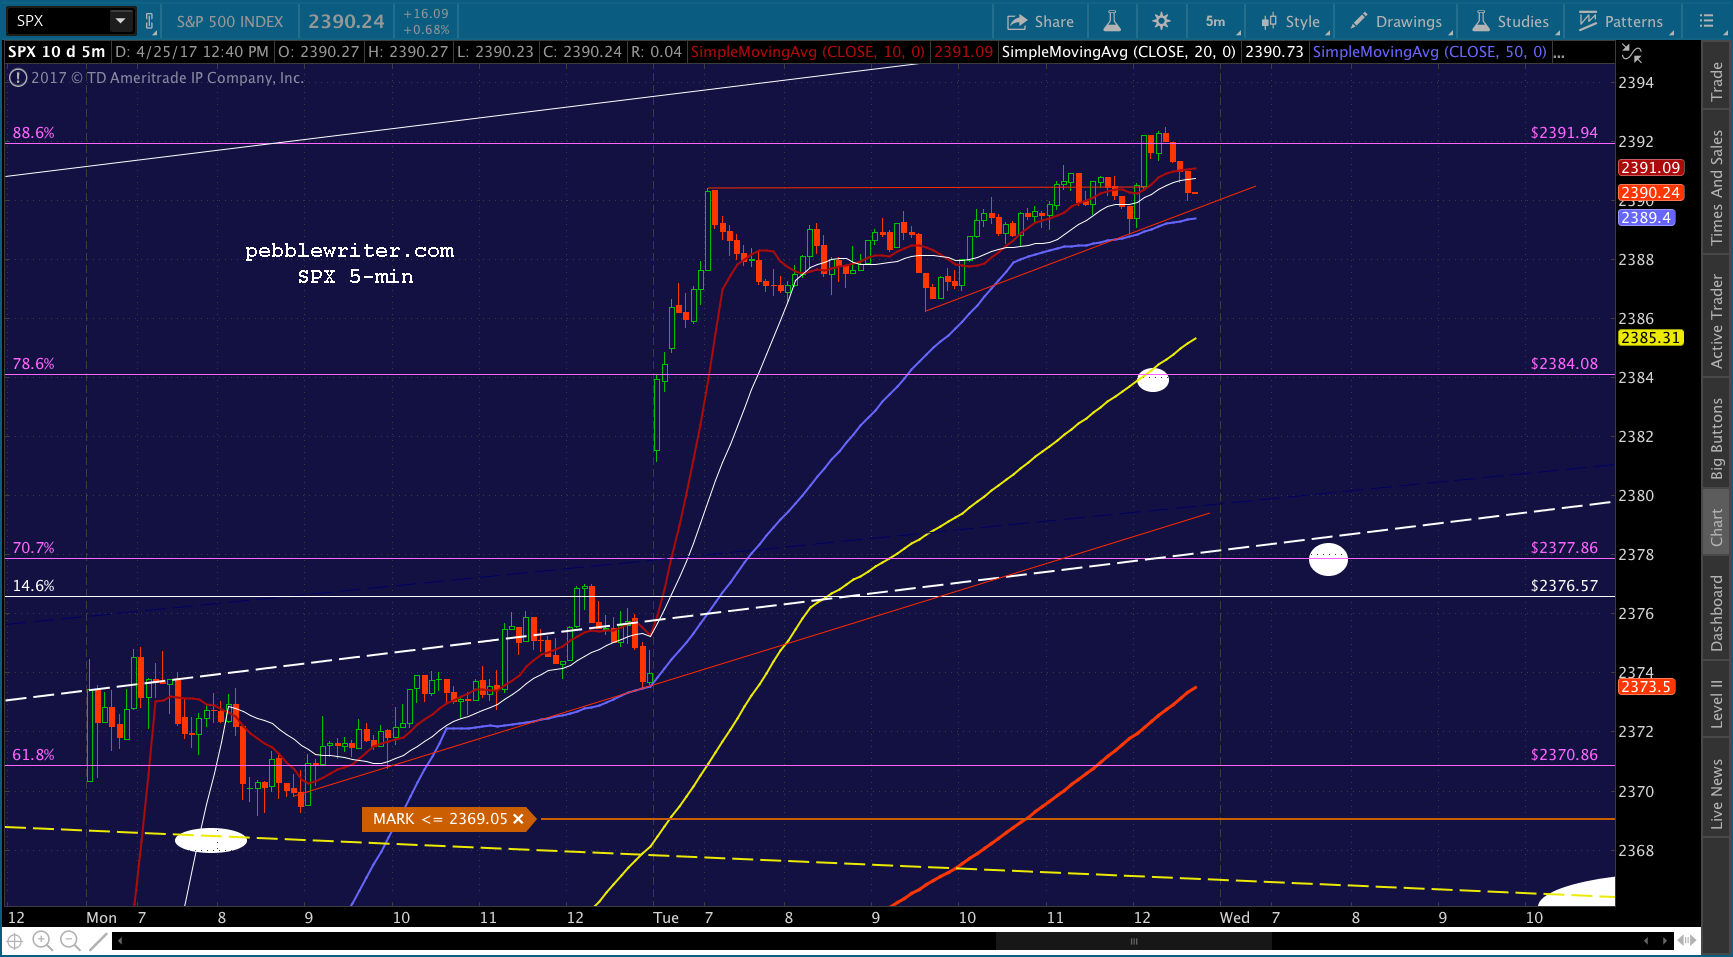
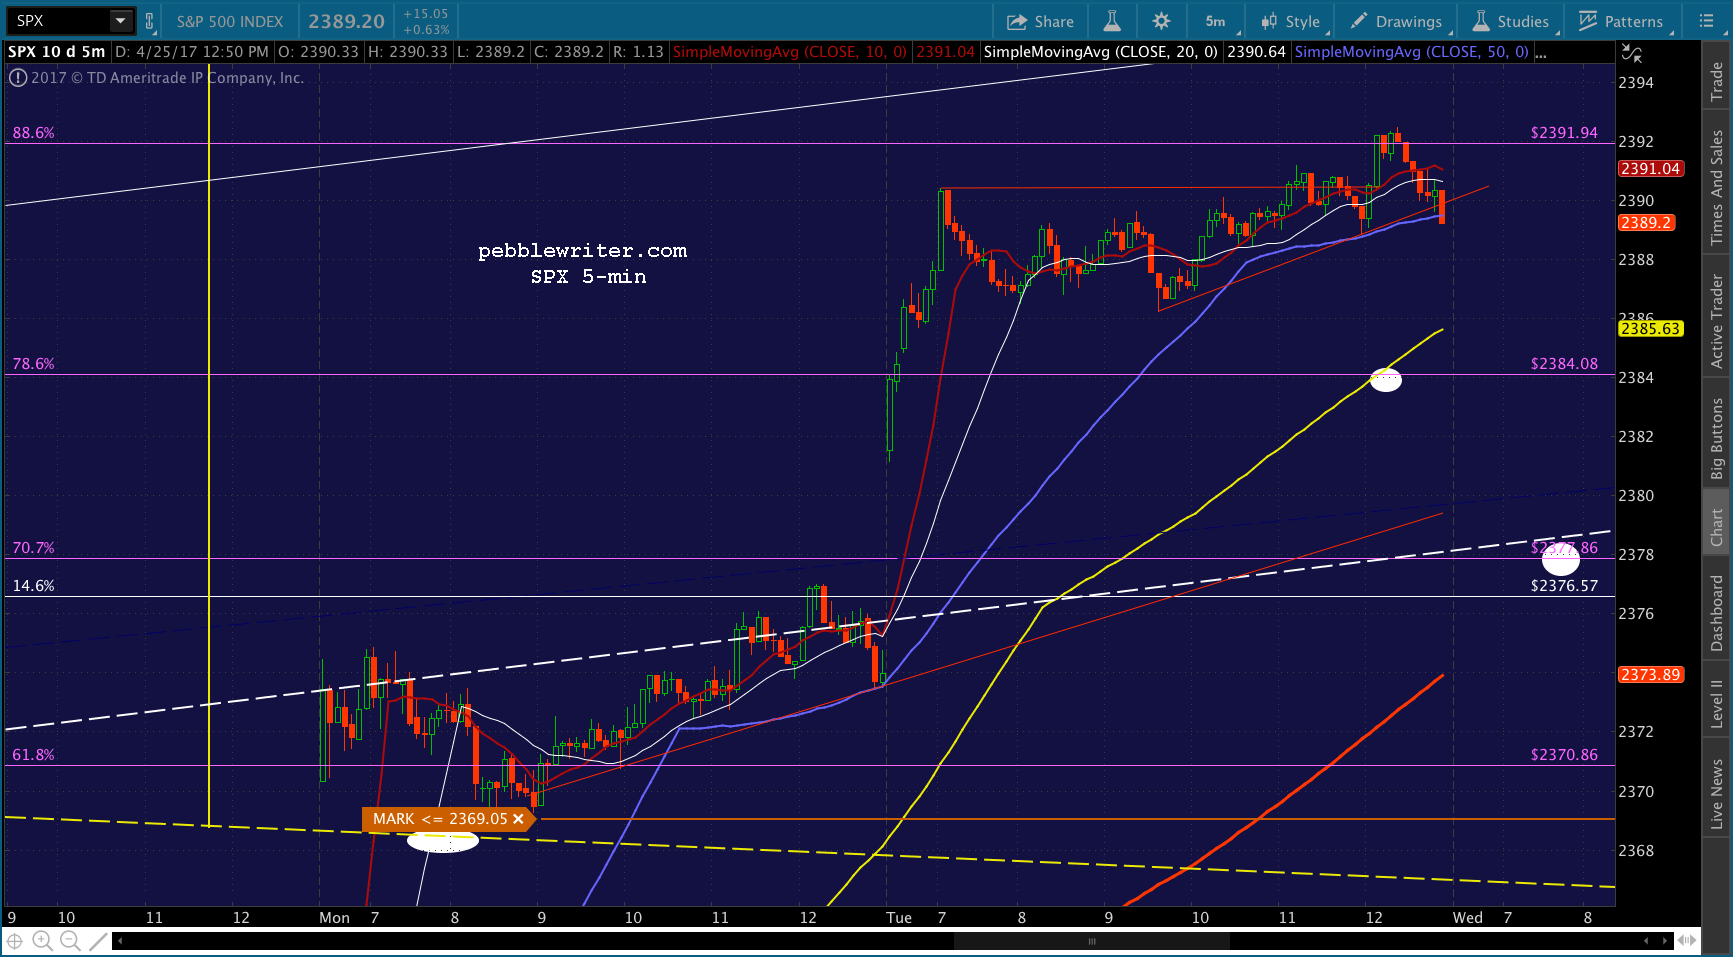
SPX continues to slip sideways, but ES has reaches the top of a pretty well-defined channel. For traders playing along on the long side, I’d exit the trade if SPX drops through its SMA5 10/20 at 2387.88. For scalpers and very nimble traders, there would then be an opportunity to short to the .786 at 2384. But, again, this is only if SPX and ES break down below their SMA5 10/20s.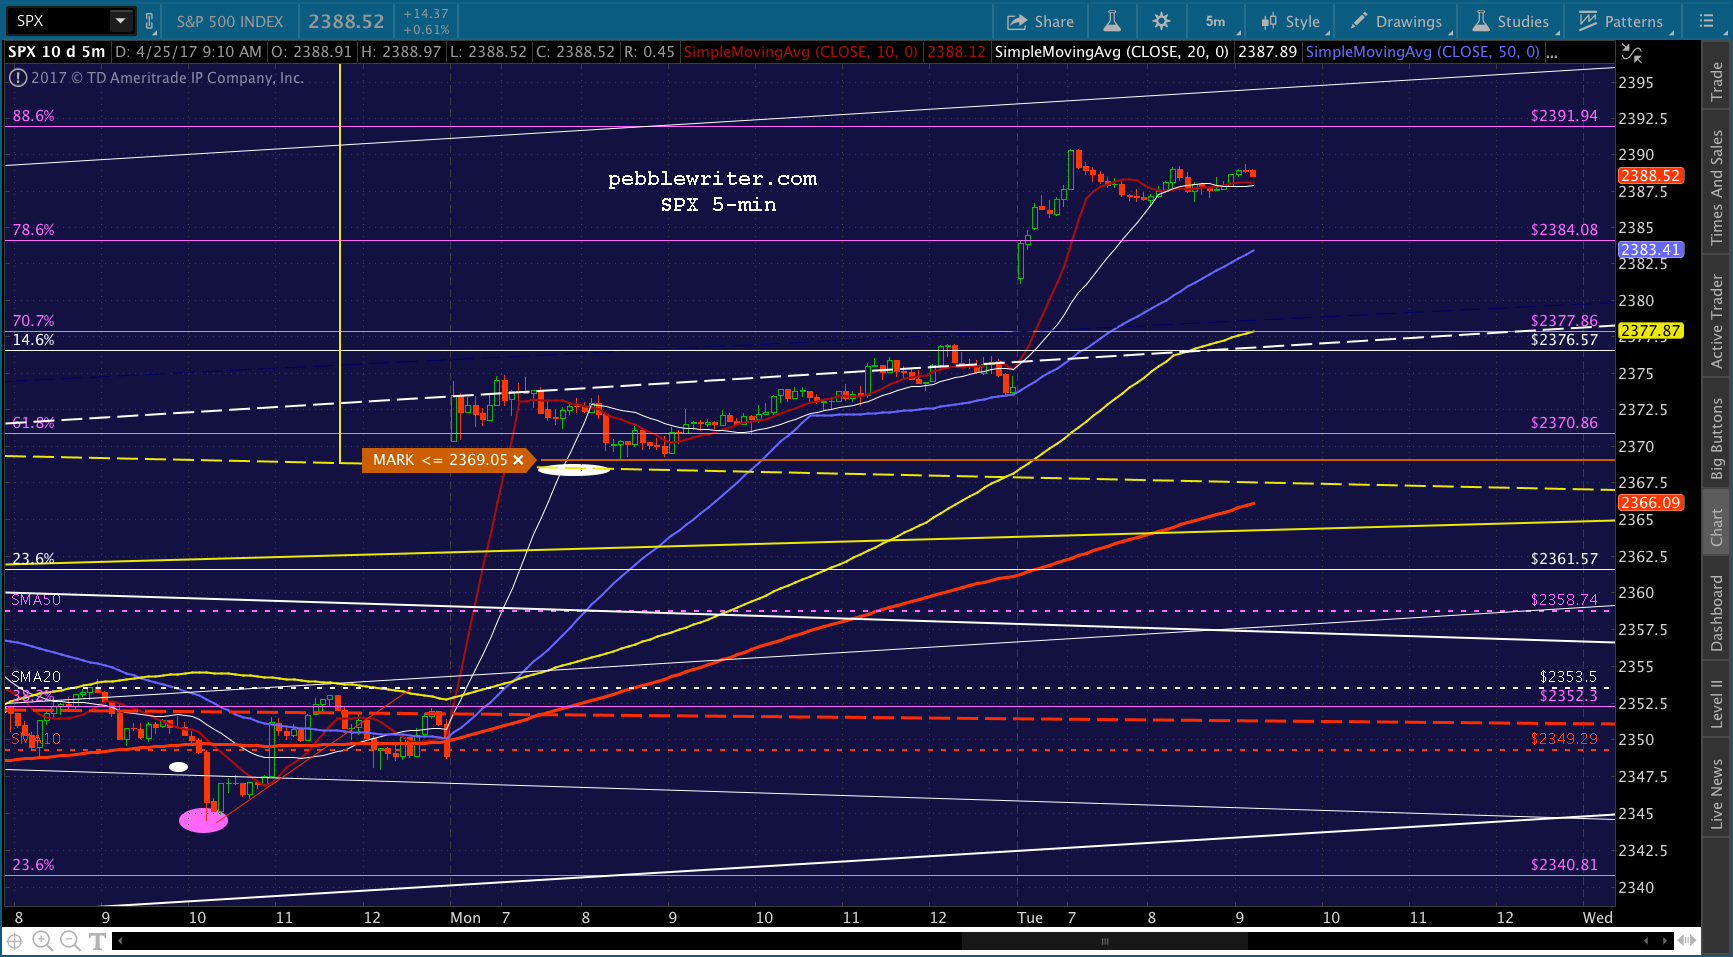
 UPDATE: 12:33 PM
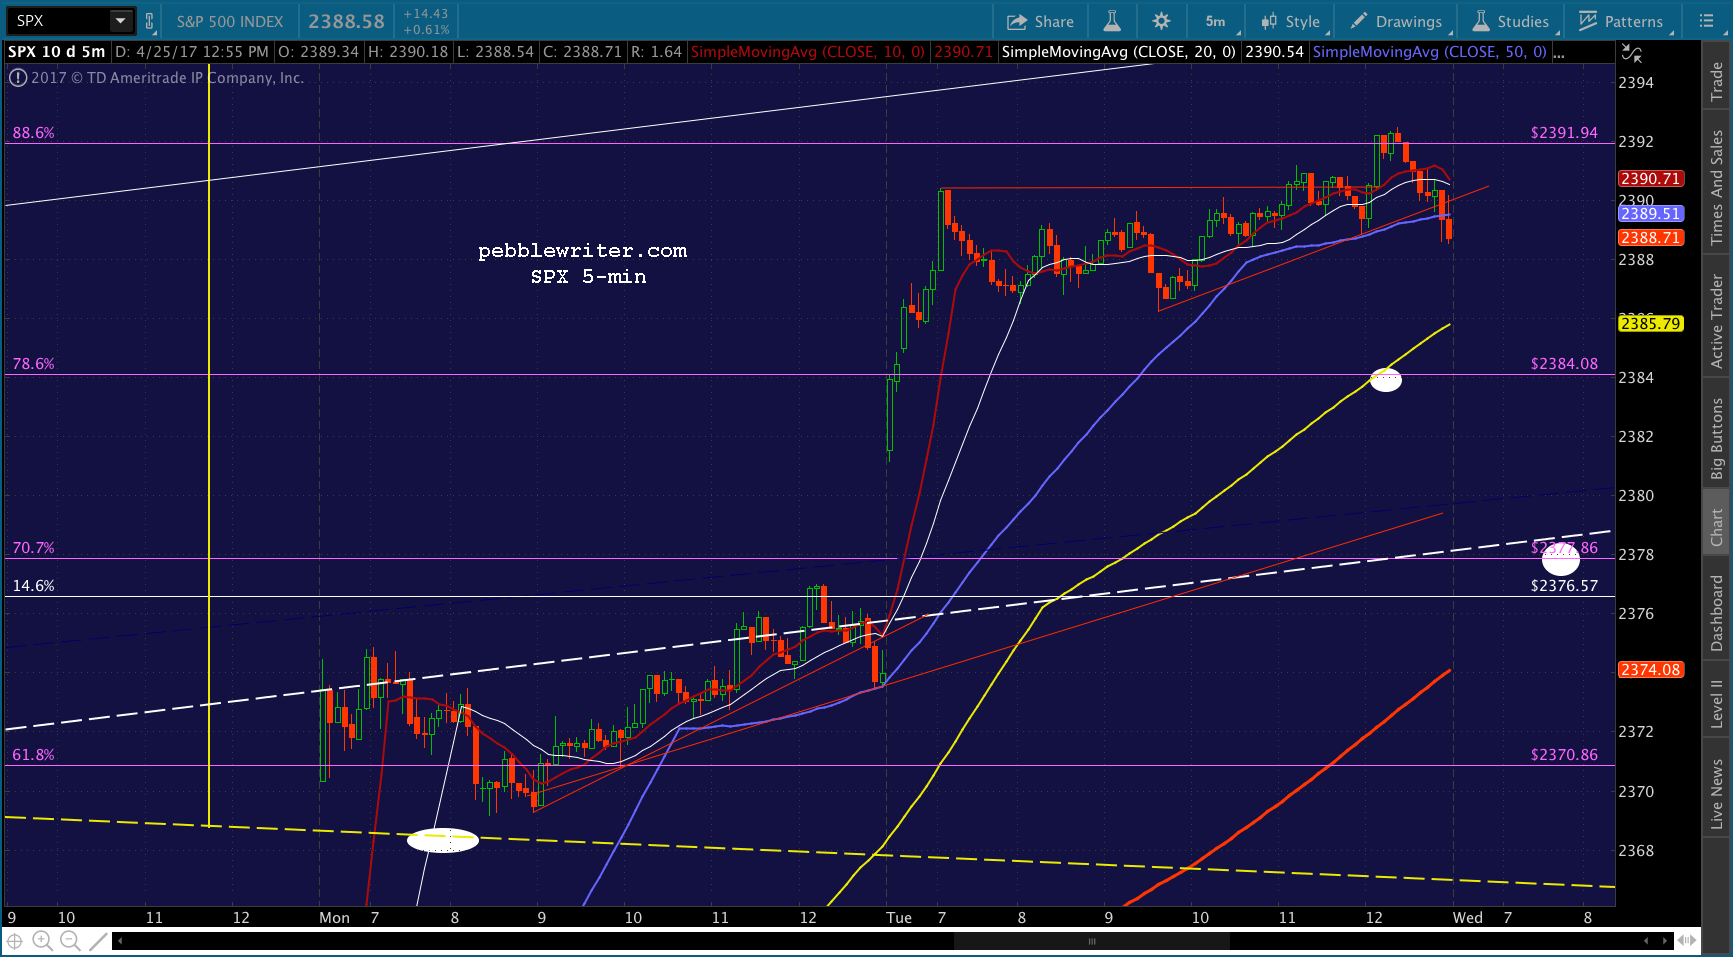
Hardly worth it, but it appears we could get a drop here to the .786 at 2384. The only value in playing along is that it could drop through to the white channel midline which will reach the .707 at 2377 by the end of the session. And, who knows? The SMA5 200 is creeping up on the .618 at 2370.86. In the absence of some nasty headlines, I don’t expect it this week, but it’s worth keeping in mind.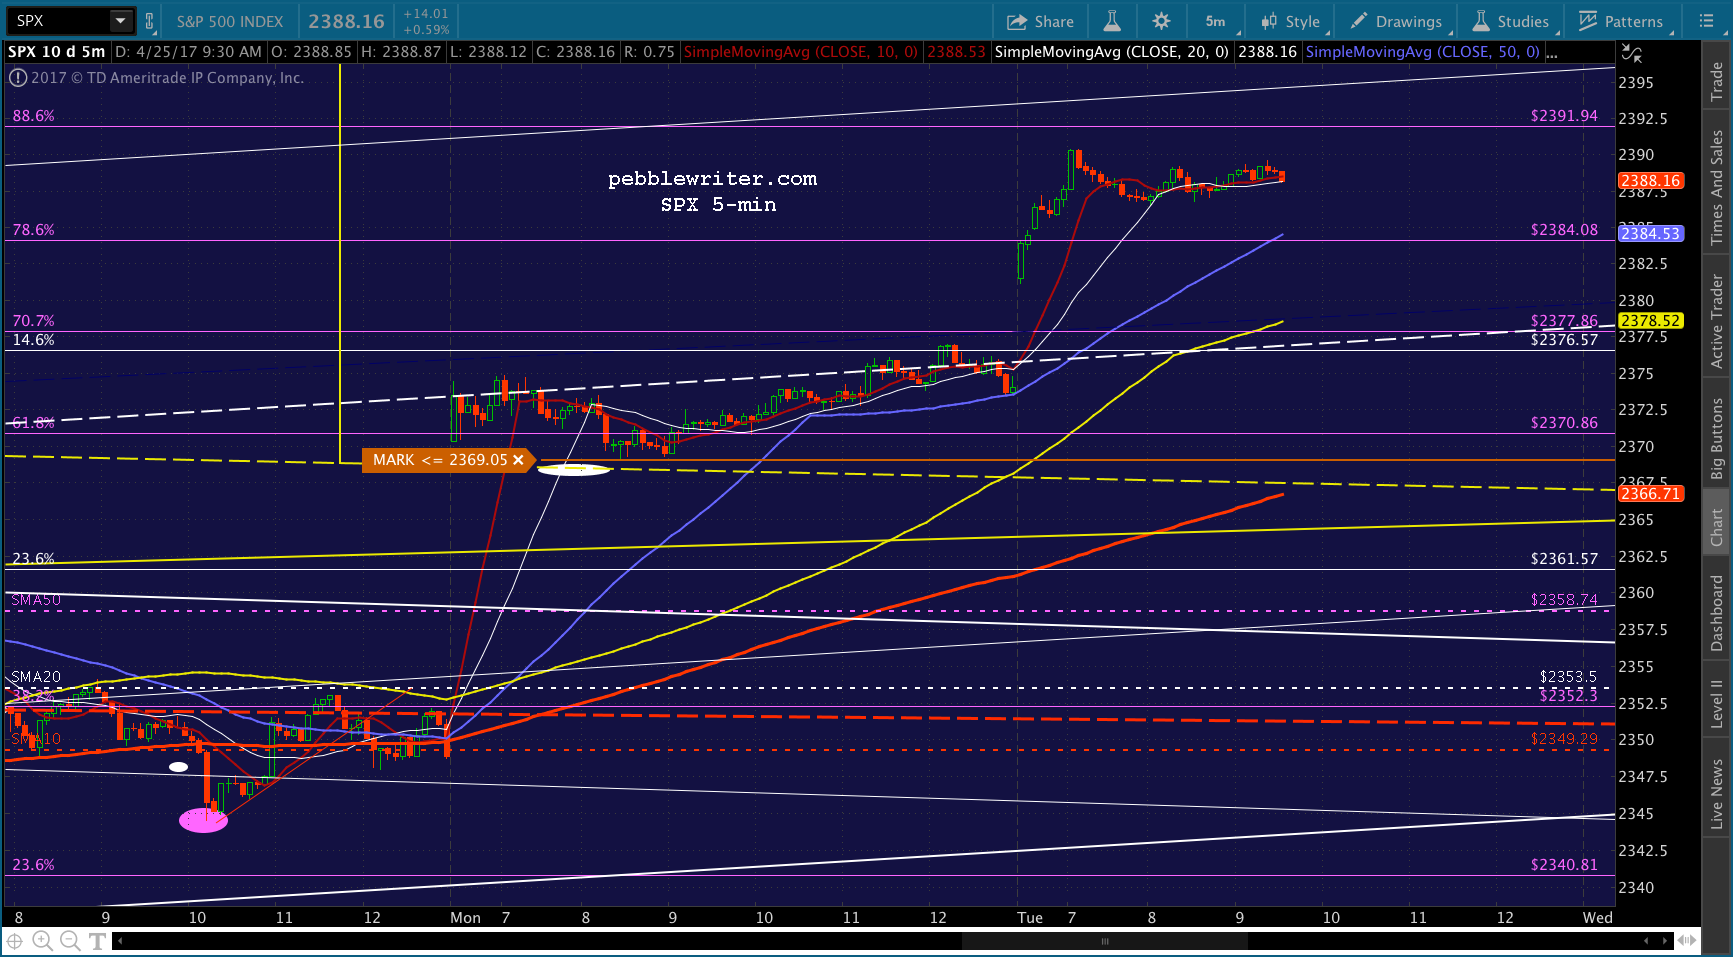 ES’ SMA5 200 is currently around 2375 at the bottom of the white channel. It has cleared the previous high at 2375 and is coming up on the .707 at 2376.61. This would be about 2380.38 in SPX terms — just above the .707 and about where the SMA5 100 should be in an hour or two.
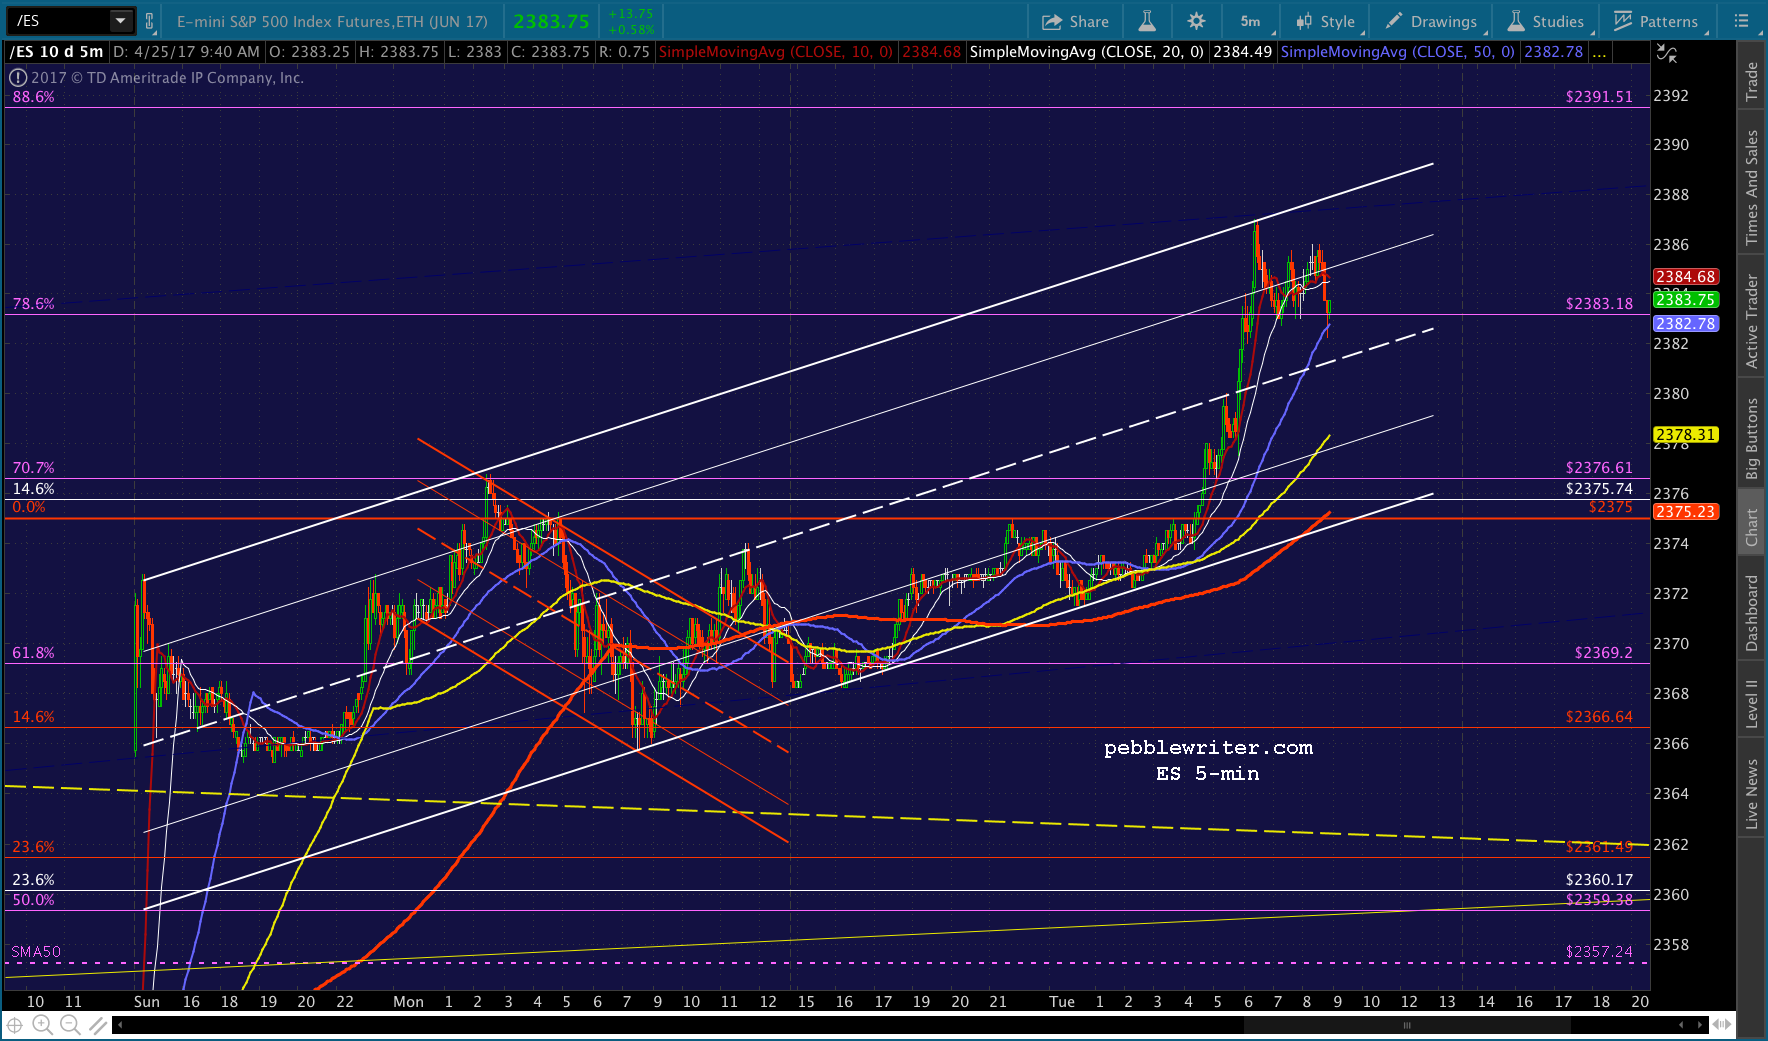 UPDATE: 2:12 PM
SPX is slipping up past this morning’s high. It would appear that the backtest isn’t going to happen today. I wouldn’t be excited about holding short past this point, but would certainly consider it if SPX retreats after tagging the .886.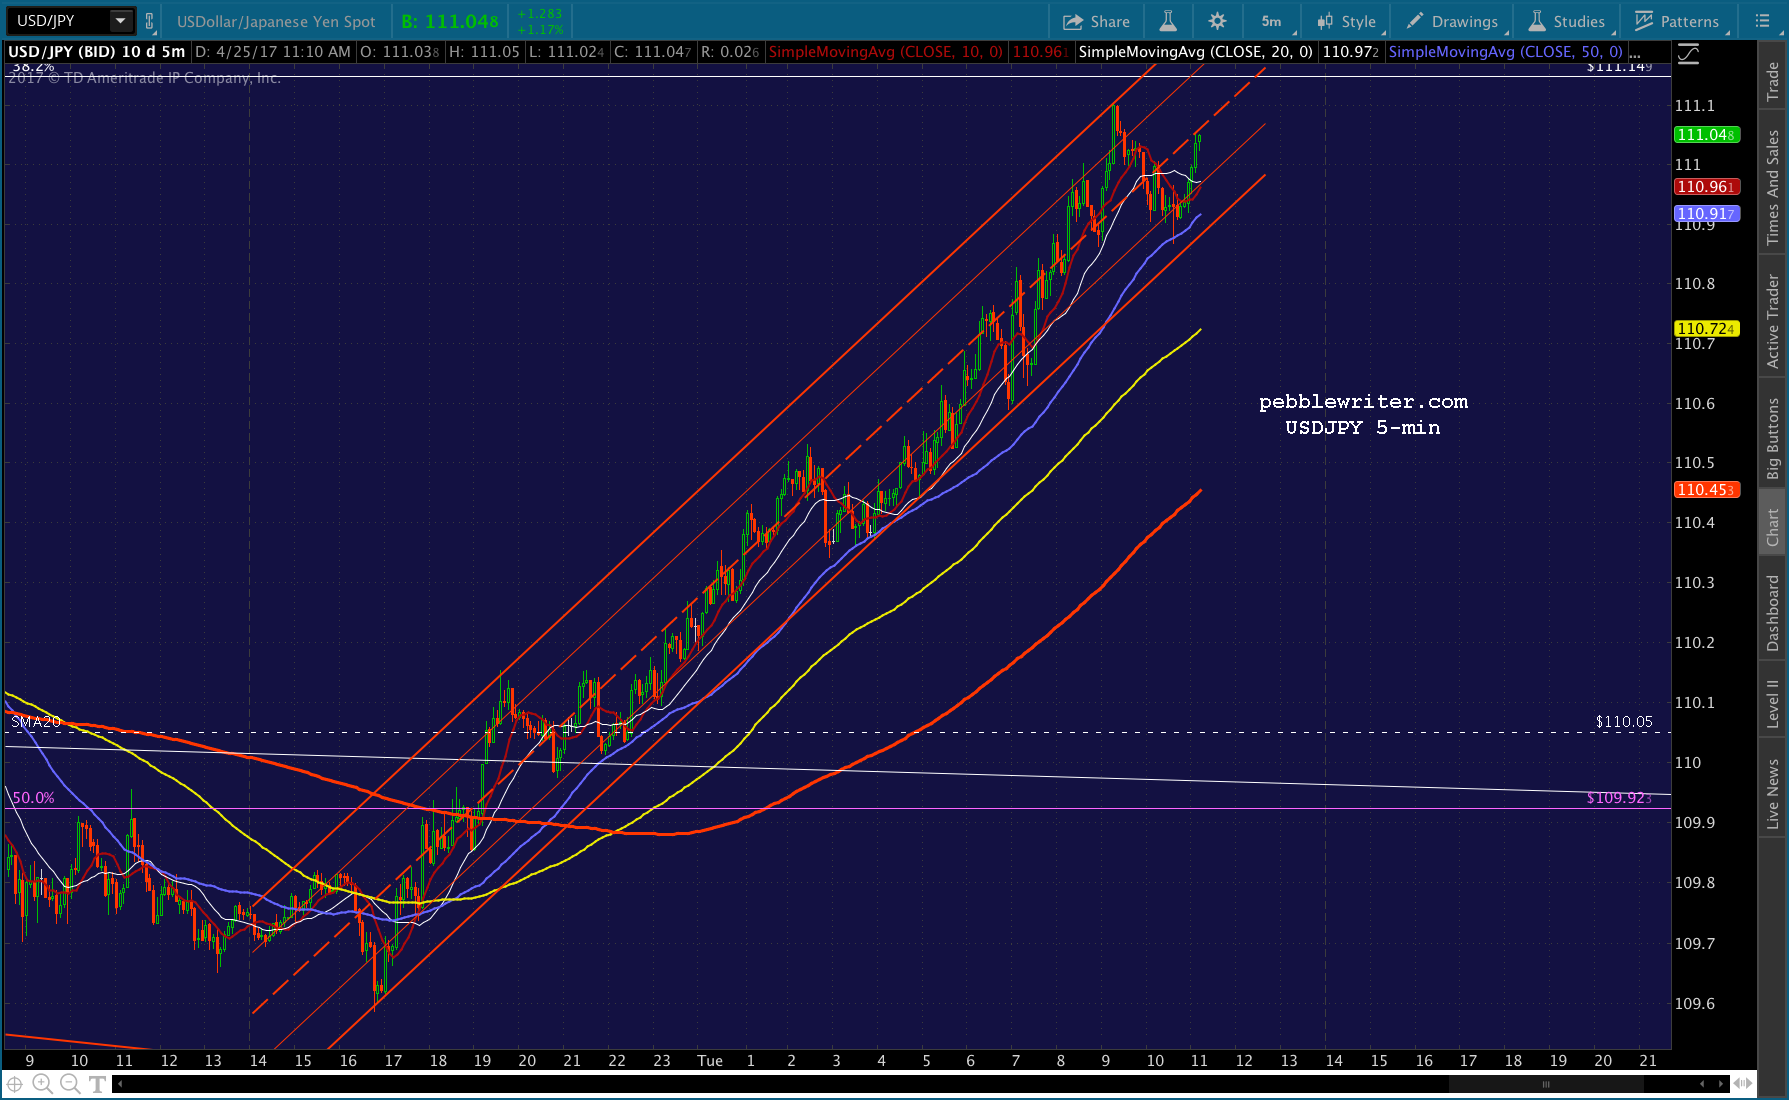
 UPDATE: 3:04 PM
Time to put up or shut up, SPX.
 UPDATE: 12:08 PM
Magically, it delivers. Since VIX is the one who brought us to the dance, we have to respect its actions here. If it continues to bounce off the red TL (10.79ish), we should get a reversal here off the .886. For the brave (and, not too cynical) this is as close as we’re going to get to a sell signal. Just keep your stops where you’re comfortable, as CL is still on the rise (API due out after the close) and USDJPY is still going strong.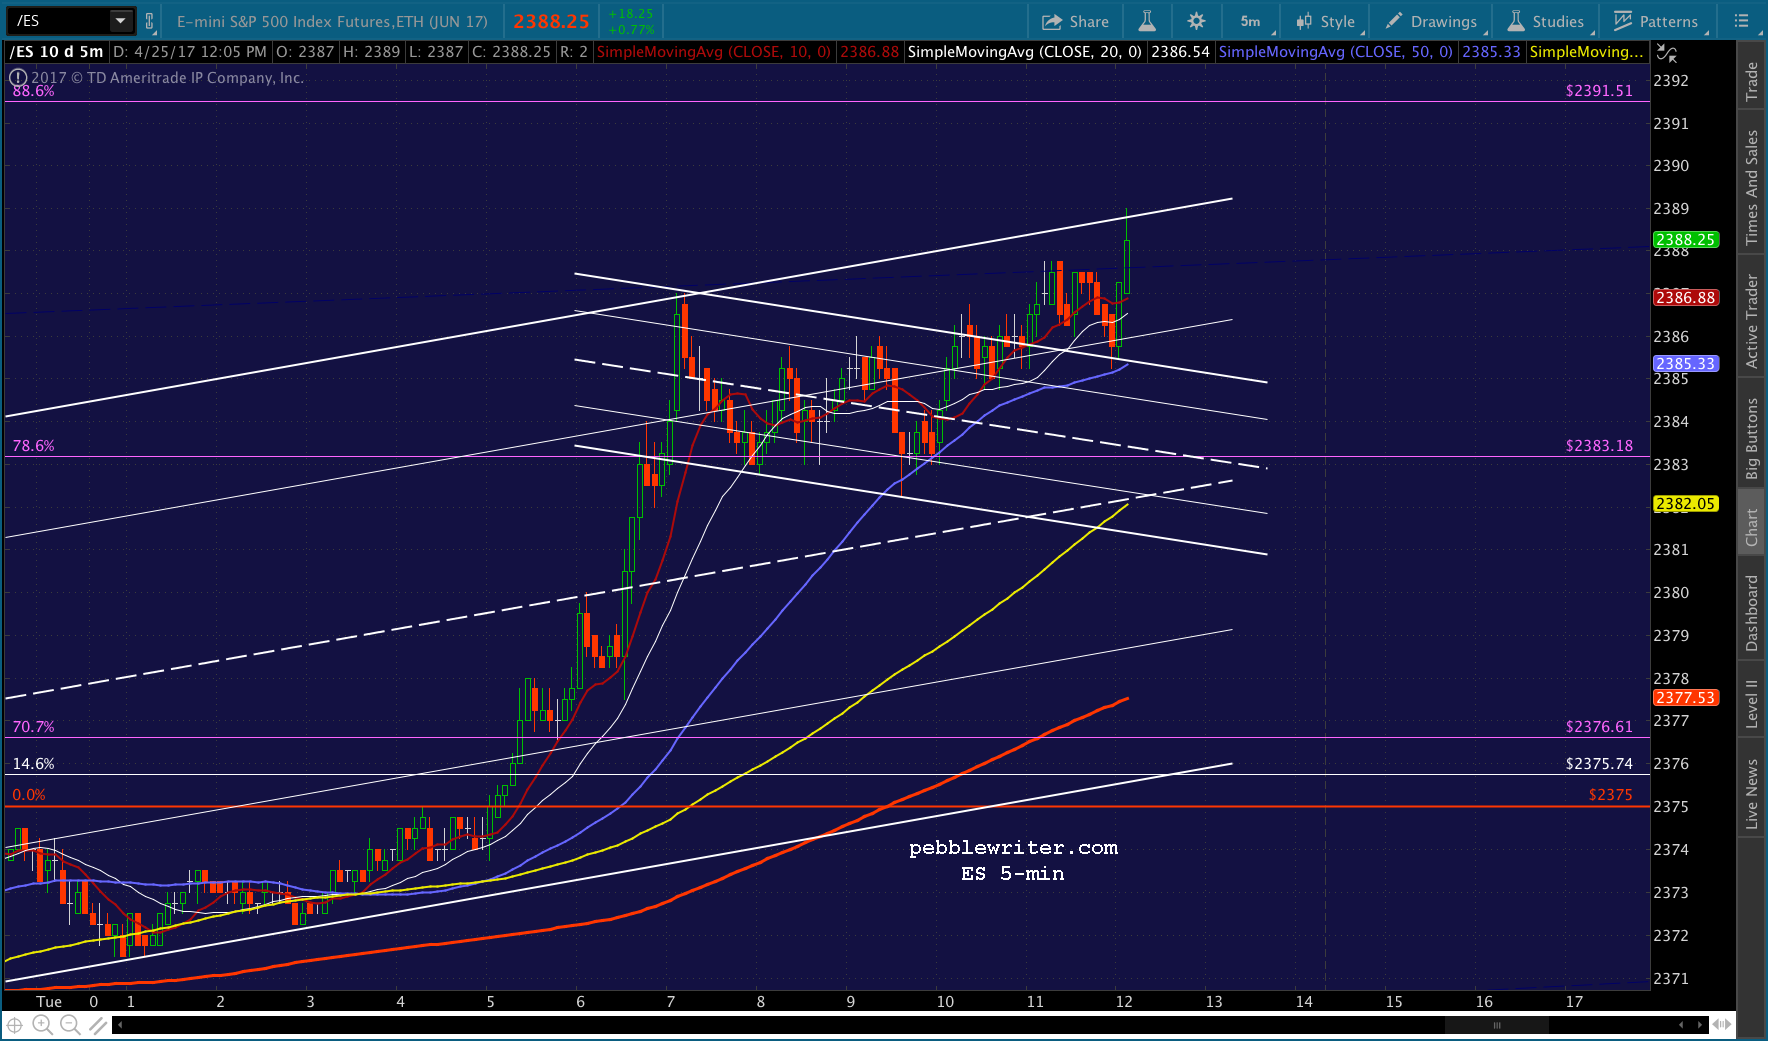
 UPDATE: 3:41 PM
VIX is breaking down. Probably won’t let any kind of drop occur — at least today. We’ll see what happens at the red TL and/or SMA5 50 around 2389.50. 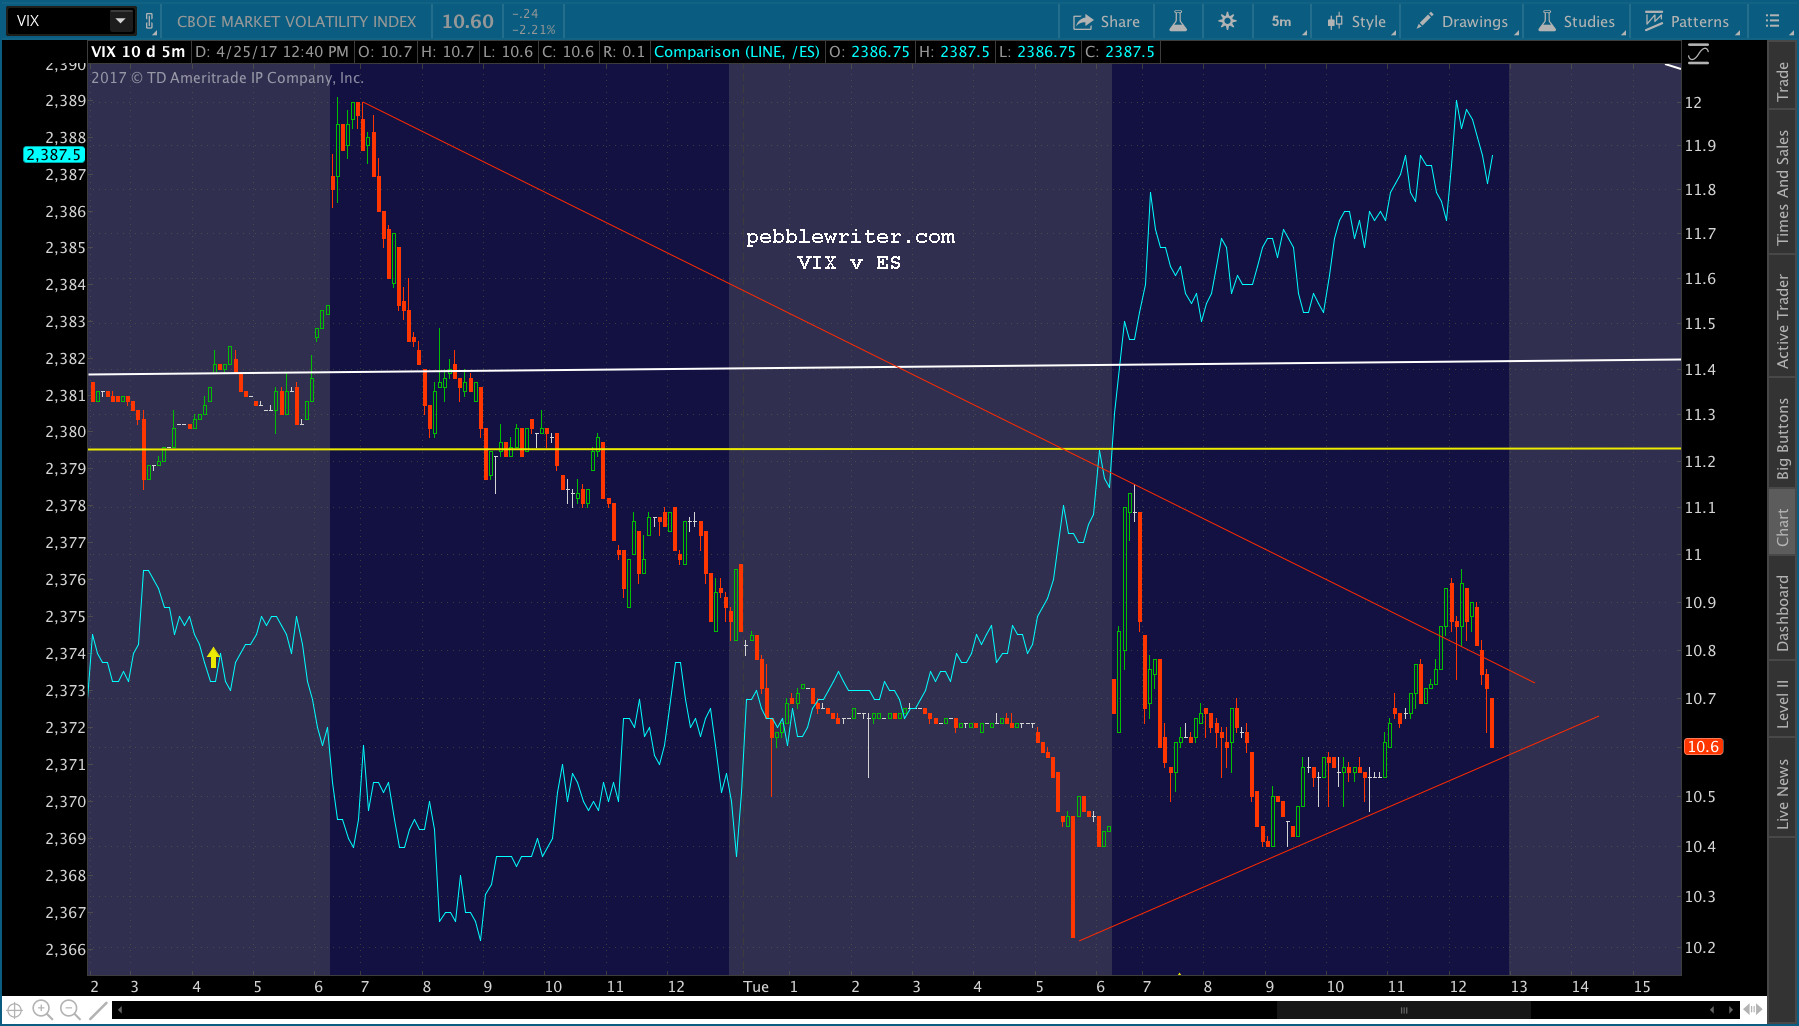
 UPDATE: 3:50 PM
I probably don’t need to remind anyone to hold short only if you can hedge or handle the kind of gap risk we’ve seen the last couple of days. SPX is probably going higher over the next few days, even if we get a nice sell-off here into the close.
 Remember, yesterday finished on a slight down note and TL break, only to gap 7 points higher this morning. Head fakes are common in these situations.
UPDATE: 4:00 PM
Sidelines here for the less adventurous types…though there’s a good chance it dips to 2384-2386 or 2378 by the morning.
Comments
One response to “How Broken is the Market?”
[…] On second thought, it’s really no mystery at all; the markets are broken. The Fed’s misguided policies are now driven entirely by the stock market. Unfortunately, […]