

In our last update on NDX, I noted that NDX was testing key support at the bottom of a long-term channel as well as the 100- and 200-day moving averages. The index had climbed to within 1.6% of its tech bubble highs from the year 2000. New all-time highs appeared to be just ahead. But, there was a catch:
However, if investors are disappointed with the Fed’s upcoming decision, look for another test of the white channel bottom at around 3955.
 As it turned out, investors were quite disappointed when, two days later, the FOMC increased its target range by 25 bps to .25 – .50% and the YE 2016 target rate to 1.375%. TPTB managed to tread water for another 10 sessions, through the end of the year.
Then, NKD broke down. It reached 3992 within the next three weeks, bounced almost 8%, then plunged below our 3955 target to complete a Bat Pattern at 3888. By the time all the dust had settled, it was an 18% plunge in about 7 weeks. Hedgies that were crowded into some of these can’t-miss stocks took it on the chin. Now that the index is back to a point of major resistance, what lies ahead?
continued for members...First, note that NDX is bumping up against the top of the falling white channel that did a decent job of guiding the downside over the past 18 months.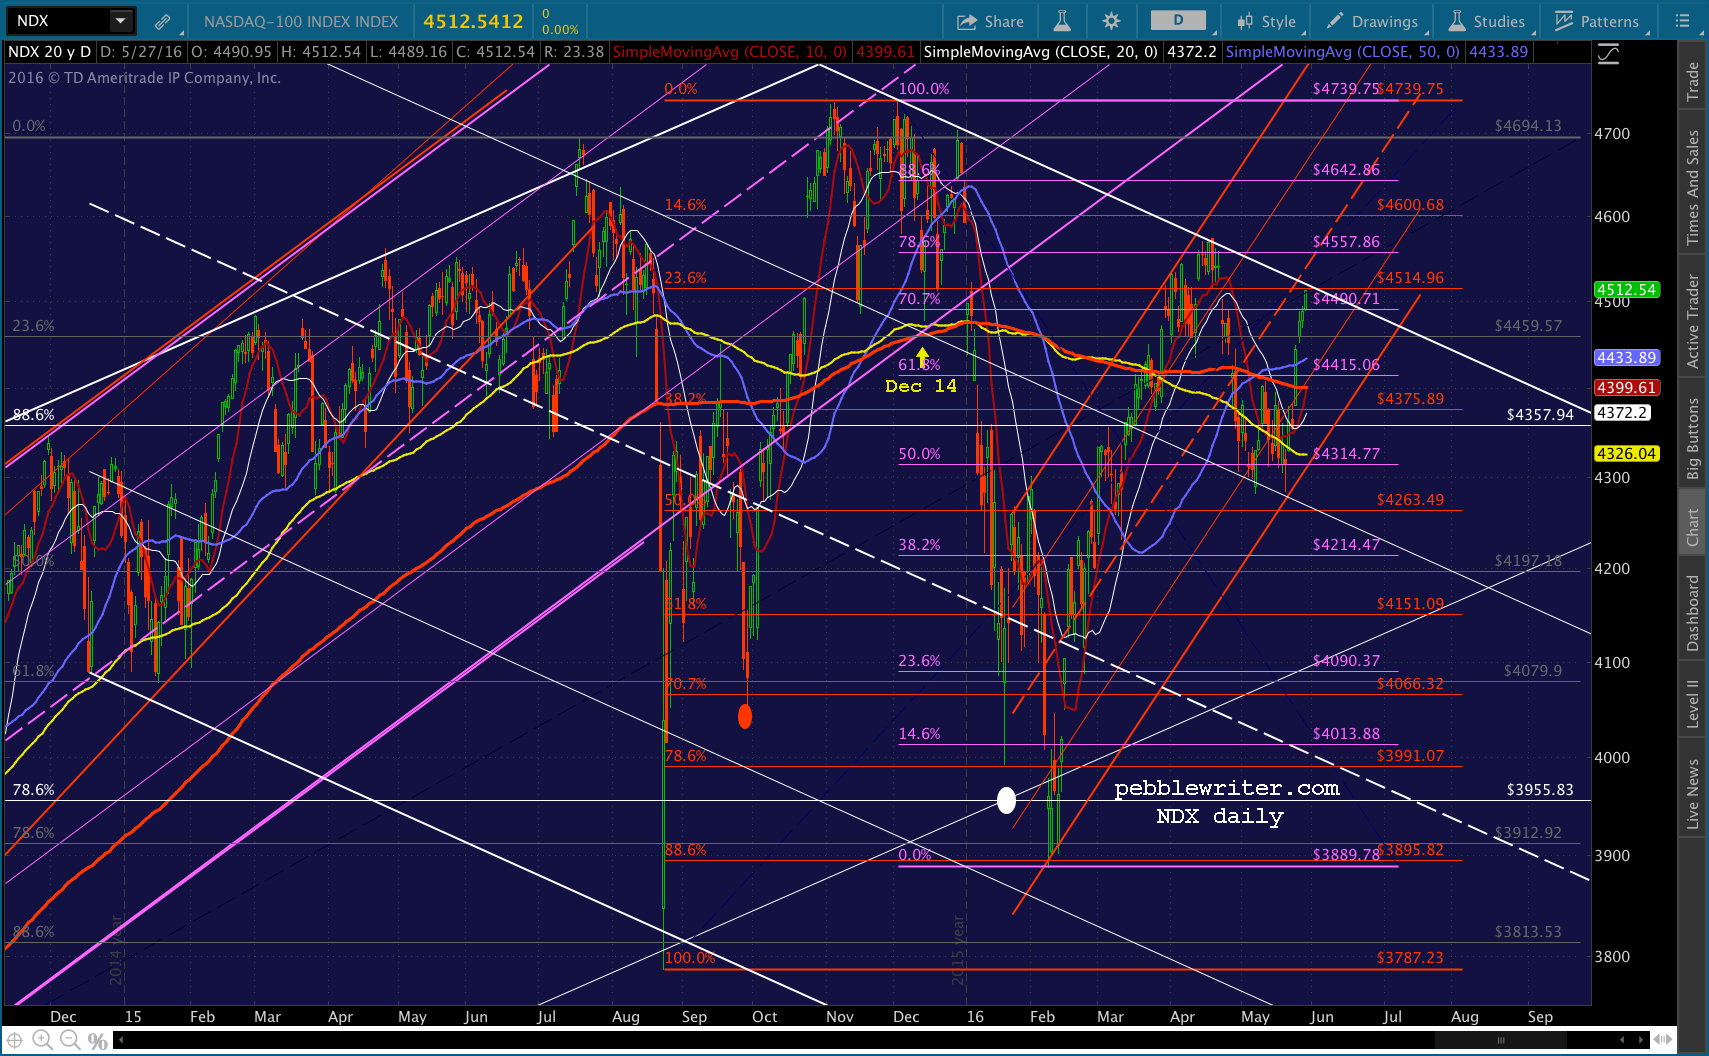 Second, it is nearing the midline of the sharply rising red channel from the February lows. It’s not a great looking channel, but it’s as legit looking as most of the melt-ups we’ve seen in recent years.
Third, note that it already retraced 78.6% of its drop from 4739 to 3889 — a move that appears more impulsive rather than corrective. When it reversed at the white channel top in April, it only made it down to the .786 line before bouncing right back.
And, last, note that it is right back above all of its moving averages. The 50-day recently crossed above the 200-day — a golden cross. However, this has been a head-fake several times in a row:
- the Sep 30 death cross marked a bottom
- the Nov 17 golden cross preceded the high by only two weeks
- the Feb 5 death cross was followed by a bottom the next session
Given that the recent golden cross occurred several weeks ago, we have to wonder whether it’s also a head fake.
But, why waste a perfectly good opportunity to break out? NDX is one of the more easily manipulated indices. Spoof a few of the more popular issues, have USDJPY or CL break out for a few days, and the rest will fall in line — especially if the white channel top and the purple .886 are cleared.
It was a maneuver used in early 2015, when NKD managed a breakout rather than the sharp reversal that should have occurred after it completed a Bat Pattern on Nov 28.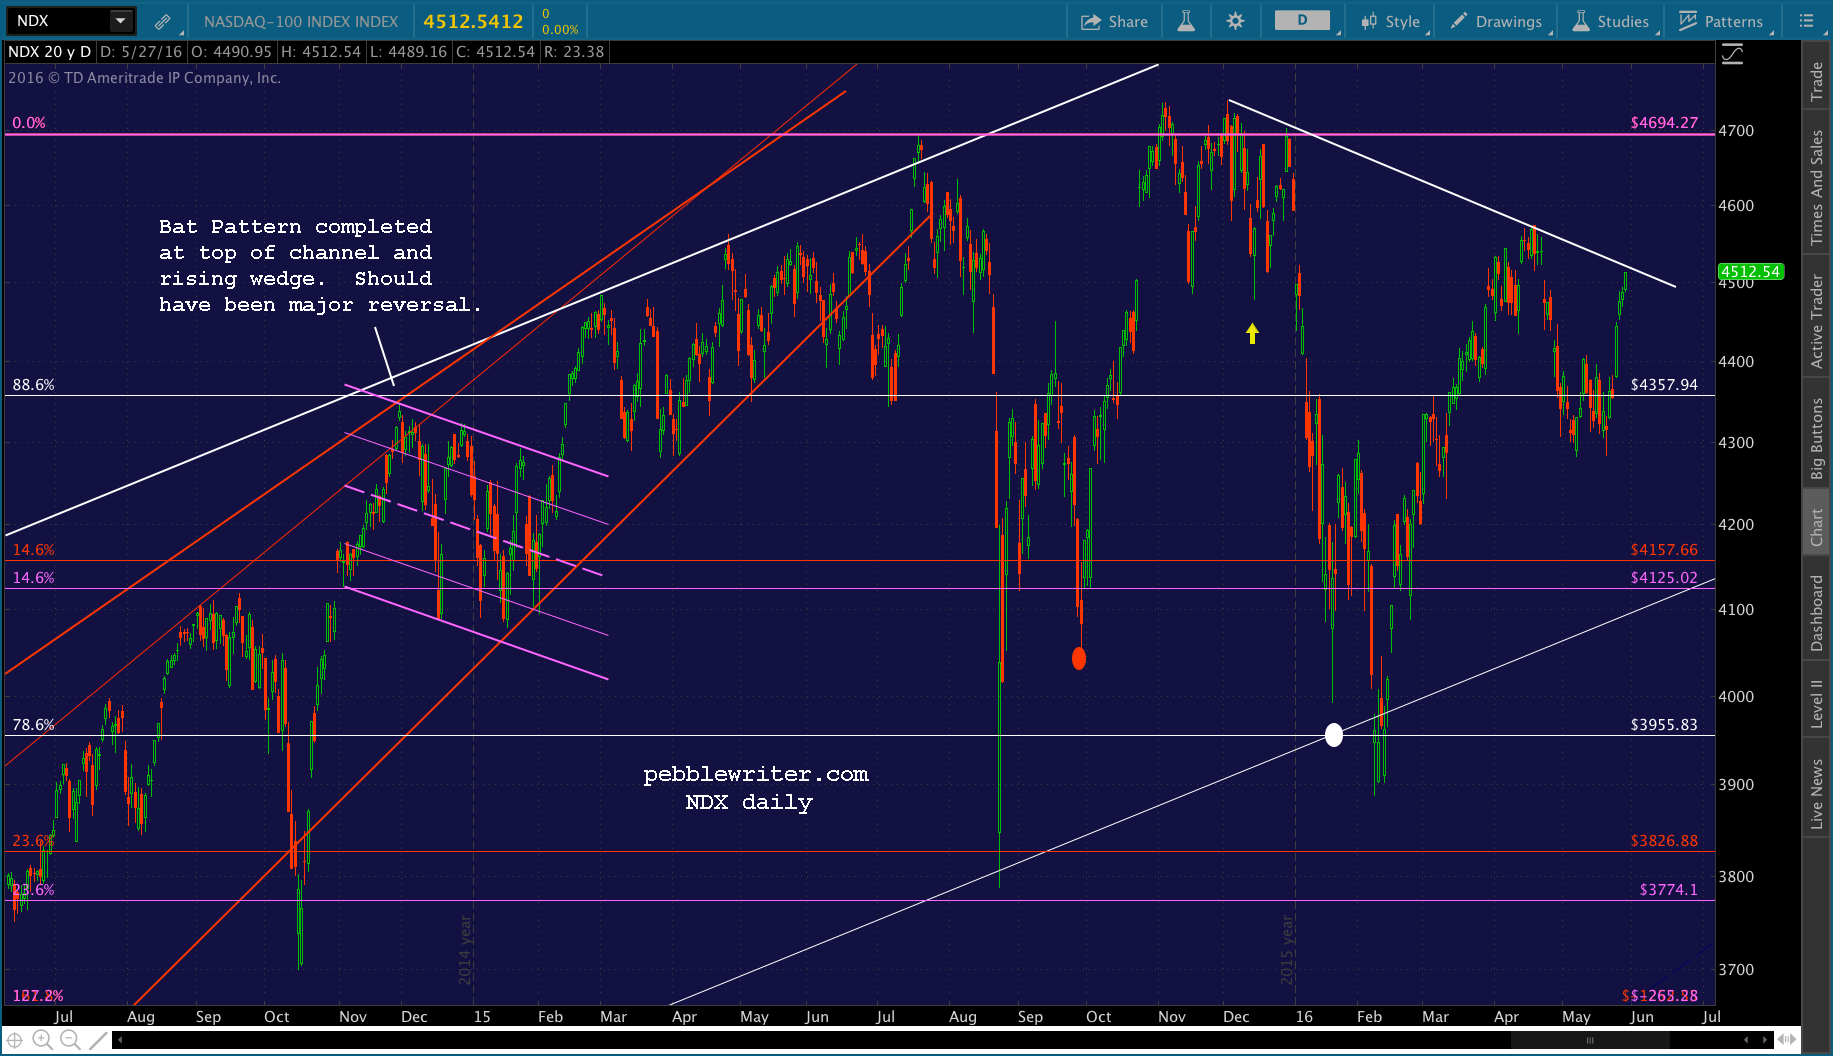 In the end, does it matter? From a chart standpoint, absolutely. Not to be overly dramatic, but if NDX can’t top the falling white channel line and retake 4816, then everything since 2002 has been a very deep retracement.
The past six months would merely represent a good start on the way down to 2744 or 2422 (assuming central banks completely gave up on propping up markets – fat chance.)
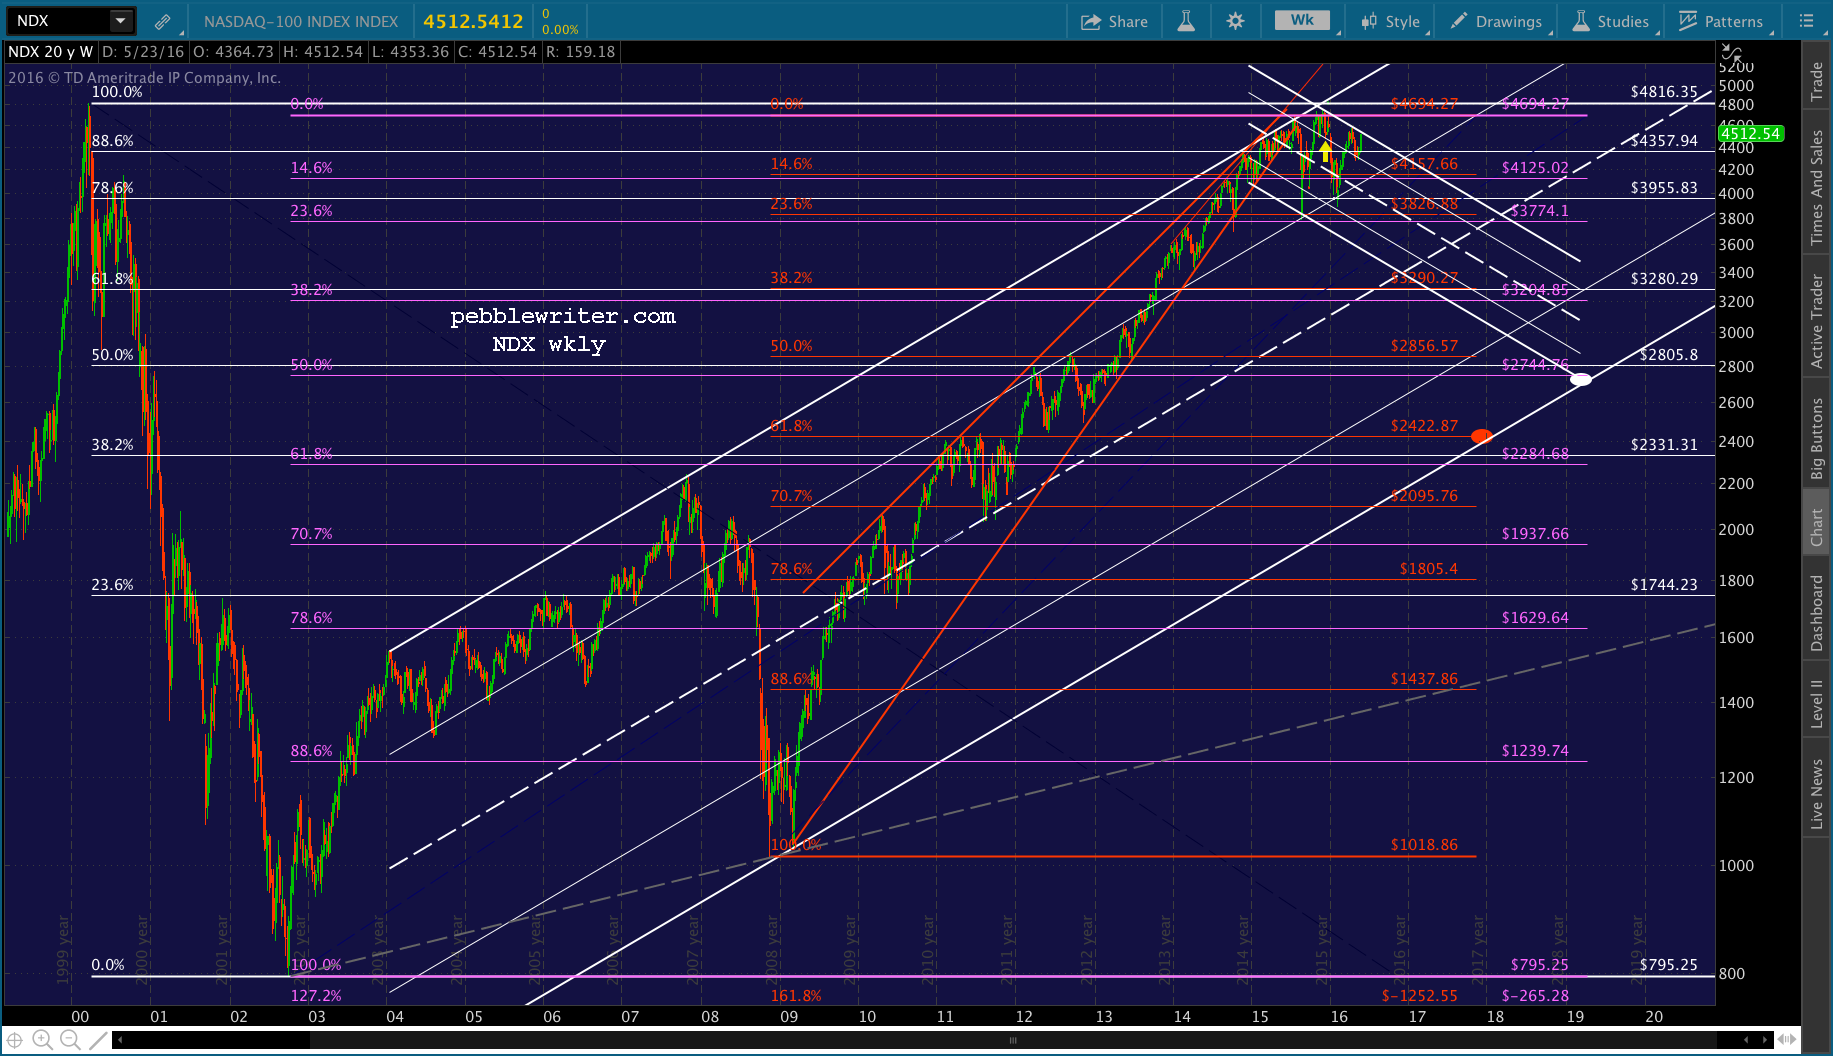 If it can pop above the white channel top and 4739.75, then it could reach new highs at the bottom of the purple channel by Jun 8 or so — the week before the FOMC could conceivably announce their next rate hike.
Stay tuned.