

Last year at about this time we noted that NDX had completed a golden cross — where the SMA50 crosses above the SMA200 — normally a strong buy signal. But, as we also discussed, such signals had been head fakes the past several times in a row.
The 50-day recently crossed above the 200-day — a golden cross. However, this has been a head-fake several times in a row:
– the Sep 30, 2015 death cross marked a bottom instead of a top
– the Nov 17 golden cross preceded the high by only two weeks
– the Feb 5, 2016 death cross was followed by a bottom the very next session

On the other hand, NDX had also reached potentially significant resistance: two channel tops and a key Fibonacci level.
If the golden cross was to be believed, we’d see a strong breakout. If it was another head fake, NDX was due for a tumble. Unlike the Dow and the S&P 500, NDX had yet to even recover to its Mar 2000 highs.
It was a head fake. NDX went sideways for a week before plunging nearly 8% in just 15 sessions. The bulk of the drop (6.4%) occurred on just three days: Jun 23, 24 and 27. Clearly things were accelerating.On the 27th, the SMA50 actually dropped below the SMA200 — the dreaded death cross — on an intraday basis. As bad as things had been, were they about to get even worse?
Readers might remember the Jul 2008 death cross which preceded a 46% drop, and the Sep 2000 cross which resulted in a 79% crash. In other words, death crosses are not usually very healthy for stocks.
But, wait, did I mention that NDX experiences frequent head fakes? On Jun 28th, when the death cross officially occurred, NDX gapped higher. And, then it kept going. In three weeks, it gained a total of 16% (136% on an annualized basis!) and reached new, all-time highs — not bad for a bearish signal.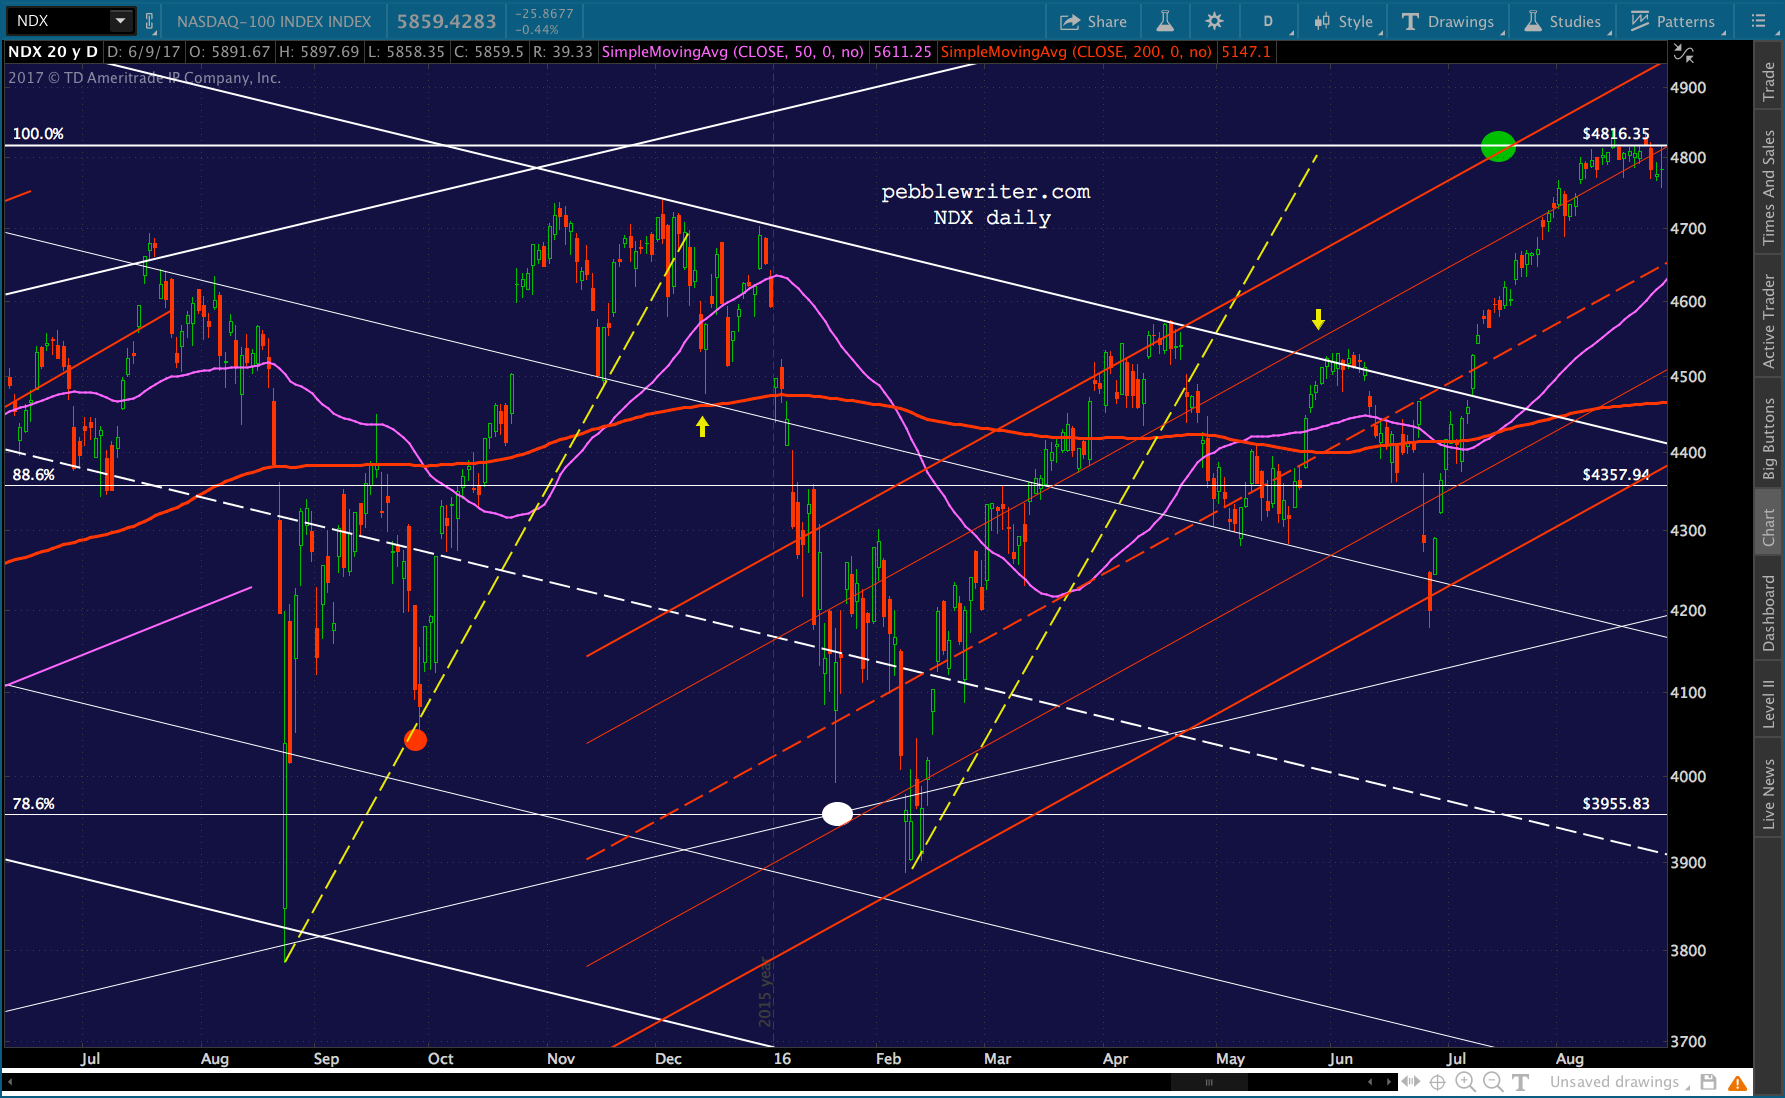 Since QE started in late 2008, every single NDX death cross except one has signaled a bottom — usually the same day but within, at most, the next two sessions. The one exception, in Dec 2012, took 12 sessions.
If this doesn’t make you a believer in the Plunge Protection Team, I don’t know what will. And, considering how critical NDX’s top stocks are to the market’s overall direction, it’s understandable.
 NDX broke above its all-time high on Aug 16, but then spent almost 4 months trying to break out before finally doing so on Dec 7. Since then, it has been a fairly straightforward meltup. The only hitch, now, is that NDX has reached a key Fib level that could prove problematic.
With the NDX providing much of the market’s leadership, is this something to be concerned about?
continued for members...There was no significant reversal at the white .786, so we wouldn’t necessarily expect a Butterfly Pattern reversal at the 1.272. However, note that NDX broke out above the white channel top on Apr 24 [see: How Broken is the Market?] and has yet to put in a full backtest. 
This would be an ideal spot from which to launch such a move. And, with the channel top at 5580ish, it wouldn’t be so dramatic a drop (5.5%) that it would scare away the speculators.
A sharp reversal right at the channel top is iffy, only because the SMA50 is a little above it at 5610 and the red channel midline is just below at 5528. Bottom line, it might be tough to call a bottom until after we get a nice bounce going.
GLTA.
* * *
Note: I started this post Friday morning, but didn’t have time to finish it before taking off for my last day of vacation. NDX never did make it all the way up to 5910.09 — putting in a nice reversal just short of it at 5897.69. It made its way as low as 5657.76 and closed just below the SMA20, suggesting it’ll complete the move in the next few days. 
Note that the SMA100 is rising fast, and looks likely to cross through the white channel top and the red channel midline on or about Jul 7. So, it’s entirely possible that NDX just limps along, moving sideways to slightly lower for the next several weeks. For now, we’ll rank that as the secondary target behind a simple backtest of the white channel top in the next day or so.