Note to members: our downside targets remain unchanged from Wednesday.
* * *
Yesterday was another one of those days that left many people scratching their heads as the market, which had been breaking down, suddenly wrenched higher for seemingly no reason. There was a reason. But, the explanation requires that we revisit what happened in 2018.
Readers will recall that a large Head & Shoulders Pattern played out in December, resulting in a 20% correction for SPX off its Oct 3 highs. (The chart below shows the S&P futures (ES), as this helps illustrate after-hours moves as well.)
For those new to chart patterns, the H&S Pattern completes after the failure of three rallies above a trend line (called the neckline.) The only requirement is that the middle rally (the head) be higher off the neckline than rallies before and after it (the shoulders.) When prices fall below the neckline, the pattern indicates a drop to a level equal to the greatest distance between the neckline and the head.  In the instance above, that distance was 354 points. When ES finally dropped through the neckline on Dec 14 (the yellow arrow) the neckline was at 2614. We substract 354 from 2614 and get a target of 2260. In this case, ES fell to 2316 — about 56 points short of the indicated target. This limited SPX’s drop to 20% — an important line in the sand which has prompted Fed and/or Treasury intervention many times in the past.
There were other warning signs of an impending drop such as the Death Cross which occurred on Dec 6. A Death Cross — where the 50-day moving average drops below the 200-day moving average — last occurred in Jan 2016 in the midst of a 15% correction. But, I digress.
Readers will recall that Dec 26, the day that the correction finally bottomed, was the day that Treasury Secretary Mnuchin convened the President’s Working Group on Financial Markets, also known as the Plunge Protection Team, first established in 1987 in the wake of the 1987 crash. While the PPT’s specific actions are not disclosed, it is apparent that one of its primary actions was to reverse the spike in VIX which accompanied the plunge.
 The mechanisms involved in this reversal are not publicly known, as the PPT does not disclose its activities or release minutes from its meetings. Many have speculated on its activities — suggesting that it directly or indirectly purchases futures and derivatives in order to prop up stocks in times of distress.
Robert Heller, three months after retiring from the Federal Reserve Board of Governors in 1989, confirmed in a Wall Street Journal article that the Fed had the ability to do so and, in fact, suggested that it should.
The Fed also has the power to set margin requirements. But wouldn’t it be more efficient and effective to supply such support to the stock market directly? Instead of flooding the entire economy with liquidity, and thereby increasing the danger of inflation, the Fed could support the stock market directly by buying market averages in the futures market, thus stabilizing the market as a whole.
The stock market is certainly not too big for the Fed to handle…The $13 billion the Fed injected into the money markets after the 1987 crash is more than enough to buy all the stocks traded on a typical day. More carefully targeted intervention might actually reduce the need for government action. And taking more direct action has the advantage of avoiding sharp increases in the money supply, such as happened in October 1987…
It would be inappropriate for the government or the central bank to buy or sell IBM or General Motors shares. Instead, the Fed could buy the broad market composites in the futures market. The increased demand would normalize trading and stabilize prices. Stabilizing the derivative markets would tend to stabilize the primary market. The Fed would eliminate the cause of the potential panic rather than attempting to treat the symptom — the liquidity of the banks.
The Fed’s stock market role ought not to be very ambitious. It should seek only to maintain the functioning of markets — not to prop up the Dow Jones or New York Stock Exchange averages at a particular level.
Heller’s suggestion that the Fed intervene was taken to heart. The December 26 bottom (1) is an obvious example, as it correlated perfectly with VIX’s peak as seen in the chart above. January VIX futures contract volume spiked during the plunge and trailed off as soon as the danger had passed. Mission accomplished. But, why stop there? Why not make sure everything stays okay?
 When ES rebounded to its neckline (2) in January and needed help rising above it, VIX conveniently dropped through a trend line from early December. In early February, when ES needed help rising back above the 2.24 Fibonacci extension (the yellow line at 2728.79) and 200-day moving average (3), VIX accommodated by dropping below horizontal support dating back to October 2018.
  When it backtested and rallied above the 2.24 extension and 200-DMA in early March (4), it was because VIX suddenly collapsed below another trend line. When it completed a small H&S Pattern in May (5) and needed to bounce off the 2.24 extension and up through its neckline instead of dropping to the pattern’s target of 2638, VIX conveniently dropped through a trend line from April. In late June, when it was time for the red H&S Pattern to be busted and ES rise to new highs (6), VIX was happy to oblige again — collapsing yet again.
 Note that, having bounced off the 2.24 extension (at 2728.79) twice, a return to it in early June would have completed an even larger H&S Pattern targeting 2495. The two previous bounces were at 2726.50 and 2728.75; so, someone felt it was important to prevent ES from dropping any further. Their ability to stop it on a dime was impressive.
Over the past two months, the trend has continued. ES tested its 200-DMA again on August 6, the day that VIX reversed sharply (7) and shed 33% over the next two sessions. When it was in danger of completing another H&S Pattern (the yellow neckline at 8) on Aug 15, VIX was ready.  VIX’s breakdown in the pre-market hours of Sep 5 ensured ES broke out of its month-old holding pattern to come within 4 points of its July all-time highs. Note that such breakdowns commonly occur after the market closes or before it opens when futures volume is low and prices are, therefore, more responsive.
 While VIX is not the only tool used to move stocks (oil prices and currencies are also frequently used) it is one of the more effective ones. By dropping through an obvious trend line or moving average, or simply making a series of lower lows as we saw in May – July, VIX sends a powerful signal to algorithms which are programmed to notice such things (i.e. if volatility is falling off it must be time to buy.)
Since 90% of all market volume is now either quantitatively-driven or passively follows quantitatively-driven moves (e.g. index funds and ETFs), it makes little difference whether such moves are justified by the economic or fundamental news of the day. It’s a classic case of the tail wagging the dog. And, it has become so effective as to fundamentally change the price discovery function of markets.
And, that brings us back around to yesterday. It might surprise some to learn that the same large-scale manipulation of VIX is equally effective on a smaller, intraday scale.
After reversing and dropping 65 points to complete a small H&S Pattern (the purple neckline) two days ago, SPX was set to complete a larger one (the yellow neckline.)  ES had ramped higher overnight on news that the White House would release a transcript of the phone call between Trump and Ukraine’s Zelensky. By the next morning, however, the futures had again dropped to the neckline.
At 7:00AM the White House released the transcript, which bought a couple of hours and another 12 points. Minutes after the open, however, stock prices tumbled as oil prices were cratering and bonds were spiking higher. As the H&S completed and ES was making a beeline for 2890, Trump — who correctly sees the stock market as a barometer for his odds of reelection — casually tossed out the comment that a trade deal with China could happen “sooner than you think” during a press conference.  ES immediately reversed and shot up 37 points. Though the market might have ignored the oft-repeated (and, never yet truthful) announcement of a breakthrough on trade, it couldn’t ignore VIX, which plunged over 10%.
It should come as no surprise to anyone that, as we approached this morning’s open, VIX was poised on the edge of another rising trend line — threatening another breakdown. When the economic news of the day came in stronger than expected, arguing against additional FOMC rate cuts, VIX suddenly dipped below that trend line. It lasted only a few seconds, but it was an effective warning shot across the bow that alerted algos it was time to buy stock futures. They did, for all of 20 minutes or so, until the market opened under heavy selling pressure and vol was bought.
 By then, the headlines regarding Trump’s latest imbroglio had caught up with the algos. ES shed about 22 points over the next two hours as VIX climbed from 15.35 to 17.09. At that point, it suddenly (and, on no news whatsoever) reversed and slumped as low as 15.72 when it, once again, dipped below the purple trend line.
The decline sent ES from its 2964.25 lows to as high as 2988.50 in the closing hour. VIX spent the last 30 minutes of the session dancing around the trend line, sending stocks sideways into the close. If it ramps higher overnight, you can be sure that VIX’s latest straw man trend line has broken down.
 Bottom line, the decline promised by the completion of the latest H&S Pattern has now been postponed for (at least) two sessions. As a member commented yesterday: “Wow, what a day! With this kind of horse-shit, is there ever a good time to be short? I think NOT.”
Many central banks such as the BoJ and the SNB openly intervene in equity markets. Others, such as the ECB and Fed are more surreptitious. The result is the same: algos and the many portfolios which follow their lead, which constitute 90% of daily volume, are easily manipulated. Whether by selling VIX futures, buying equity or oil futures, supporting USDJPY or simply tweeting that trade negotiations are going well, markets are easily propped up.
Has this ability to prop up markets at will ruined things for bears? I think it’s important to define your goals. If you’re a buy-and-hold investor hoping to protect your portfolio from periodic corrections or the next crash, you view the world very differently from trader hoping to capitalize on significant declines.
It’s easy enough to watch major moving averages, trend lines and channels and buy protection or pull the plug when things start to go south. Last November, for example, [see: All Eyes on AAPL] we were able to warn members of AAPL’s impending 36% plunge. More recently, we called the top for SPX on Oct 3 [see: VIX Takes the Plunge], the day the 20% correction began.
Not everyone will care about 20% declines which are almost always erased over the next few months. But, if you need to tap funds to purchase a home, donate to your alma mater or fund a pension plan, you care. And, what if that 20% decline turns into a 50% crash that takes years to recover? Do you care then?
Successful trading means capitalizing on these moves and requires that one anticipate or at least recognize when stocks will drop through support and/or begin their recovery (i.e. buying the dip.) Moving averages and chart patterns do a very good job of alerting us to a breakdown or recovery. I also spend a great deal of time watching factors such as USDJPY, CL and VIX which, as discussed above, often trigger algos to begin selling or buying.
It’s critical to watch both cash and futures markets for turning points as we recently saw on June 3. After dropping nearly 8% from its May highs, ES turned on a dime upon reaching its 2.24 extension at 2728.79 (ES bottomed at 2728.75.) SPX was still 25 points above its own 2.24 at 2703.62, leading to some confusion as to which would prevail. ES traders tend to be more technically inclined, so it wasn’t too surprising that it took the lead.
Since it was the third test in 4 months, I was watching closely as ES approached 2728 at the end of the session — still unsure whether we’d get another 25 points downside so that SPX could also reach support.
 The VIX chart wasn’t very much help. VIX had pushed above all of its moving averages (just like yesterday) and was testing a channel midline for the third time in a row. It hadn’t quite reached a .618 retracement of its May 9 highs. At the close, it came to rest atop a small trend line from May, seen in purple below.
  Futures traders had the luxury of being able to trade after the cash market closed. But, cash basis traders had to make an educated guess about how things would look 17 1/2 hours later. While VIX eventually dropped through the purple TL, it wasn’t until after the close on June 4.
Meanwhile, USDJPY had reached a channel line but was still just above its own .618 retracement, this one of its Jan 3 lows. The daily chart from that morning illustrates our forecast at the time. The 60-min chart, annotated as it was that day, shows how it actually played out. Instead of reaching the obvious support at 107.57, USDJPY began a bounce that lasted over two weeks before finally breaking down below the dotted white line. By then, ES was 236 points (8.6%) higher on the back of a breakdown in VIX that would see it drop by exactly 50% from 23.38 to 11.69. It’s borderline impossible to regard such precise moves as anything other than central bank intervention.
 As Federal Reserve Governor Heller observed 30 years ago, why buy the entire market when you can step in and support it with carefully targeted purchases of futures? Had he written the article in 2019, he would also have suggested derivatives and currencies.
Yet, Heller concluded his article with an admonishment.
The Fed’s stock market role ought not to be very ambitious. It should seek only to maintain the functioning of markets — not to prop up the Dow Jones or New York Stock Exchange averages at a particular level. The Fed should guard against systemic risk, but not against the risks inherent in individual stocks.
Heller wrote those words in Oct 1989 — after the market had recovered from the 1987 crash. Central bankers who survived the crashes in 2000-2003 and 2007-2009, both of which exceeded 50%, are considerably more pragmatic. As the ECB’s Mario Draghi has said countless times, “Whatever it takes.” The Fed’s James Bullard has proven to be equally uninhibited, as have many others.
I considered the above when suggesting on Tuesday that the downturn might be imminent, reasoning that if Trump were to rail on China (he did) it would be difficult for him to tweet at the same time about how well the trade talks were progressing. ES fell 54 points before bouncing for the third time at its yellow neckline.
Given the foregoing, let’s wade into the most exciting and humbling of exercises, the big picture forecast. We’ve been following an analog which worked beautifully from July 26 through Sep 18 or so. Is it still working, and what might it suggest about the road ahead?
continued for members… (more…)


 The market remains in maintenance mode — meaning only positive headlines are permitted to register.
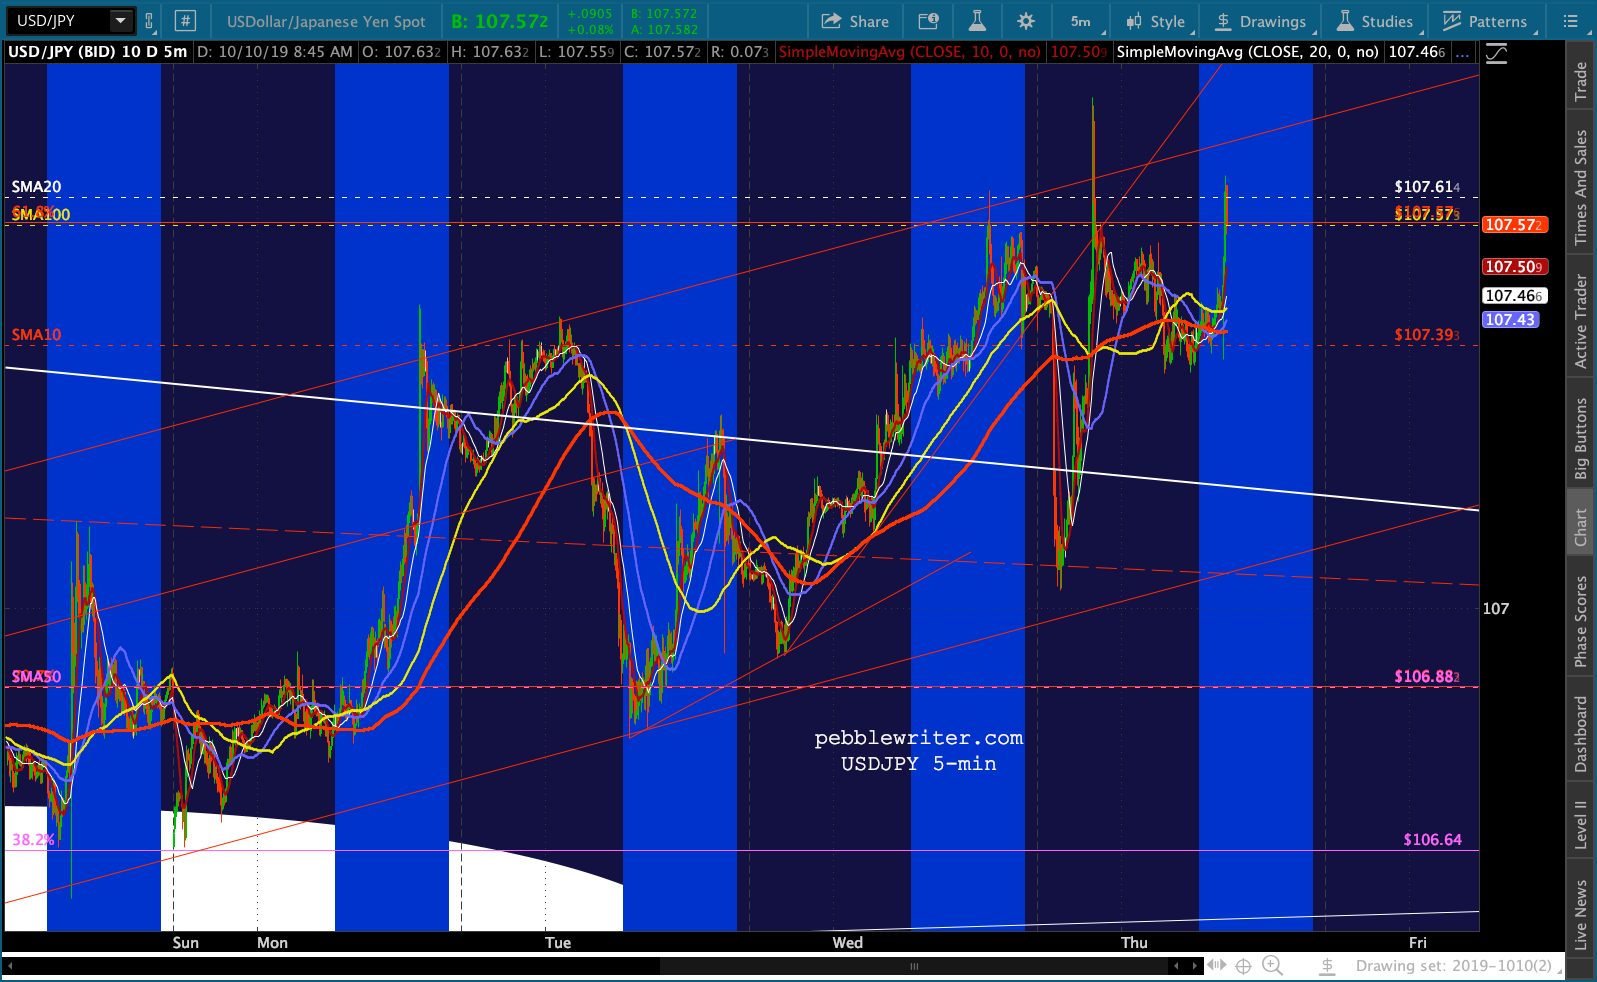
 Speaking of algos…USDJPY, CL, RB and NKD are all being pressed higher in service of stable stock prices. USDJPY, for example, has rallied into the close most every day and is shooting higher this morning to get ES back to green in time for the open.
 VIX, of course, remains under heavy pressure. Every attempt to break out has been hammered back below a recently-completed line in the sand. It’s silly, but it’s enough to impress the very impressionable algos.
 Naturally, the financial press remains focused on basketball.


