

If you blinked, you missed yesterday’s 25-pt correction and 33-pt recovery during Powell’s testimony.
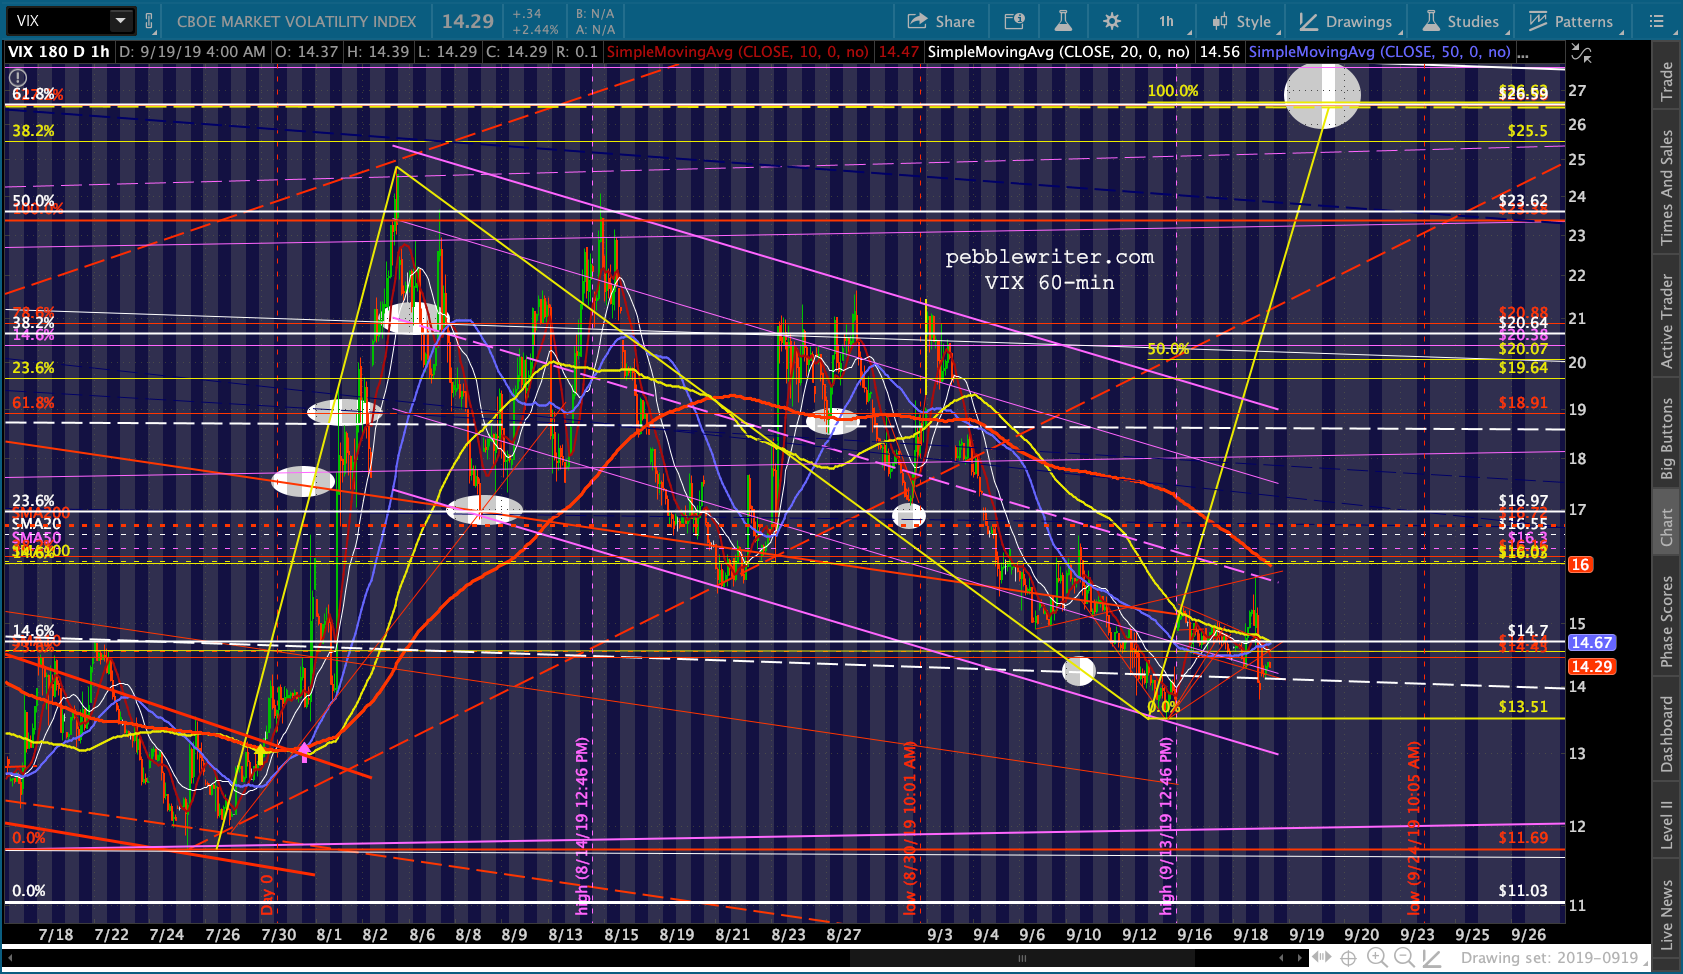
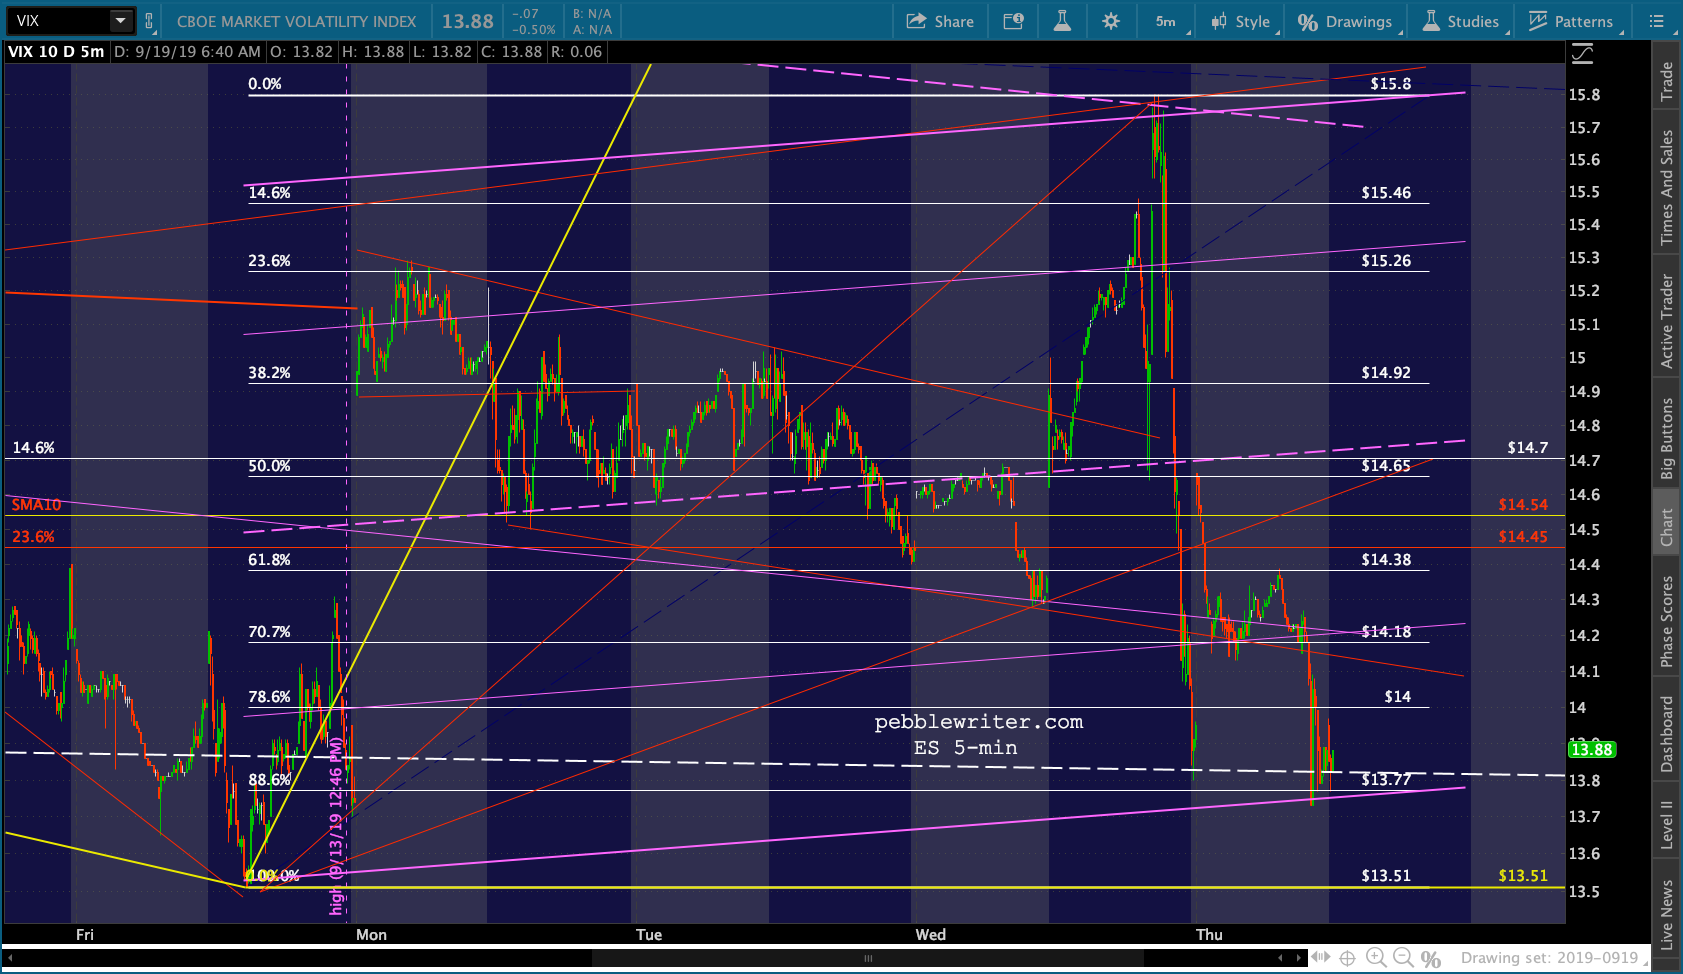
 It was made possible by an equally speedy 8% spike and reversal in VIX. The selloff continued overnight and VIX is now testing an important channel line for the second time.
 SPX/ES have very little room to go on the upside before bears run for the hills. Should be an interesting next few days.
continued for members…
The key charts to watch today are the same as yesterday. If VIX’s .886 or lows hold today, the bears are still alive. If not, we’re looking at a retest of the 3020.42 highs, the 3027.98 highs, or the 2.618 Fib extension at 3047.34.
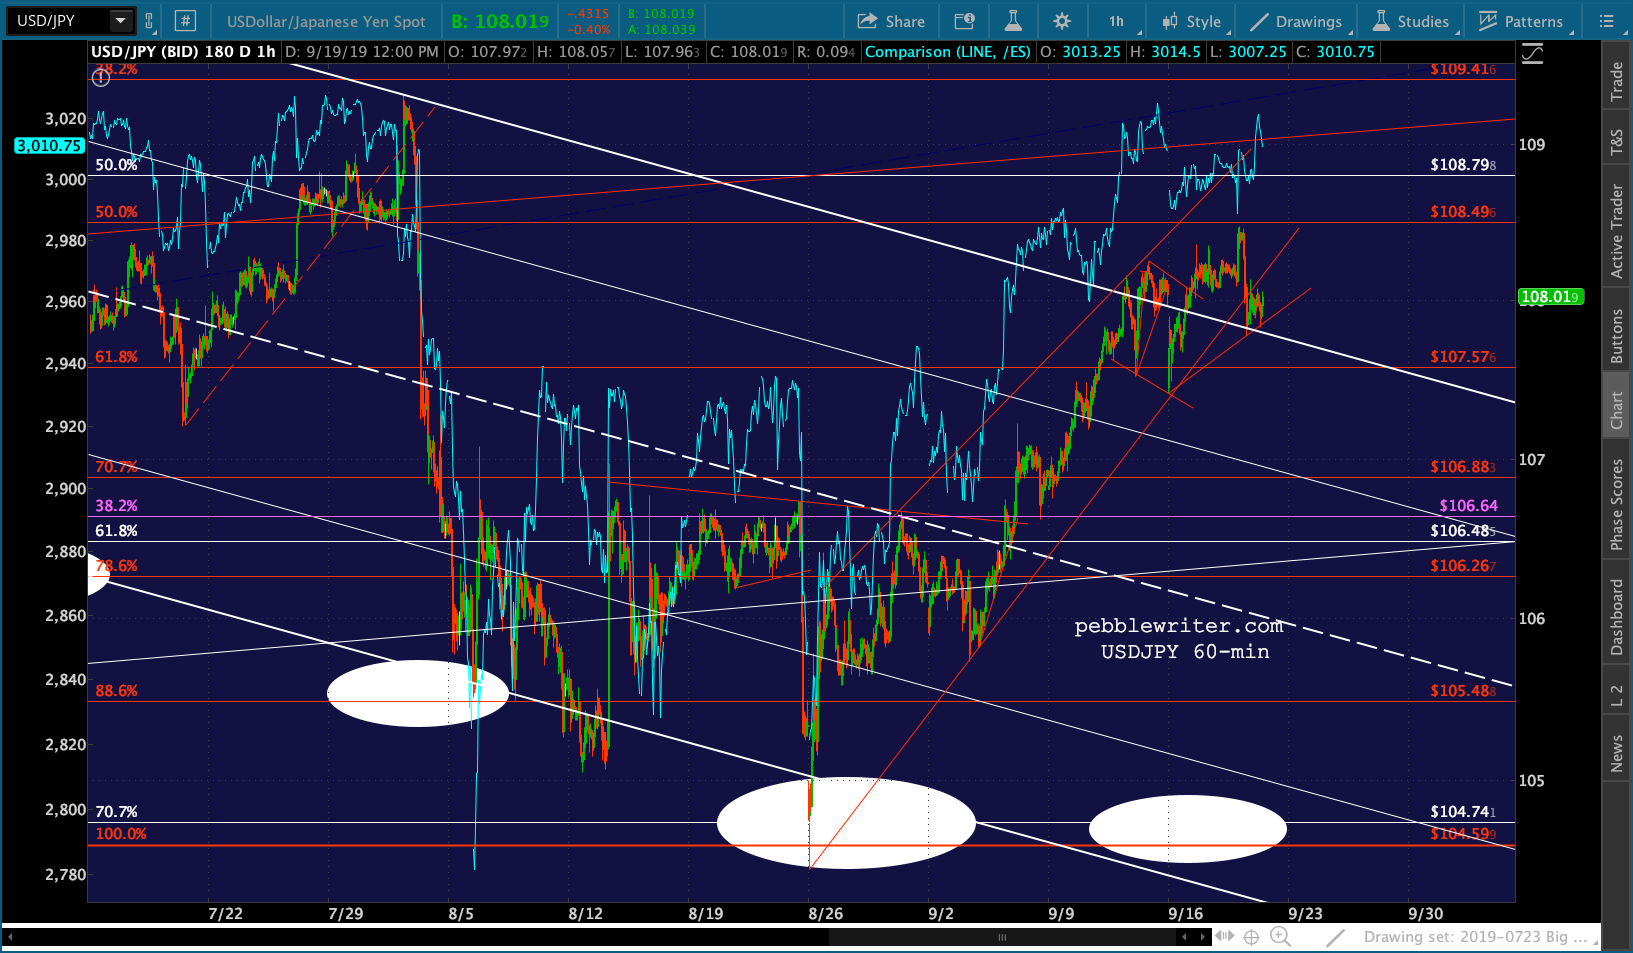
 On the daily chart, USDJPY has broken out and is backtesting.
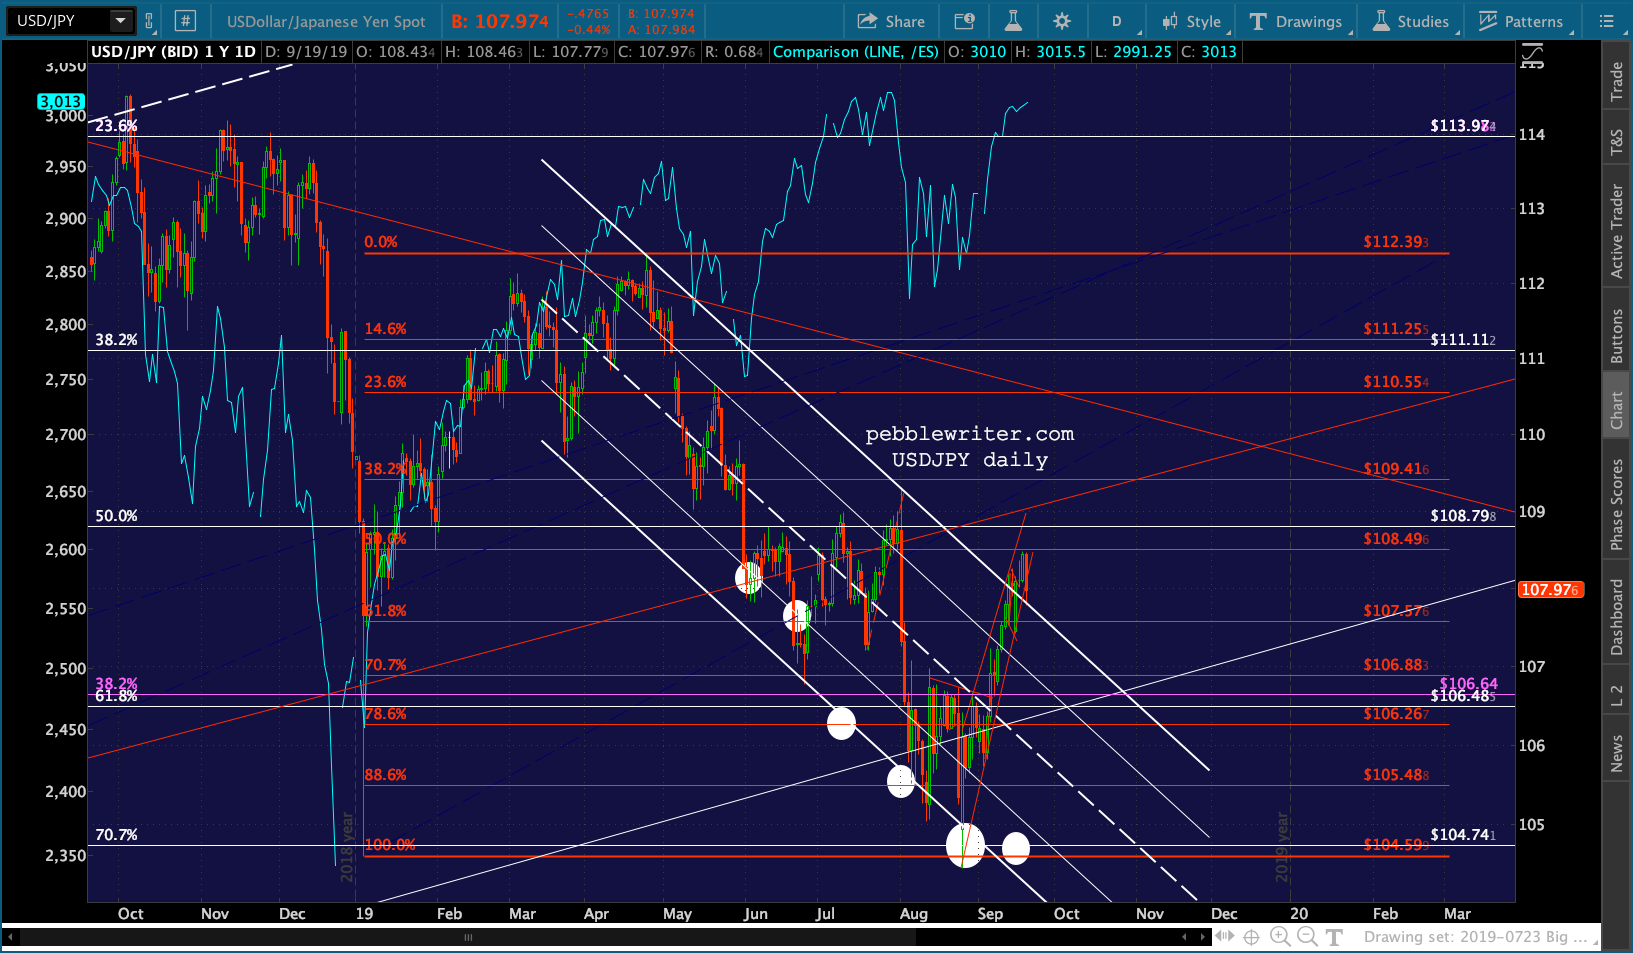 On the hourly chart, though, it appears to be breaking down — this, after the BoJ did no new easing.
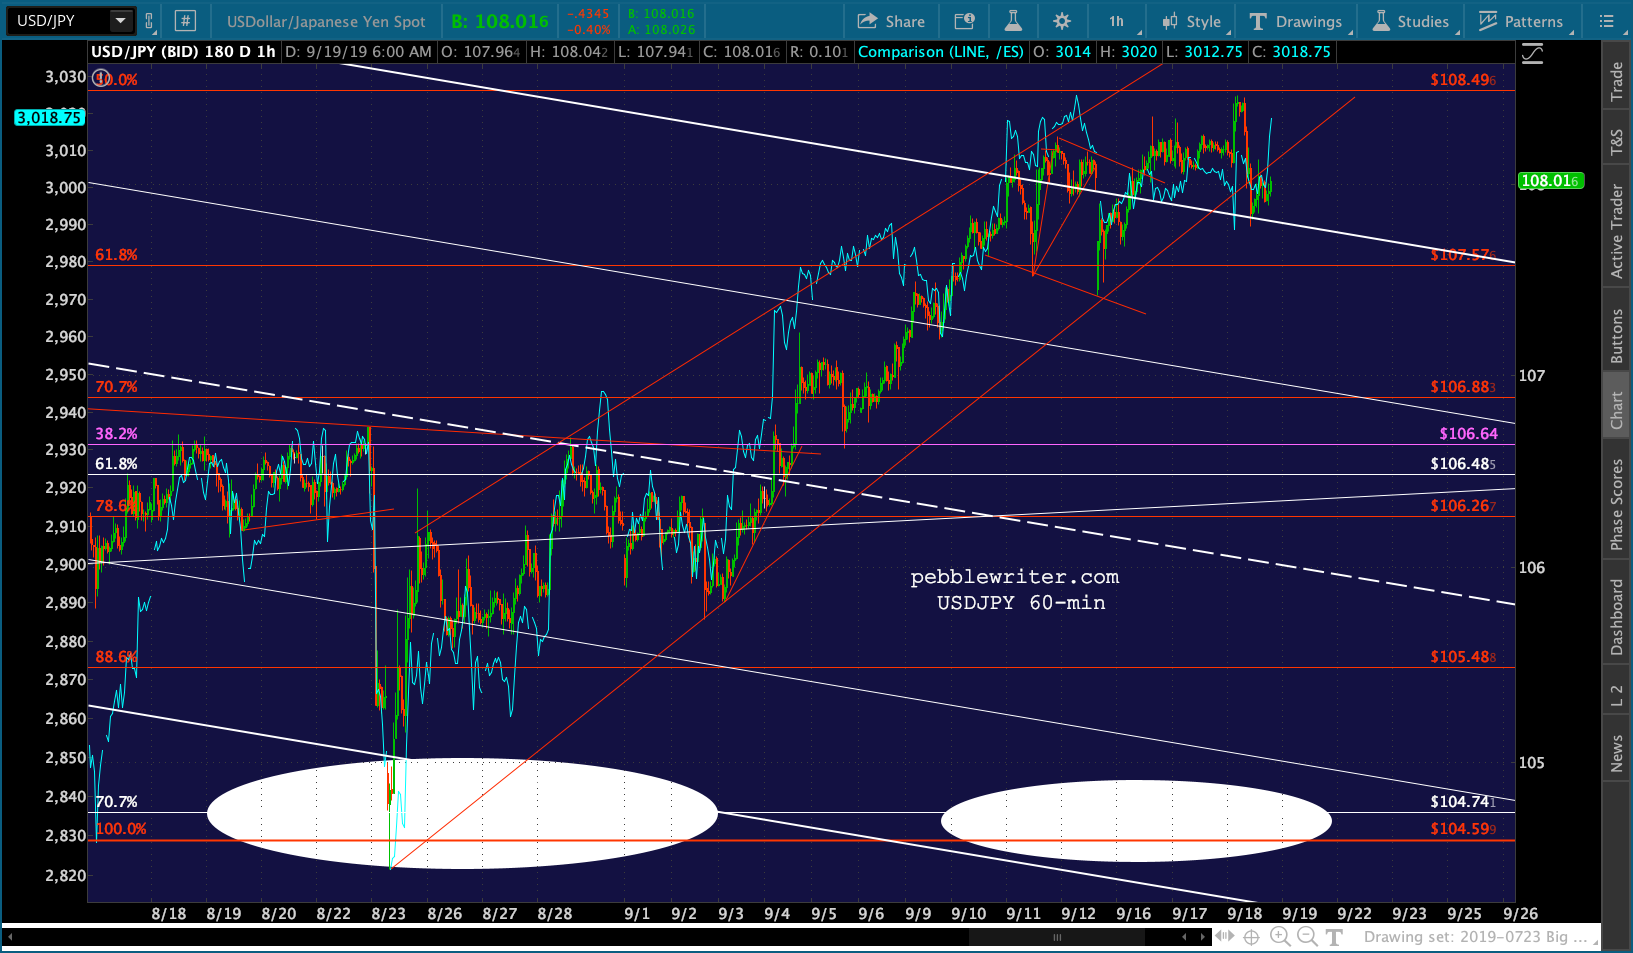 This is the critical moment. SPX is as high as it can go without triggering a likely breakout of sorts. For those not already short, its proximity to obvious stops make it a pretty easy place to try.
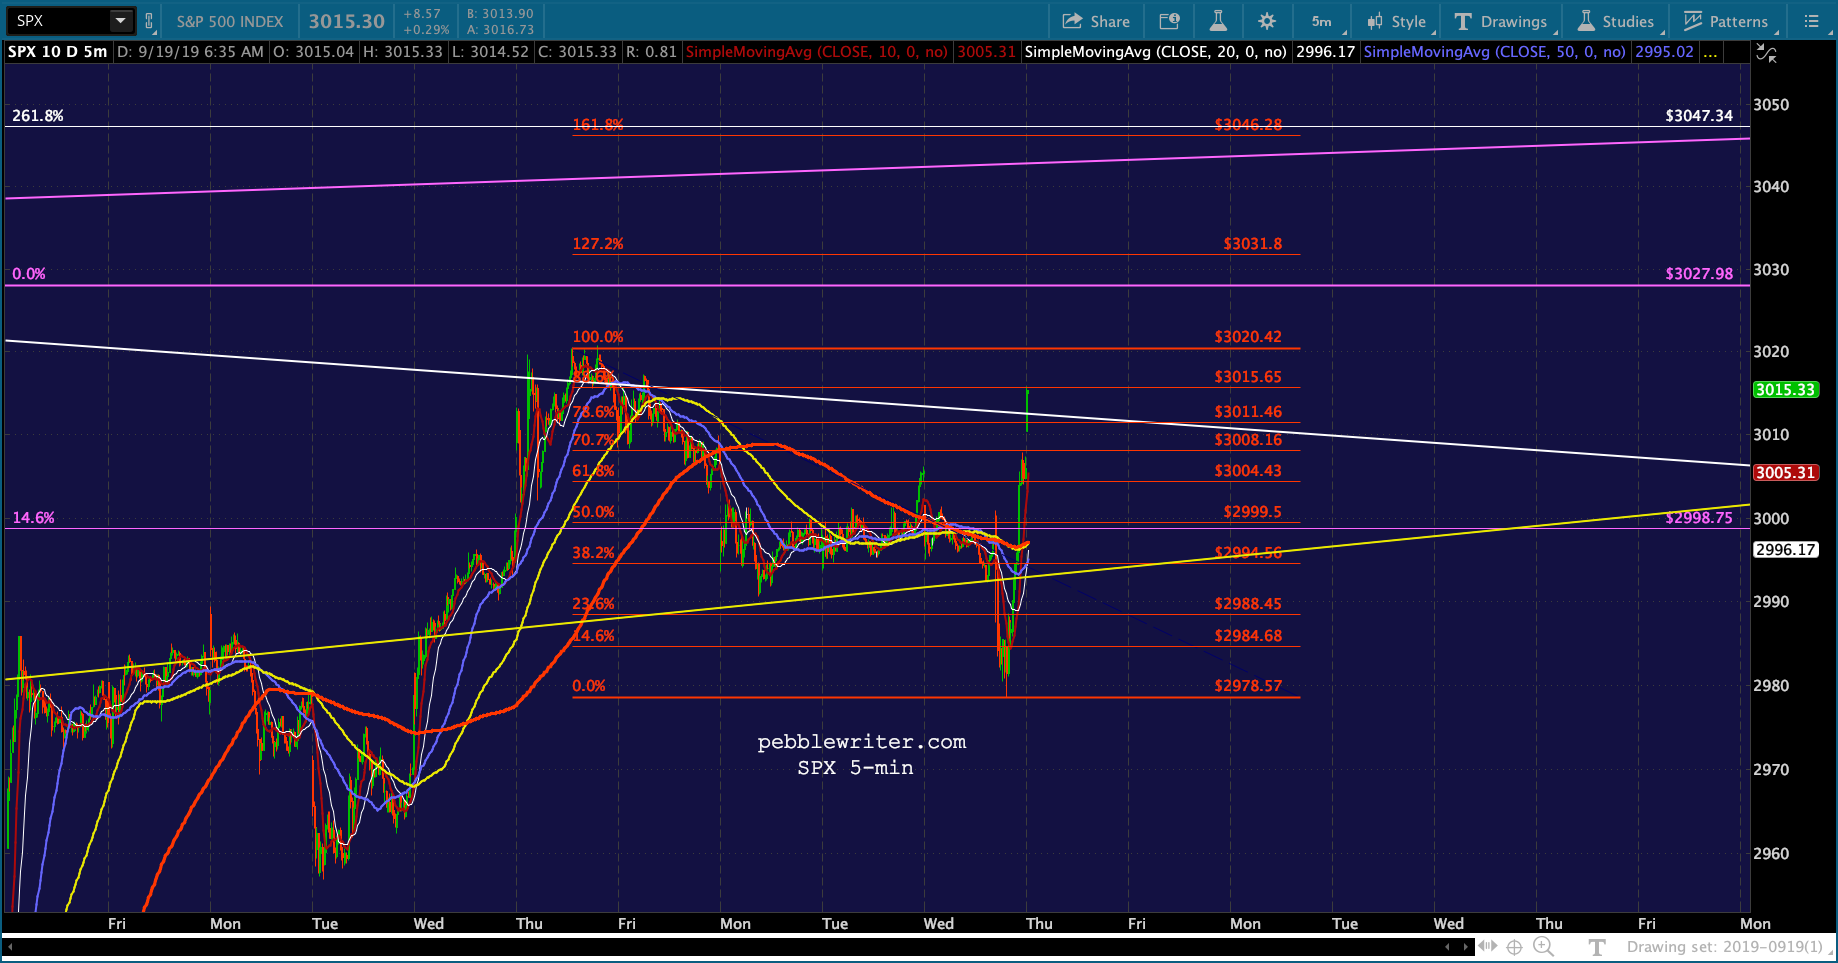
 UPDATE: 3:30 PM
ES has reversed nicely and is almost back to red on the day as it approaches its SMA5 200. 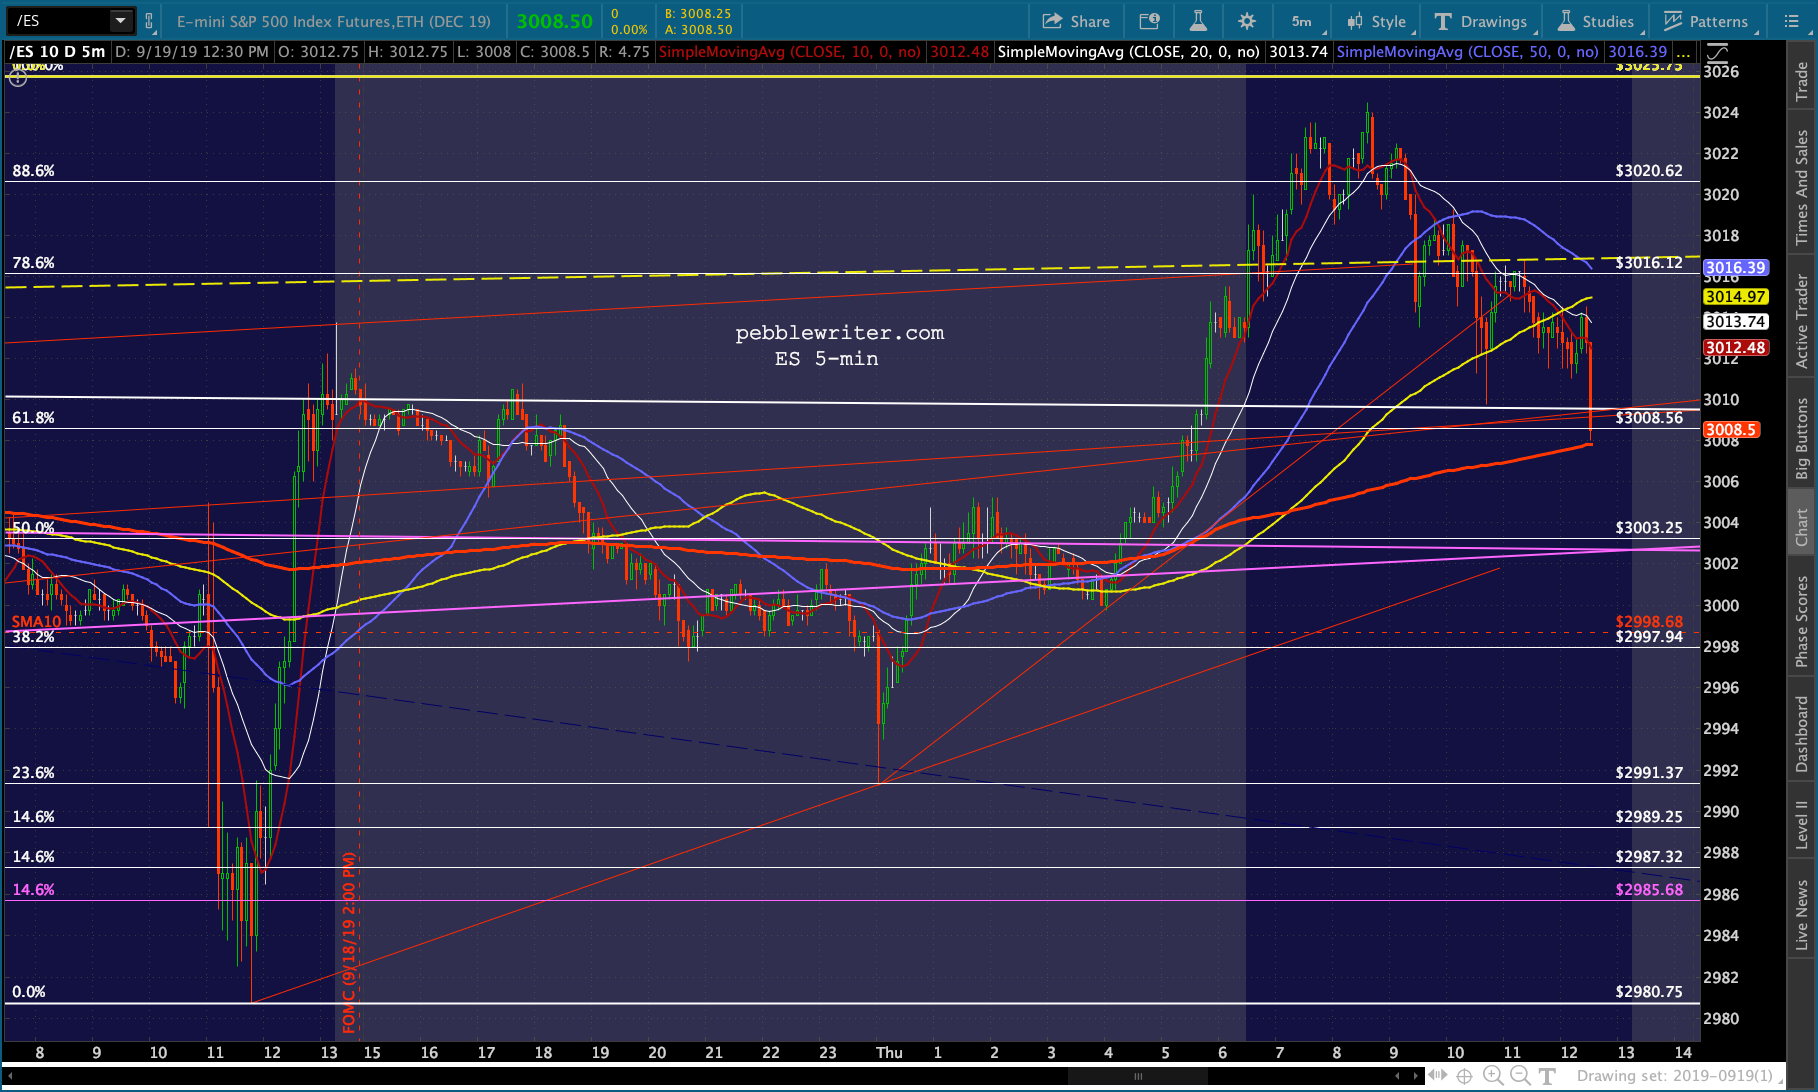 This, as SPX closes this morning’s gap and approaches its own SMA5 200. In other words, the first decent test on the way back down.
 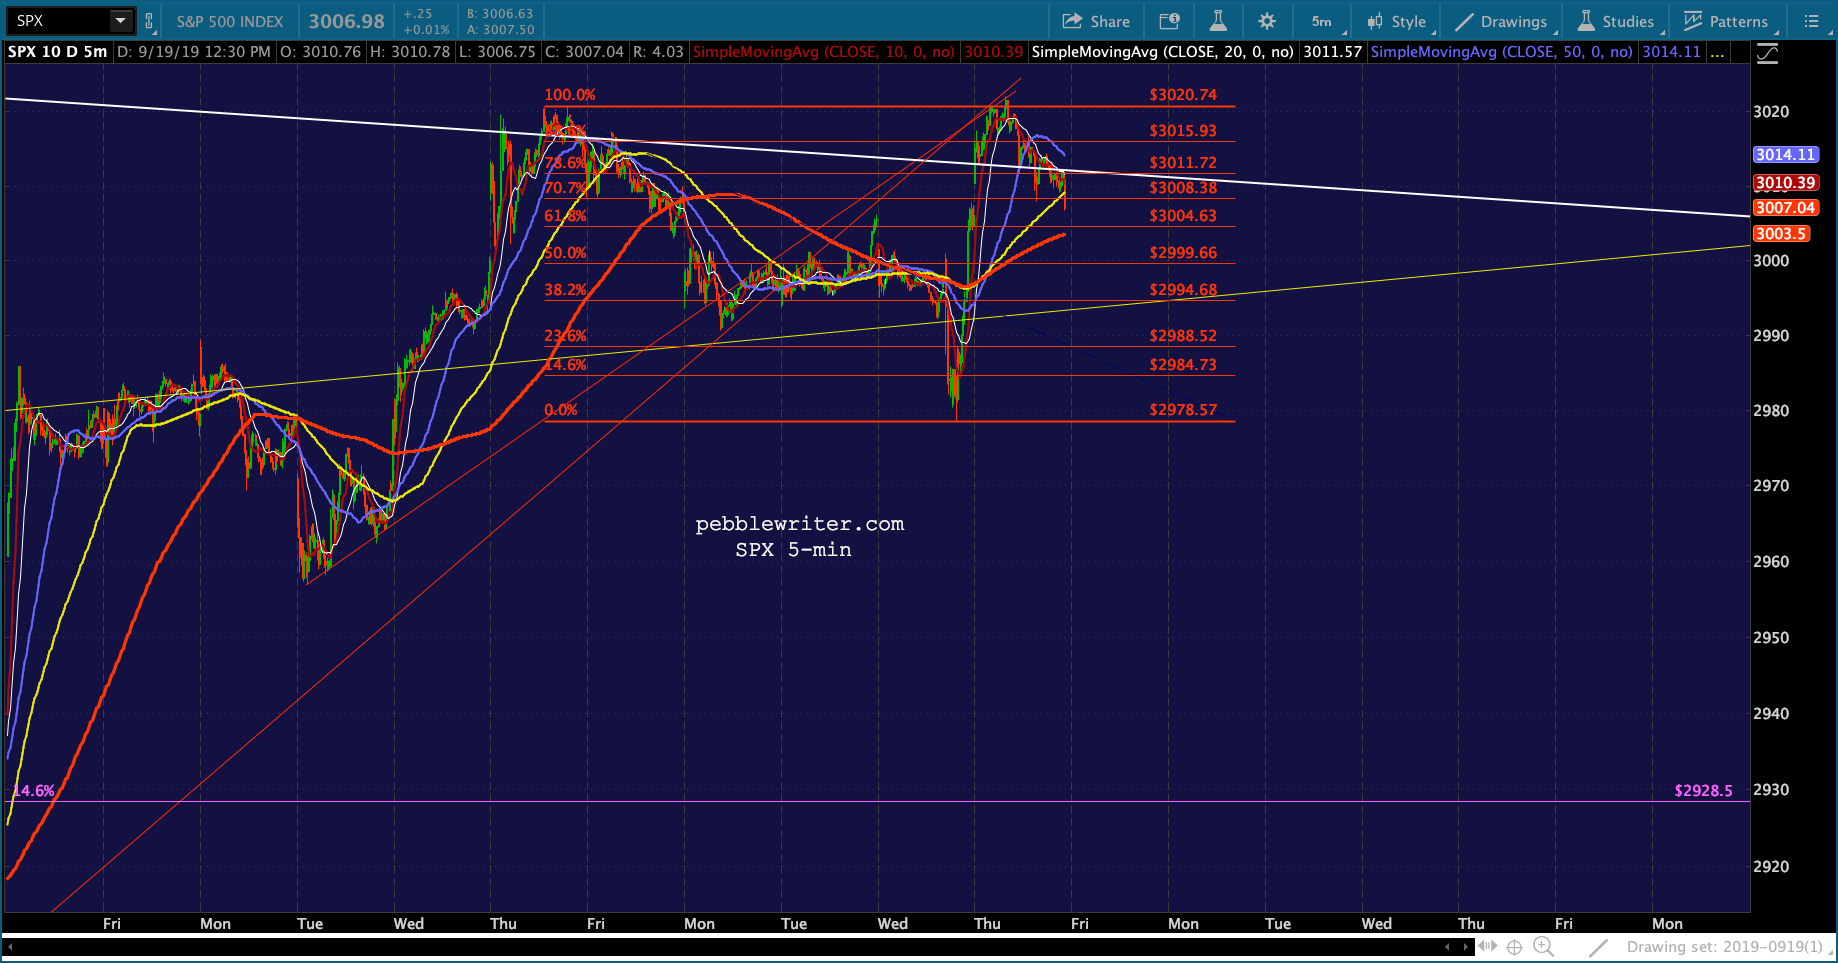 Note that SPX halted at a backtest of the TL from Aug 23.
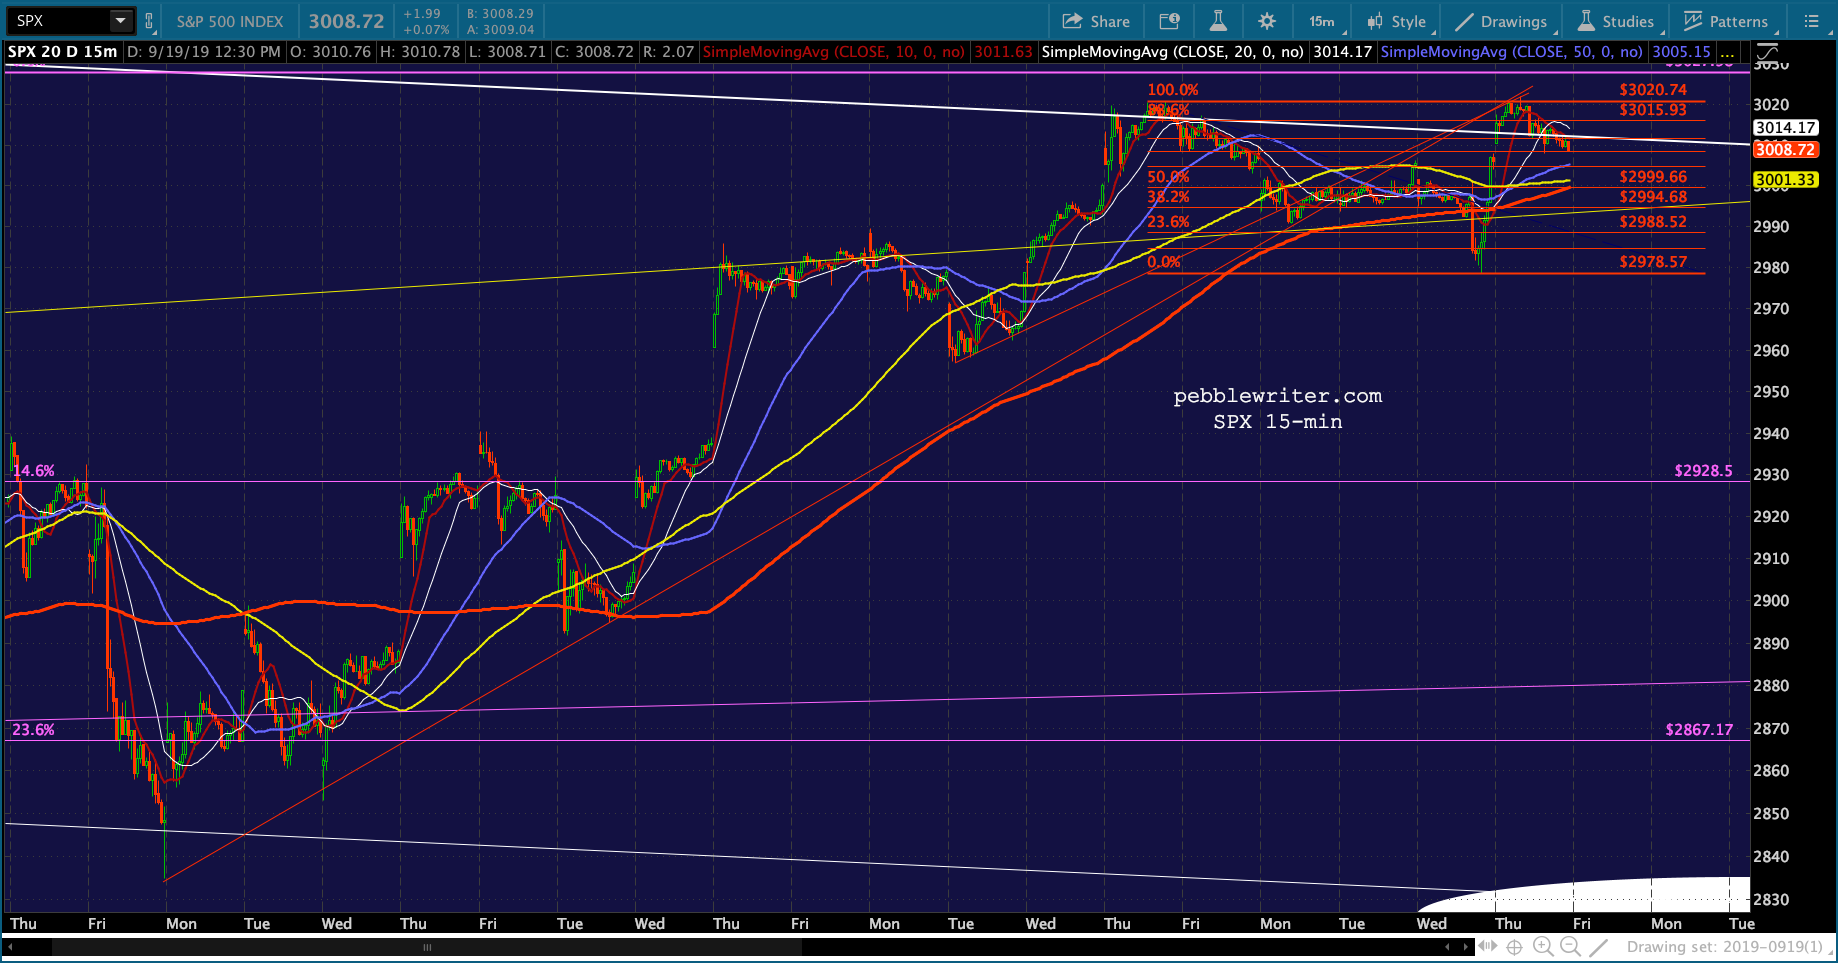 I’ll not be shocked if we see a bounce here. A failure to bounce, on the other hand, would be excellent news for the bears.
USDJPY is trying not to break down, but its red TL from Aug 25 has clearly broken — great for the bears.
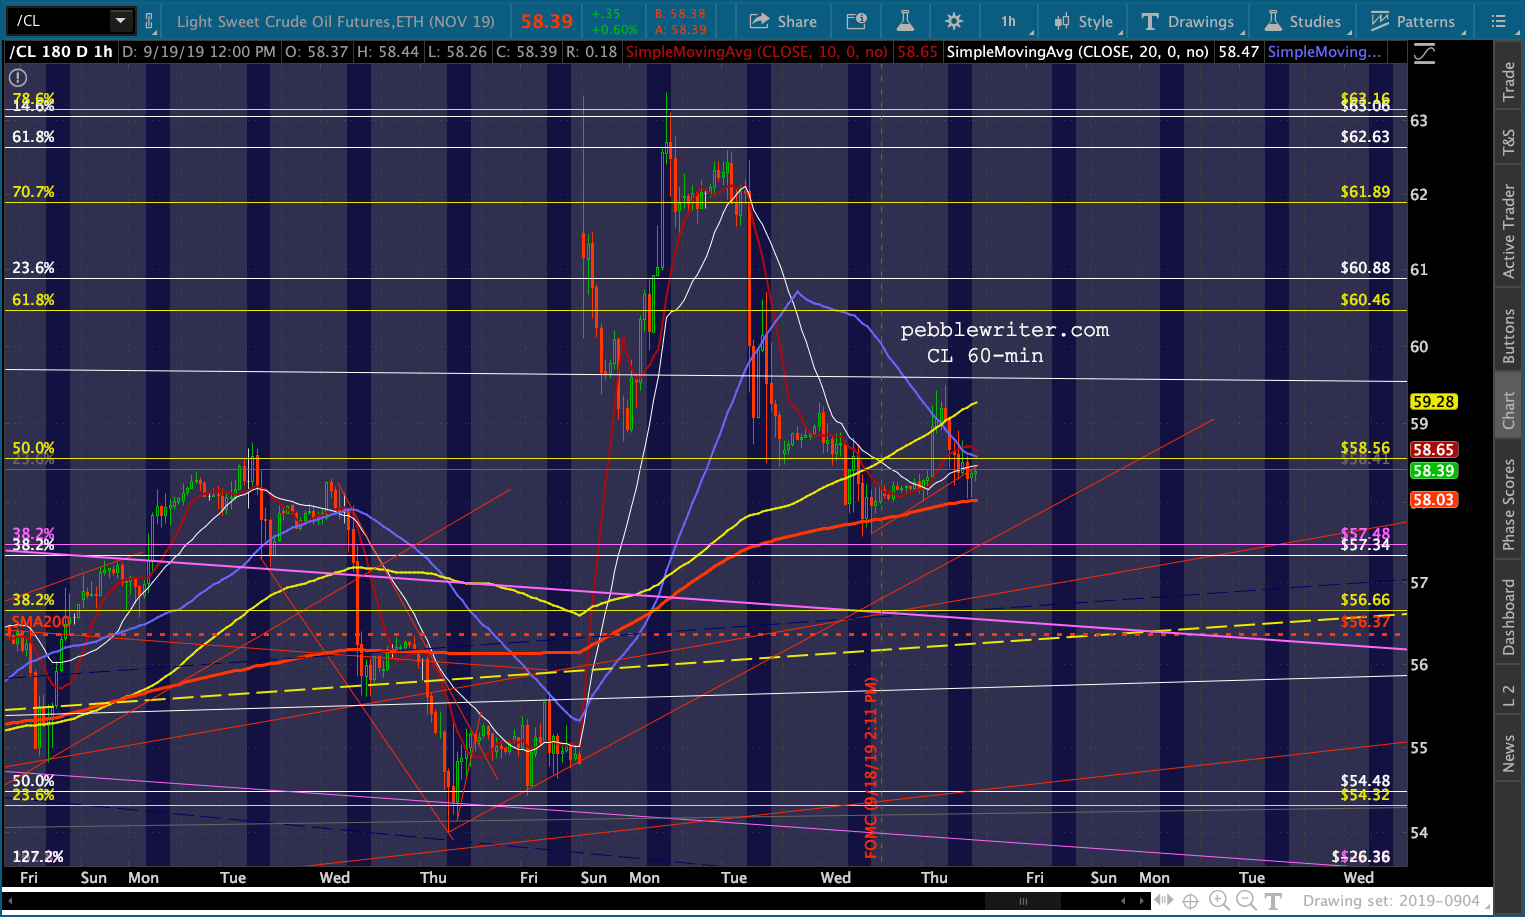
 Likewise, CL broke the little TL from yesterday…
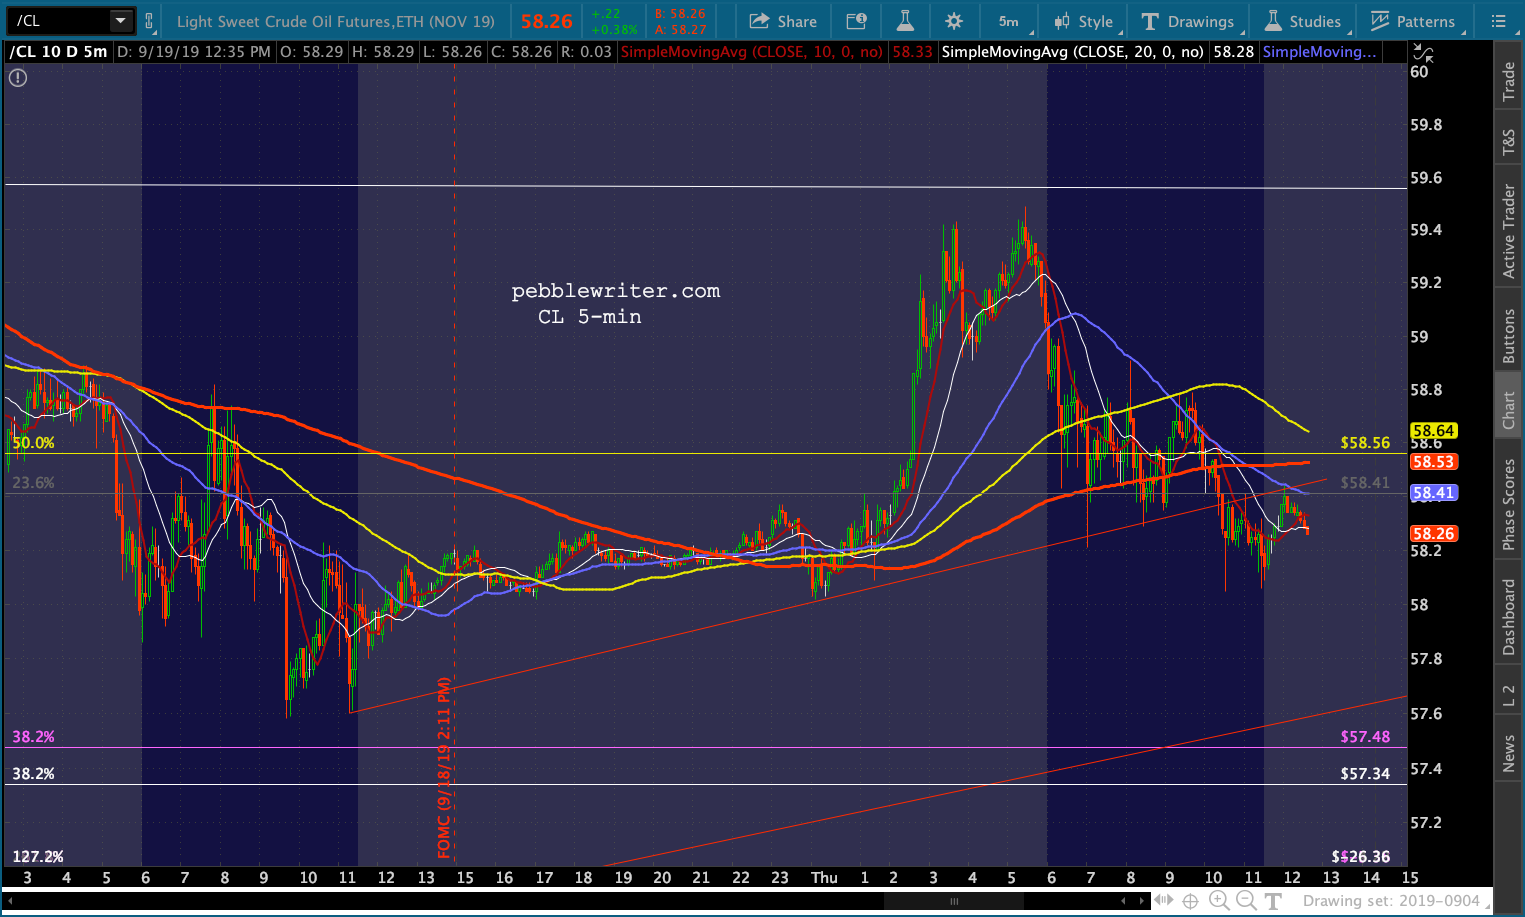 It’s not much, but it is a good signs for bears that CL didn’t ramp higher to push stocks to new highs — something I would have expected if new highs were in the cards.
 And, VIX is just bumping along, unable to lend much help to bears but at least finding a bottom and getting a nice little bounce.
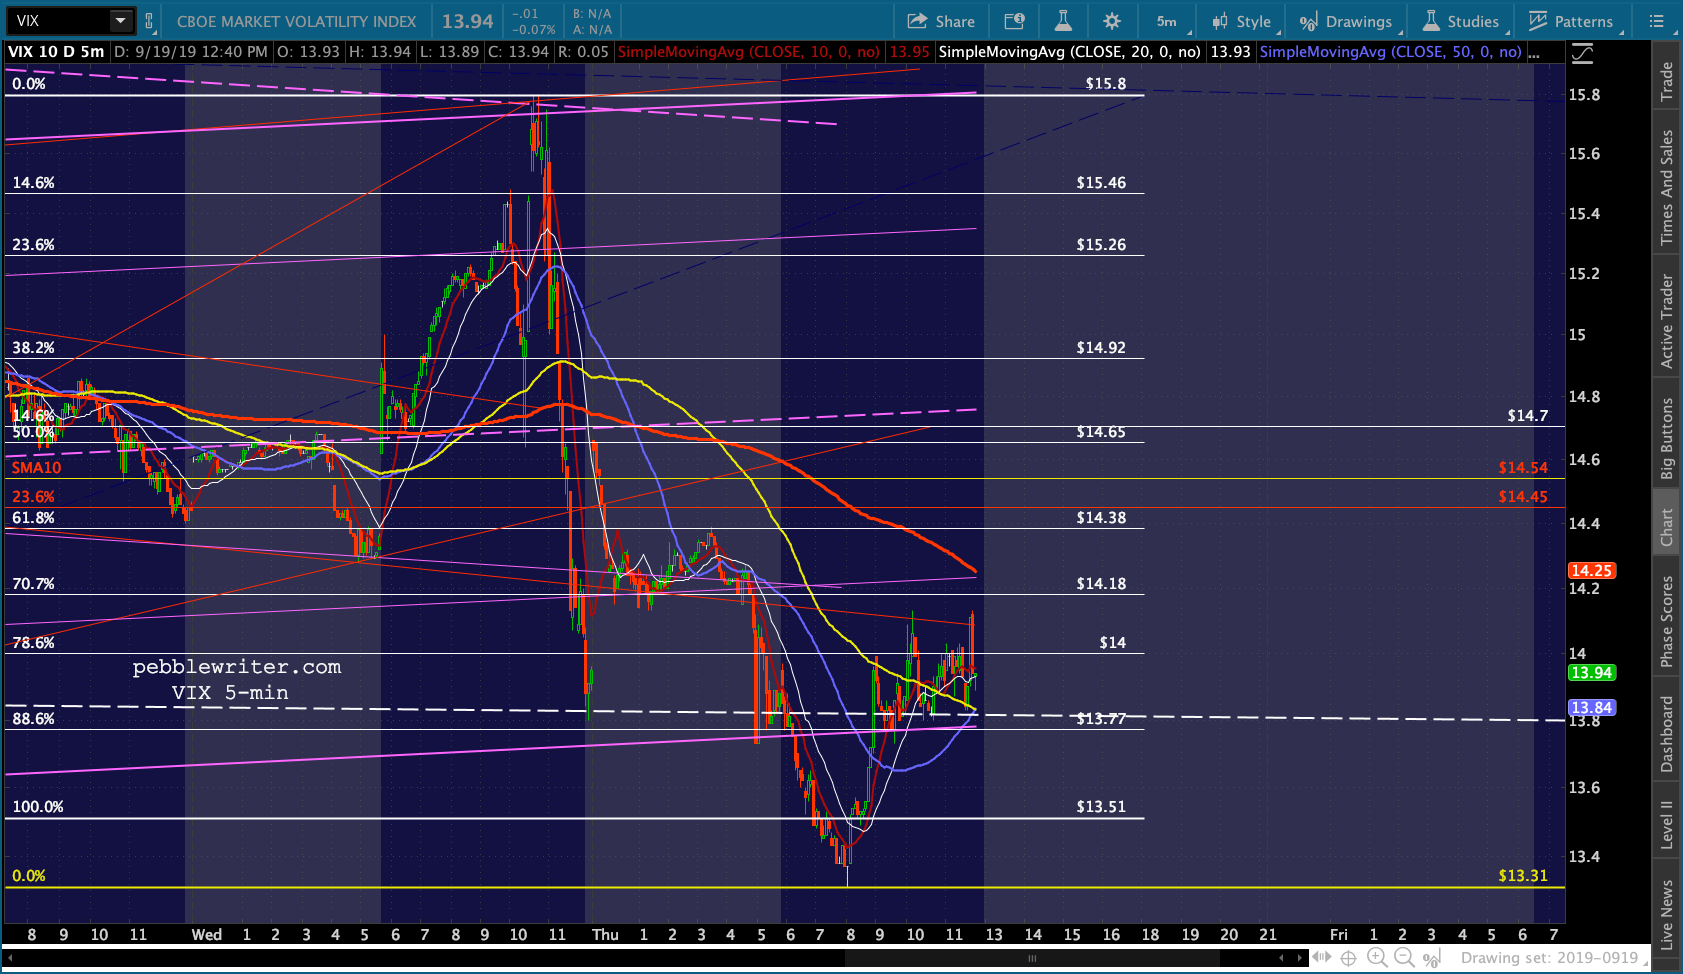 UPDATE: 15:52
This is an important test for SPX, which has now dropped below where it traded prior to FOMC day. Also good news for bears, the TL connecting the intraday highs, which is parallel to a TL connecting lows from last week.
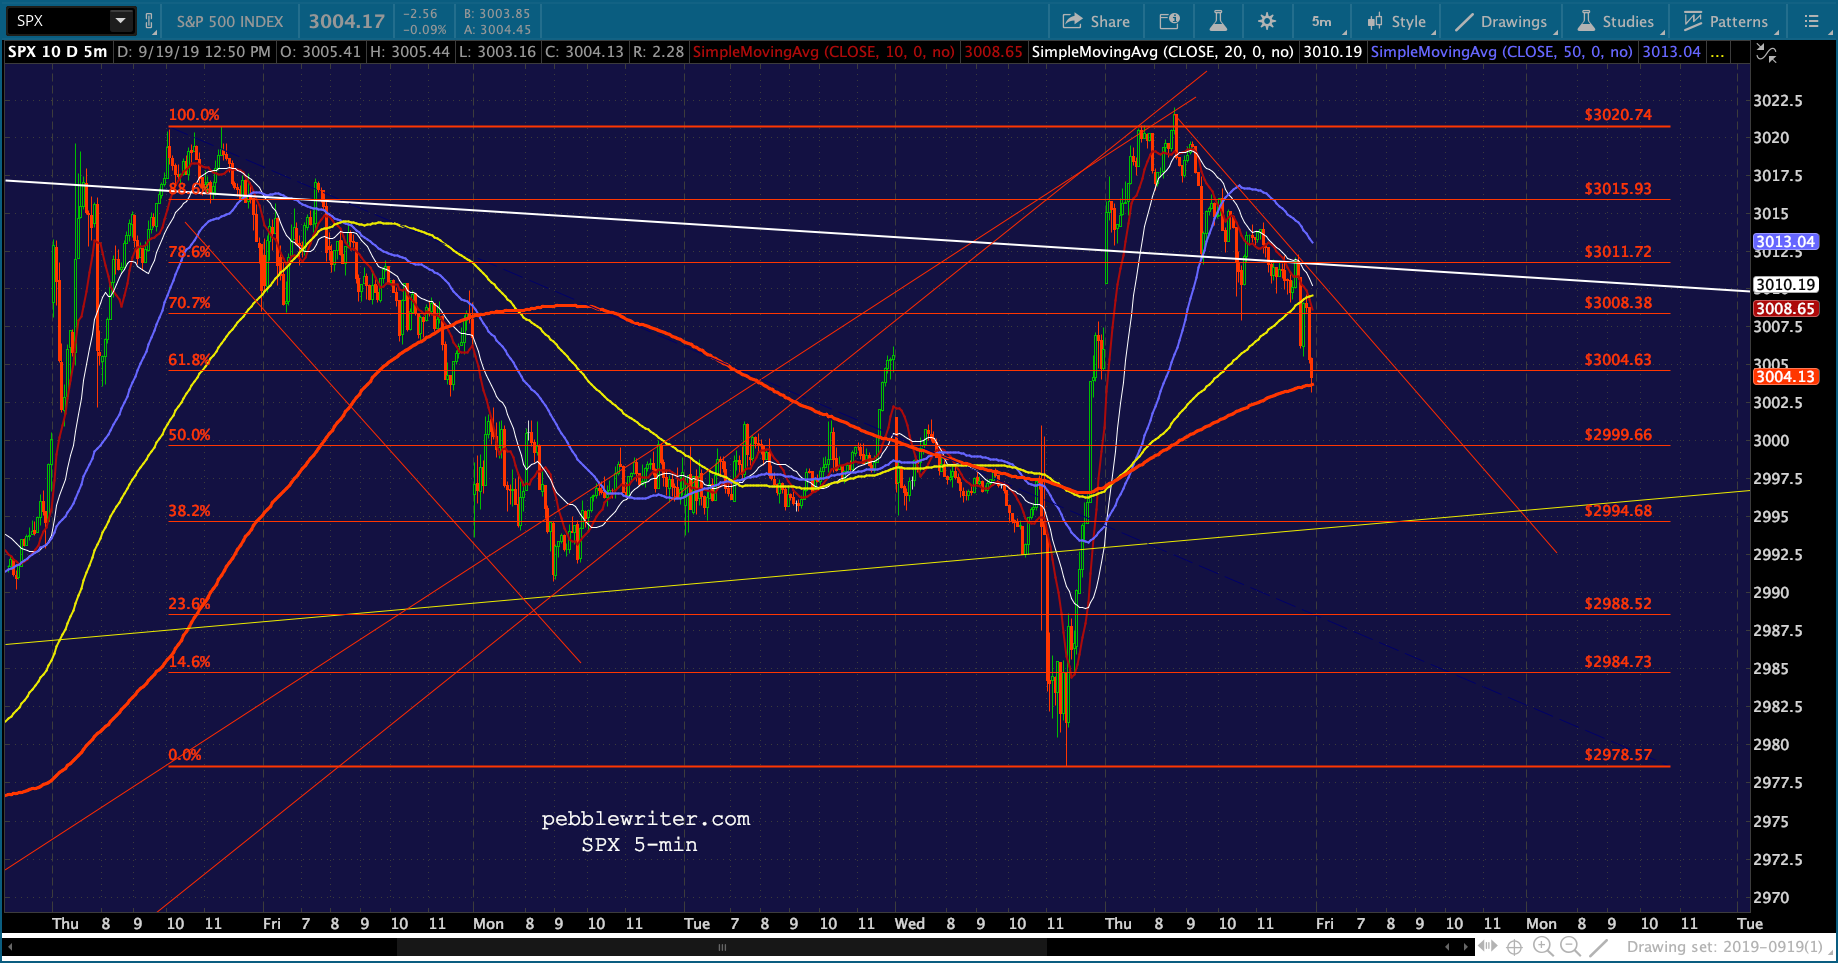 When we connect parallel TLs, of course, we get a channel that takes us down to a big gap at 2940ish.
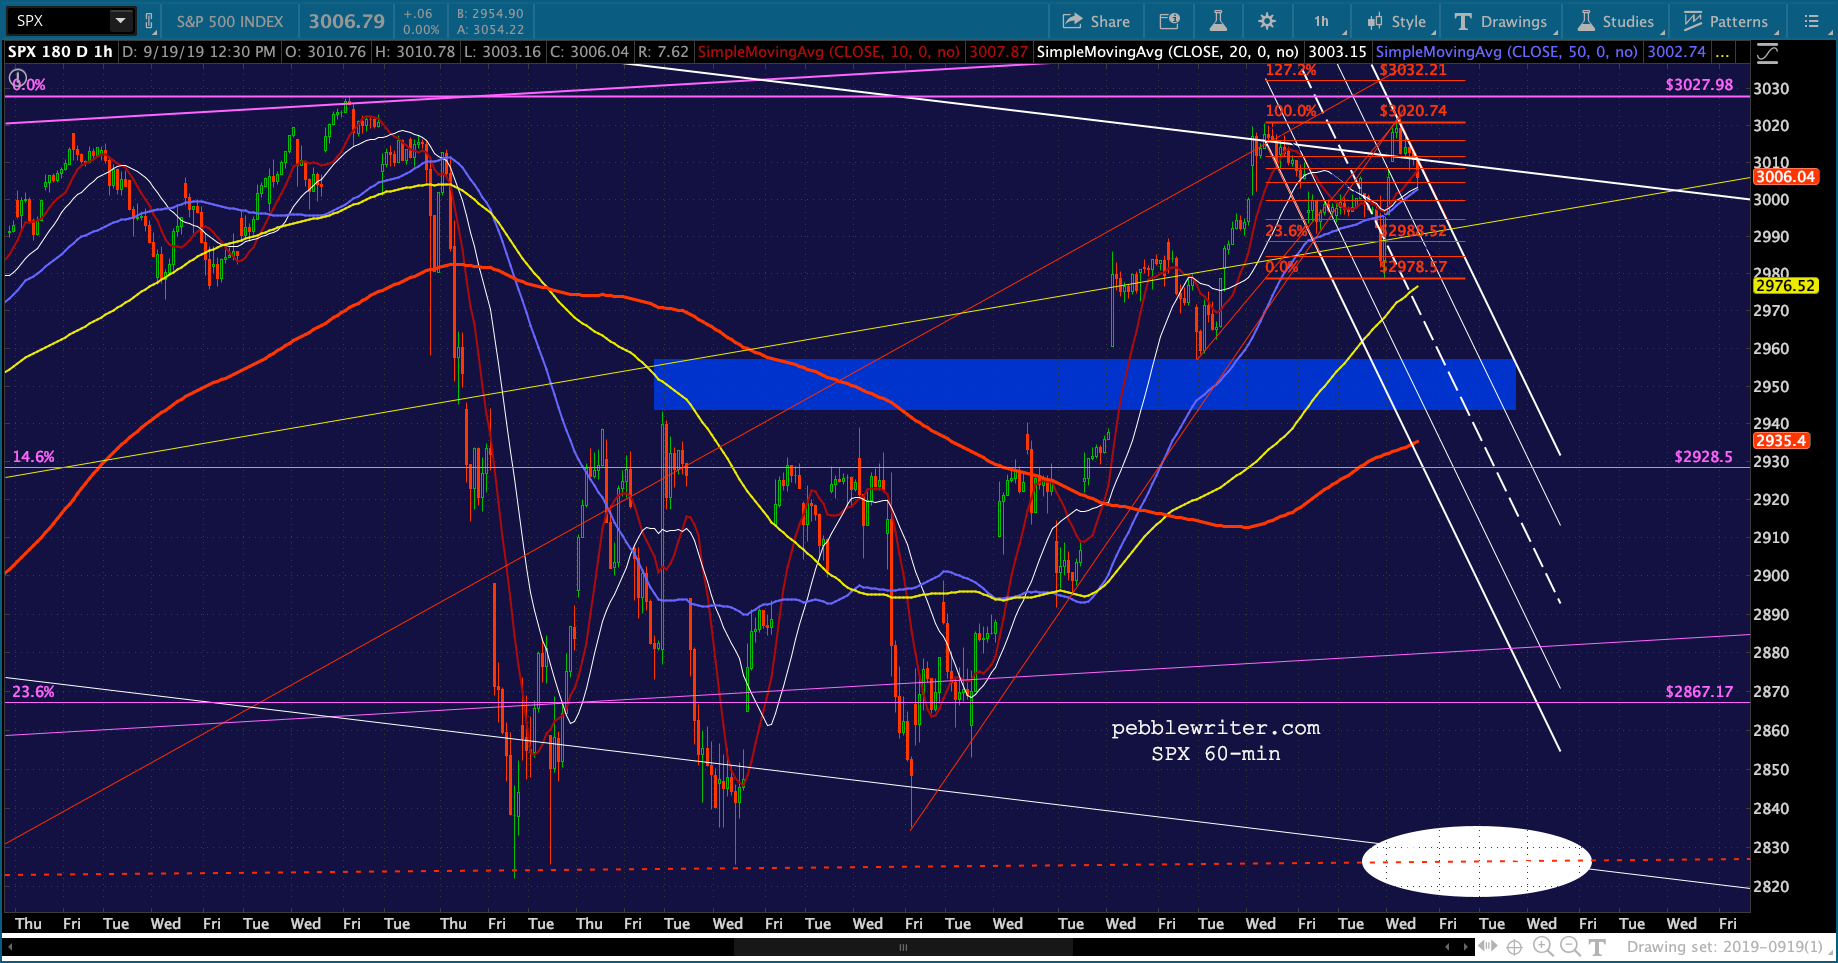 This is a very interesting gap, as it also contains the SMA20 and SMA50 at 2952.41 and 2951.56 respectively.
If the gap and SMAs don’t hold, the next serious support is the SMA200 and horizontal support at 2824 (the white dot.)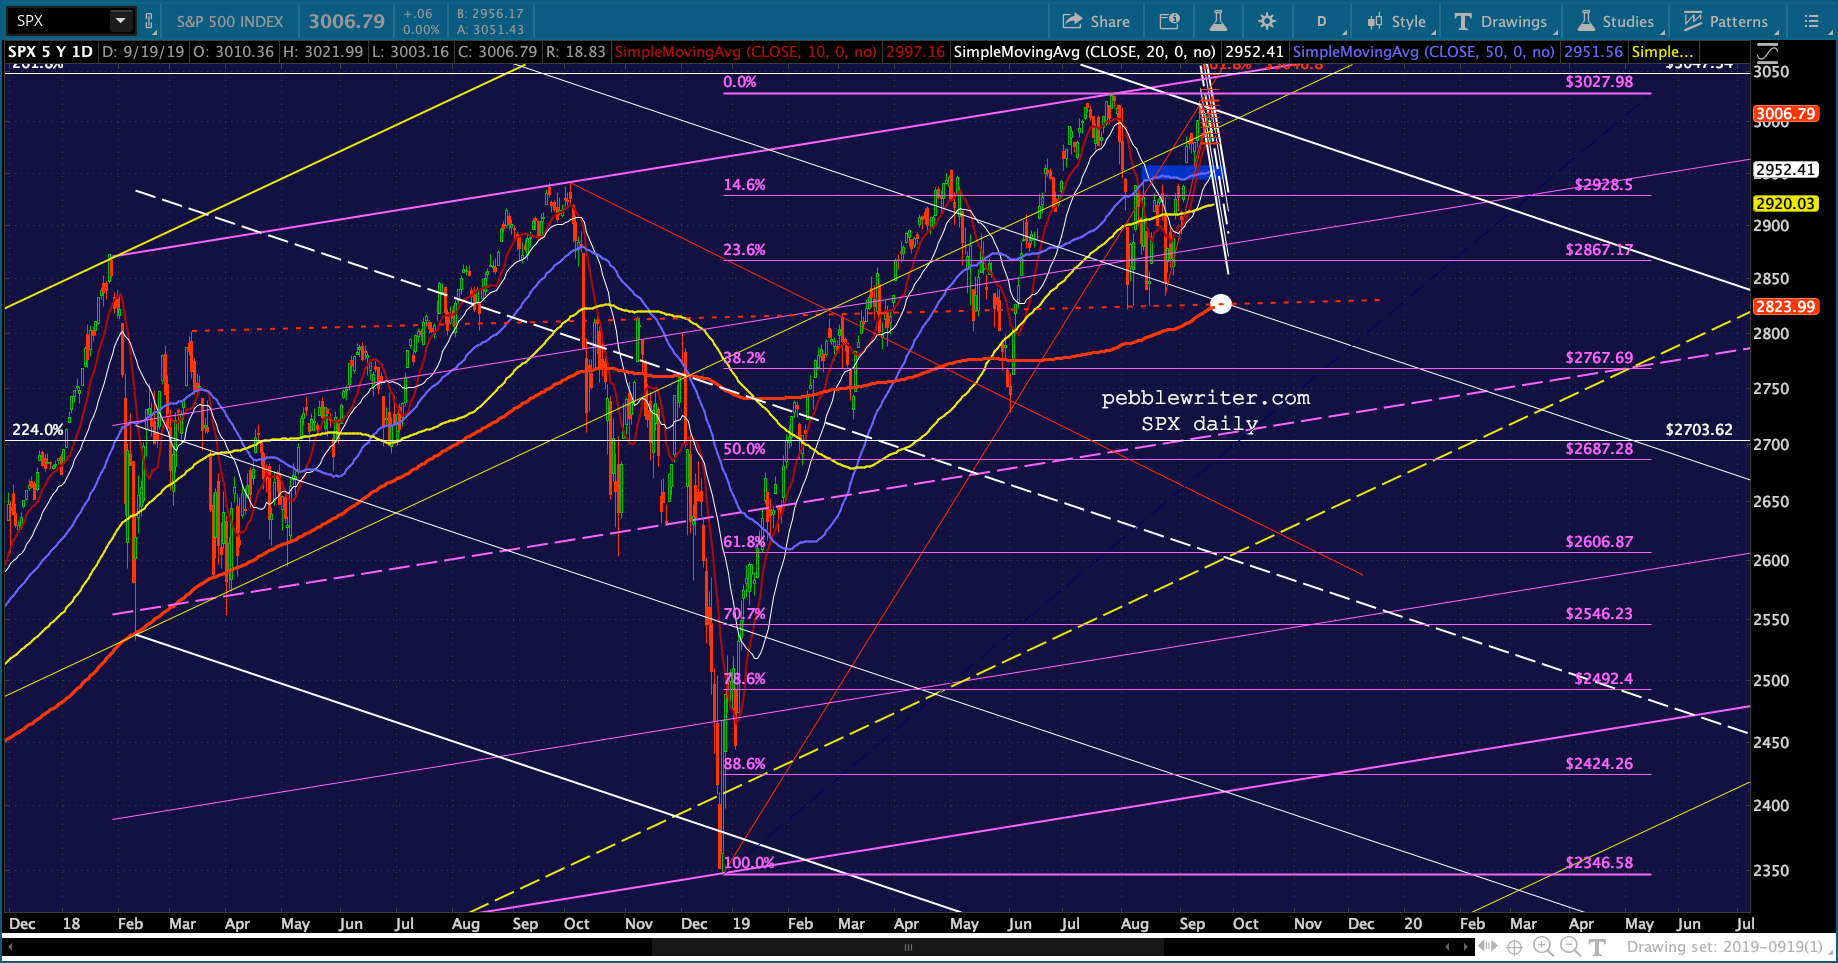 The SMA200 (actually 2823.99) is now slightly higher than the Aug 5 low of 2822.12 and could be tagged without making a lower low — something we’ve talked about many times. If the bounce ended at today’s 3021.99 highs, however, the C=A target is down at 2816.13 — a lower low.
A lower low at 2816ish, sometime in the next session or two (preferably no later than Sep 25), would make for a nice corrective A-B-C wave. A higher low would suggest, at least, that SPX pop up past 3027.98.
to be continued…