

The last time I felt compelled to use this title for a post, SPX plunged 105 points off its intraday highs within the next 24 hours. This one should be more violent.
* * *
All the talk about the necessity of a 50 bps rate cut (100 bps according to the president) got me to thinking about the history of such a drastic move. What were the circumstances under which the FOMC cut rates by 50+ bps in the past, and how did they stack up to today’s?
First, a quick history lesson. There have been seven such cuts since the tech bubble burst in 2000-2002. As the chart below shows, they all took place in 2007 and 2008 during the Great Financial Crisis. Most of them took place after the S&P500 had dropped precipitously from its October 2007 all-time highs.
 The cuts, along with a handful of the more significant events occurring at the time, can be seen in the chart below.

The only 100 bps cut was in December 2008, a few days after QE1 was launched. By then, the S&P500 had plunged 45% from its highs. Q3 GDP had contracted -2.1% on its way to -8.4% in Q4. Almost 900,000 families had lost their homes to foreclosure and unemployment was 7.3% on its way to 10%. No one doubted the nation was in crisis.
As of Friday, the S&P500 is 1.6% off its all-time highs. GDP has grown 2.0% over the past year. Unemployment is 3.7%. I can’t remember the last time I saw foreclosure headlines. Interest rates are at historic lows, and the president insists the U.S. economy is “the best it has ever been.”
Is it really the right time for a 50 bps rate cut?
continued for members…
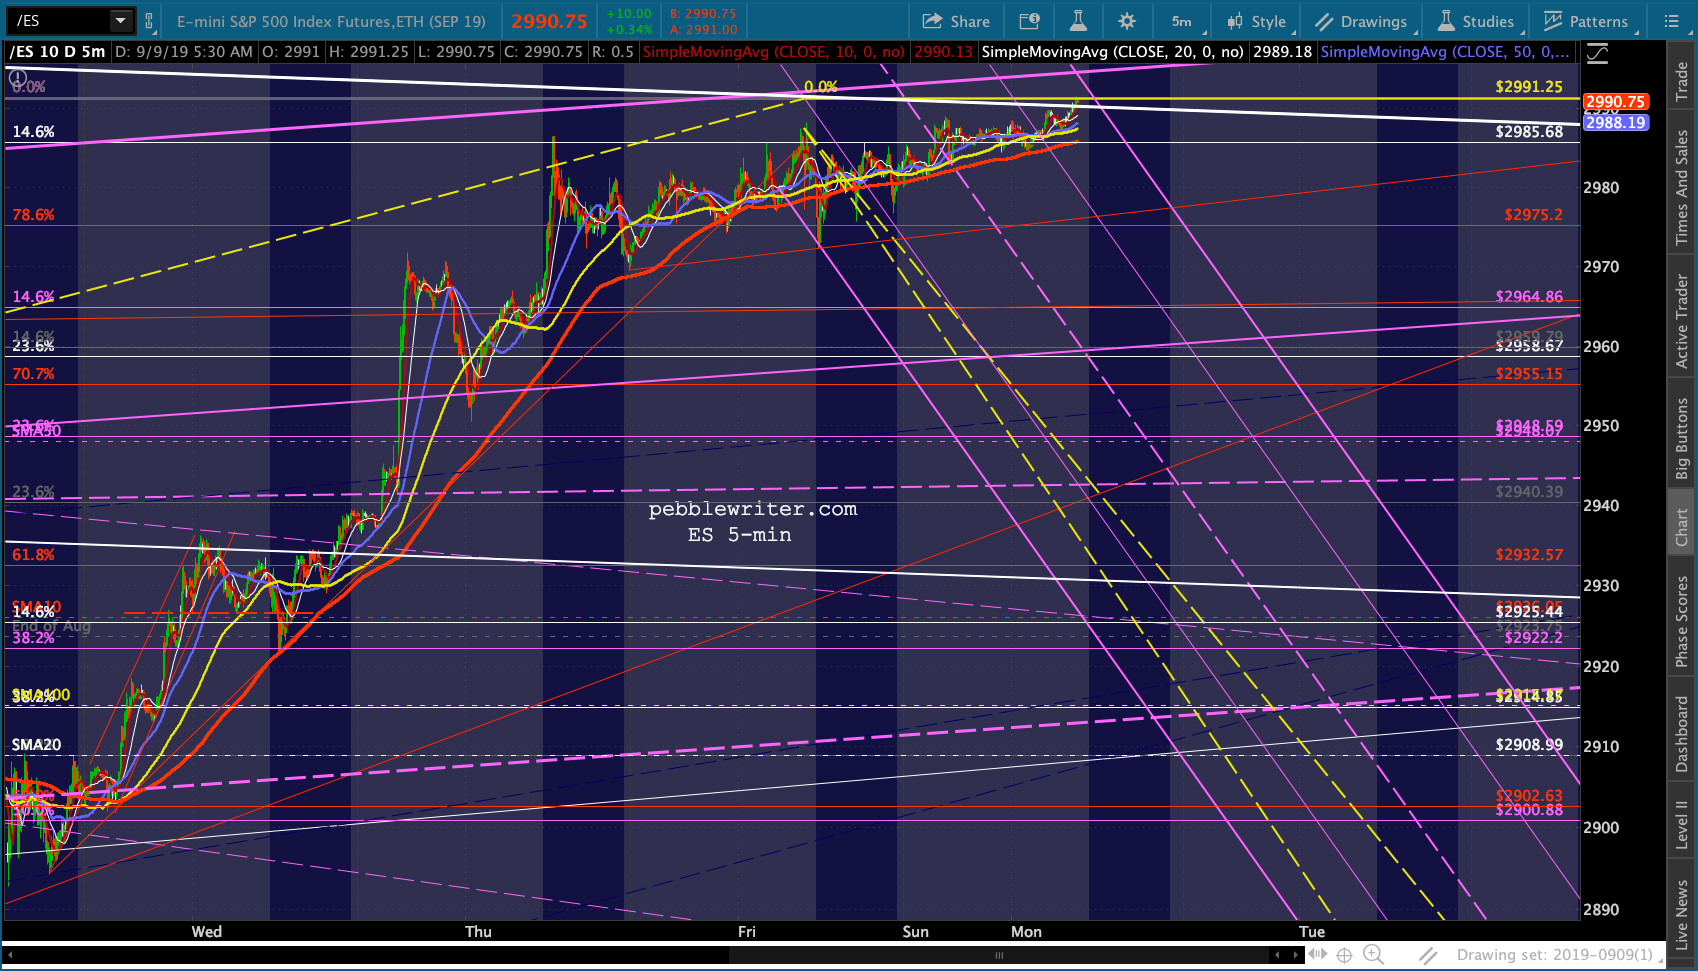
Futures are putting the screws to our analog this morning, with ES indicating a 10-pt gain and SPX closing Friday at only 8 points below its Thursday highs.
 The analog is already stretched from a timing standpoint and certainly doesn’t need a further delay in its next downturn which, ideally, would conclude on either Sep 11 or 13 — just in time to pressure the FOMC into cutting rates.
 Everything is arranged quite nicely for an A=C decline to our targeted new cycle lows.
 One issue is that the NKD broke out overnight on expectations of more heroic intervention by the BoJ. But, the last time NKD broke out it was a total head fake, coming just before SPX’s 205-pt drop beginning July 26.
 USDJPY itself certainly doesn’t support the idea of a breakout.
  In fact, DXY’s “breakout” is in the process of failing.
 CL and RB are stretched, levitating without breaking out.

 VIX has tested Friday’s lows without making new lows.
 Inputting this morning’s highs changes the A=C target to 2783.57 on 9/13 — a better fit.
 VIX has a similar pattern shaping up, with C=A (an extension of the flag pattern) taking it to 28.02 by the end of the week.
 More later…
UPDATE: 12:02 PM
It’s noon, and SMA5 200 is finally at least as high as the last “low” from Friday’s close. SPX can finally decline — at least a little bit — while still making higher lows. Although the SMA5 200 is only a few points lower, remember that the first gap to fill is way down at 2938.84.
 Just waiting for CL and USDJPY to back off…

