Futures are hanging on to a 4-pt gain, primarily on a continuing decline in VIX.  With Jackson Hole coming up, we could see more volatility — particularly if Fed speakers back off their hiking schedule.
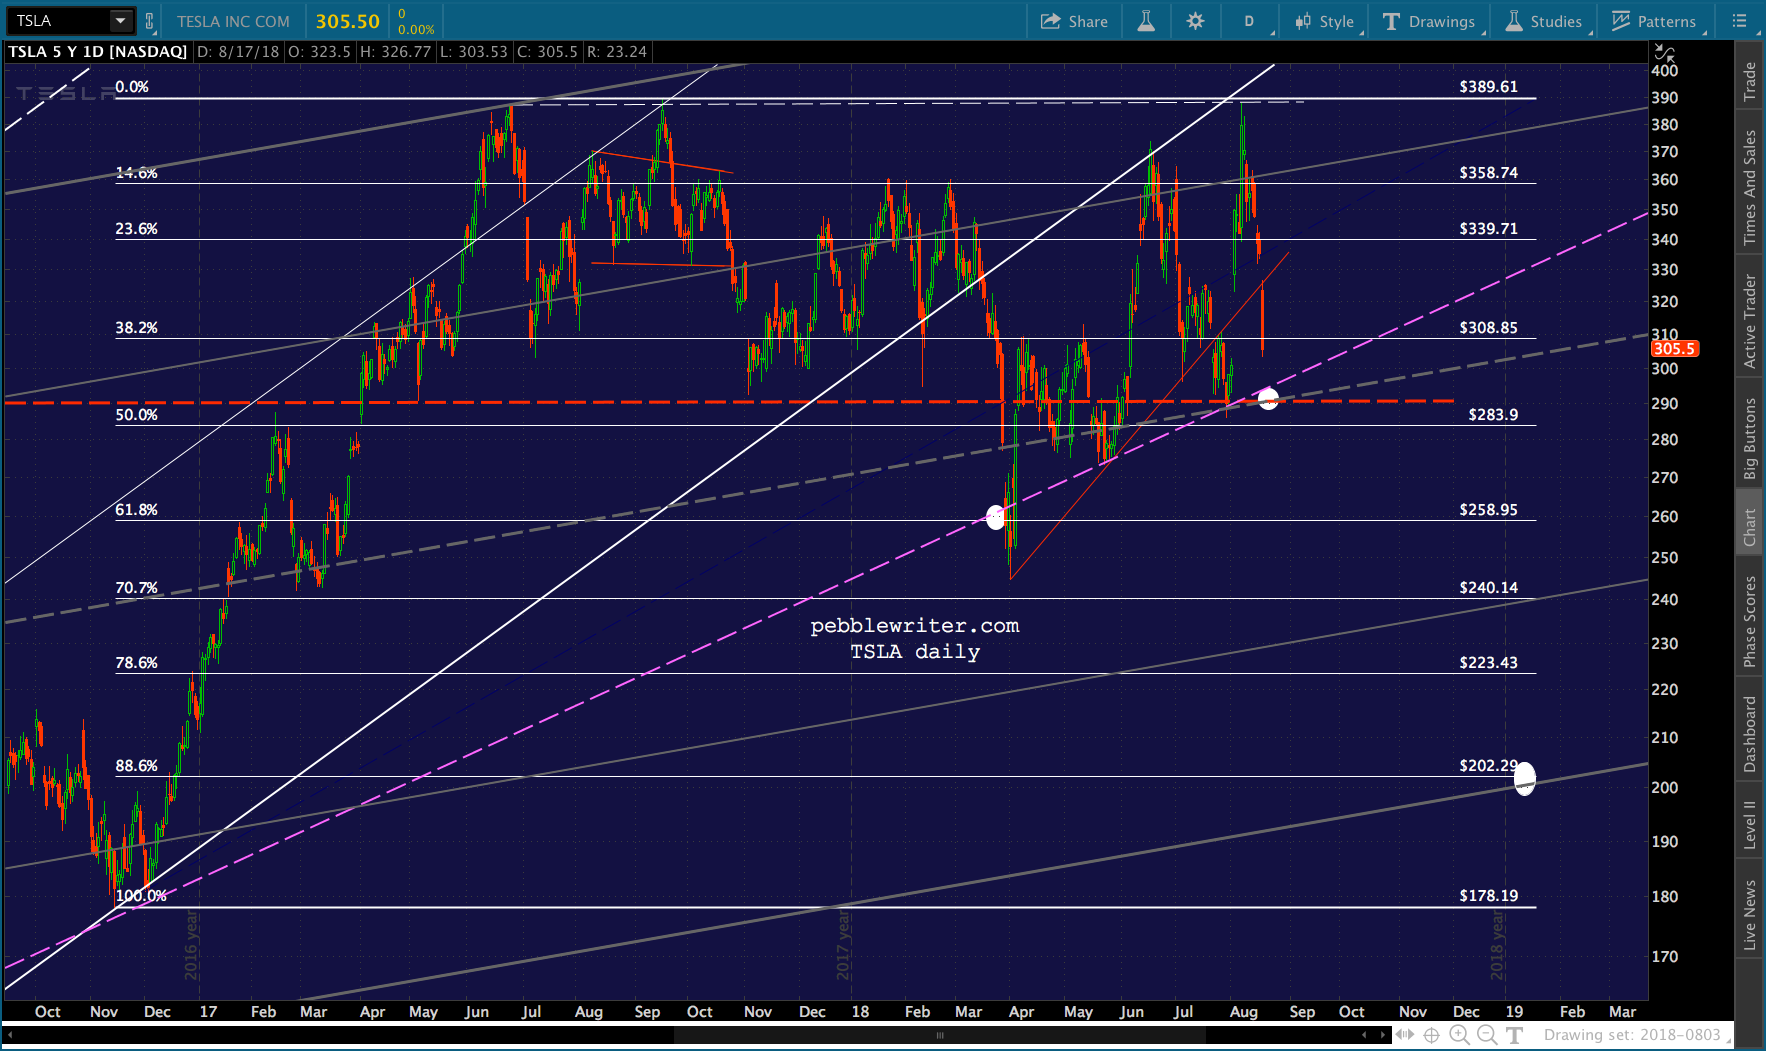
Speaking of backing off…TSLA is back down to its horizontal and trend line support. As readers will recall, this is a critical line in the sand. As we concluded last May [see: Can TSLA Avoid a Crash?] a drop through this key level could easily land the stock below 200. Our chart from back then, before the craziness really got going…
Apparently JPM has also adopted this view. And, an increasing number of observers are coming to the same conclusion we did a couple of weeks ago regarding Musk’s emotional state [see: Is the Pressure Getting to Elon Musk?]
continued for members…
The updated chart deemphasizes the H&S — even though it technically wasn’t busted by the nearly new high on Aug 6.
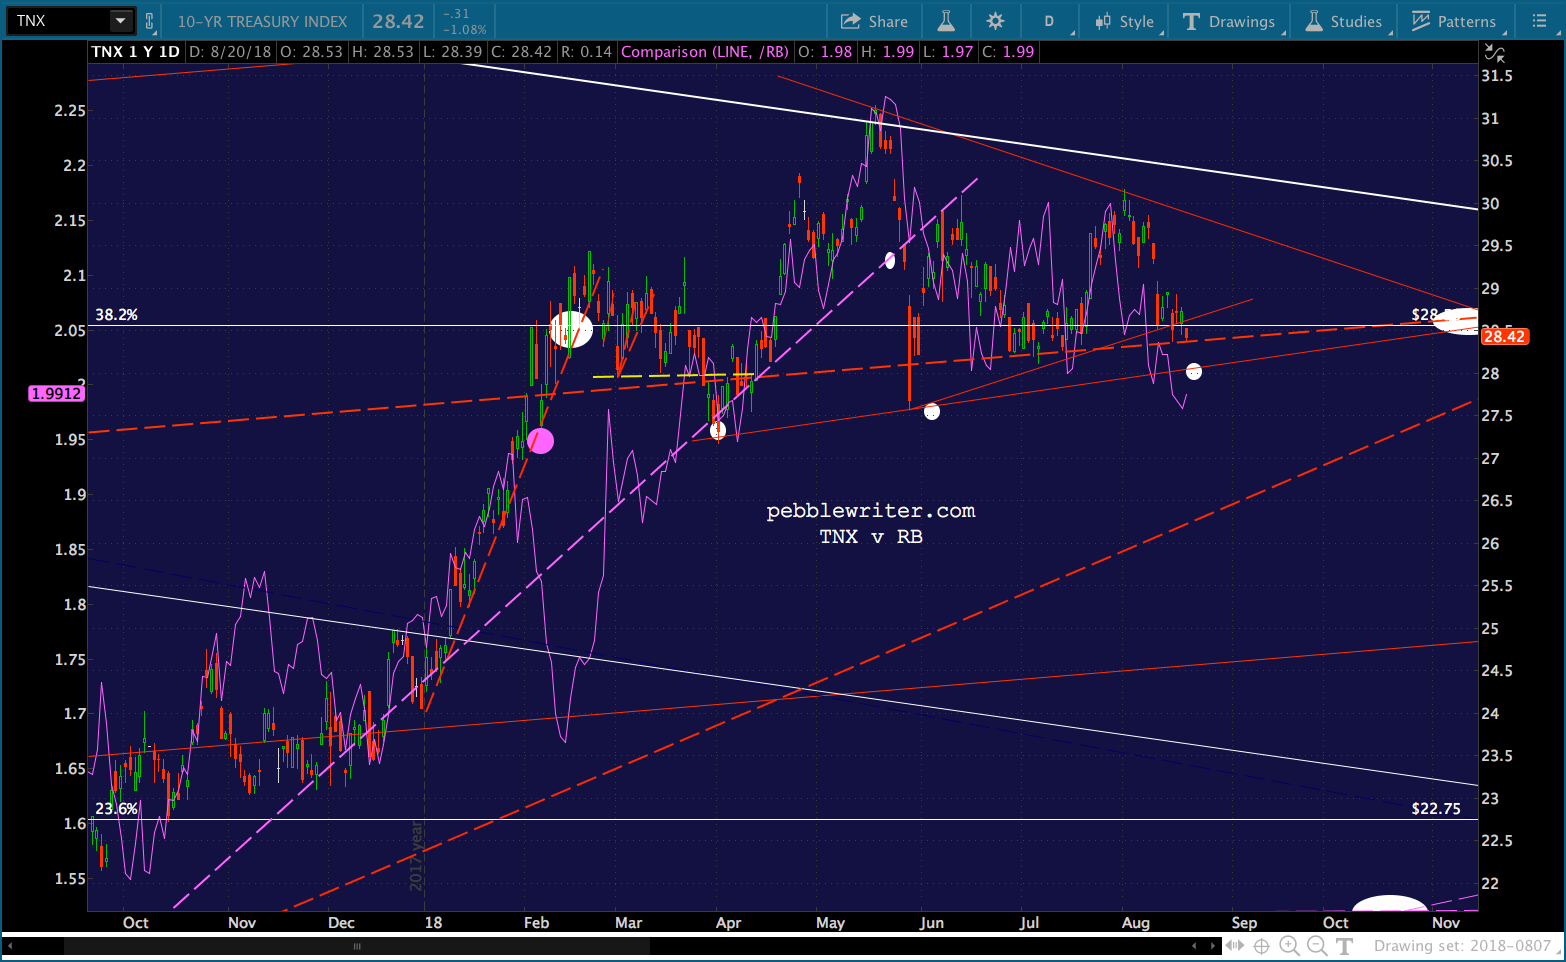
ZN is coming up on an important test of its own — the neckline of a large IH&S Pattern. Recall we’ve been bullish on bond prices and bearish on yields for quite some time [see: Bonds – A Buying Opportunity and Bonds and Value]
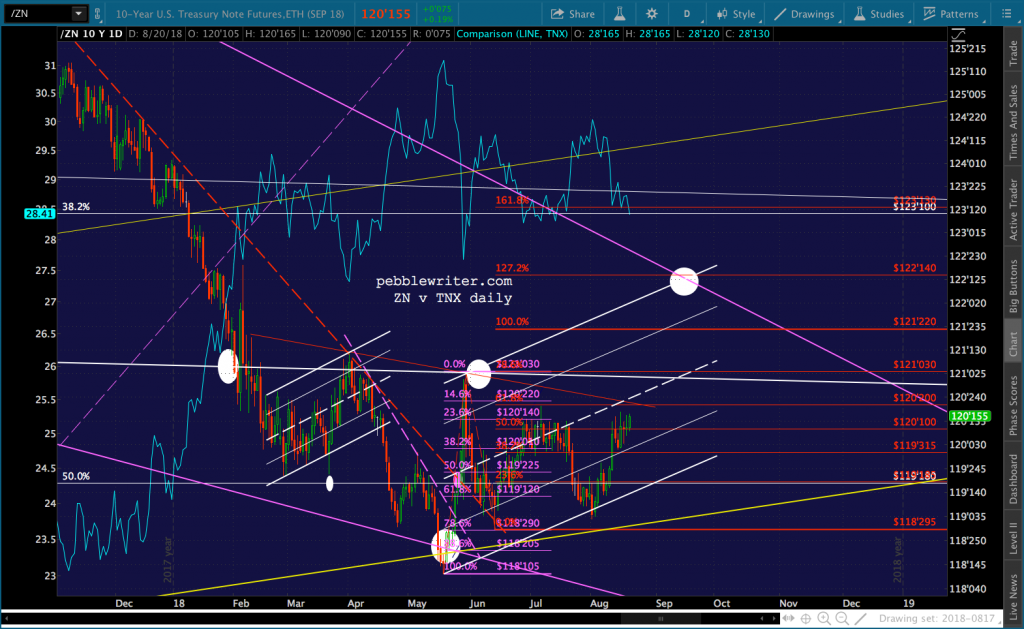
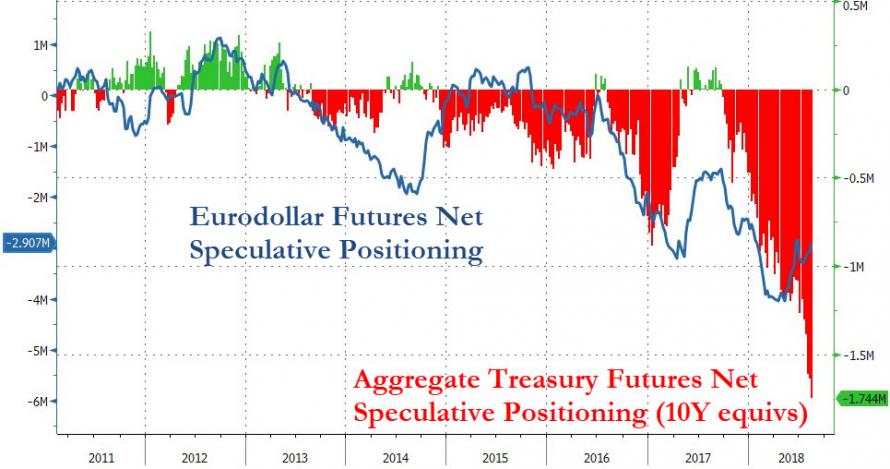
It’s interesting, as I just read over the weekend that spec short interest in the 10Y has never been higher. Could be quite a short squeeze if the Fed signals an end to the hiking cycle.
Punching through would mean a breakdown of TNX’s triangle.
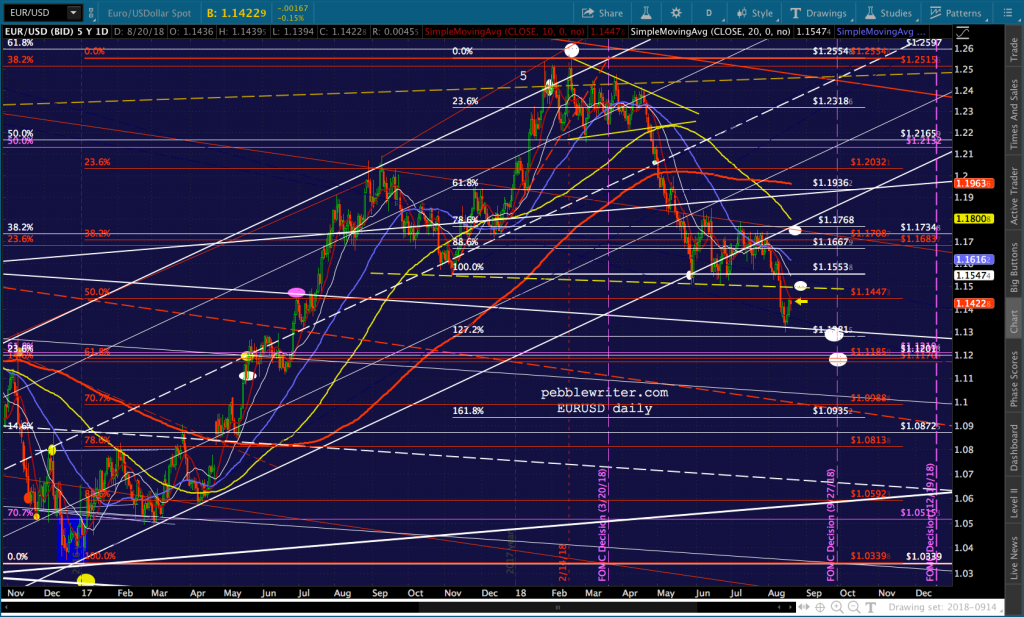
 On the currency front, EURUSD continues its backtest…
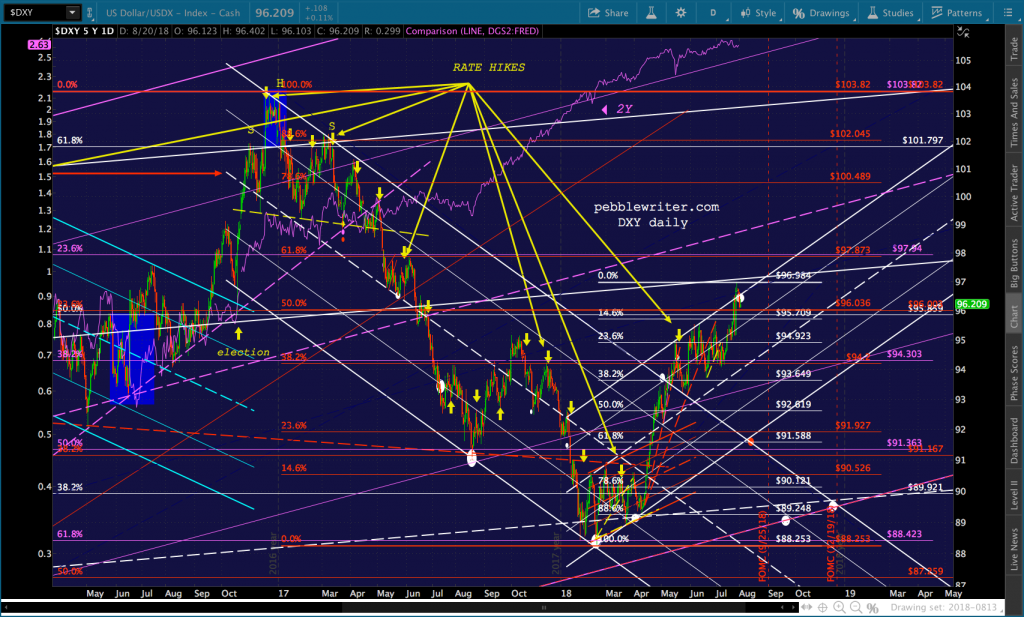
…while DXY continues to settle after tagging the white channel line…
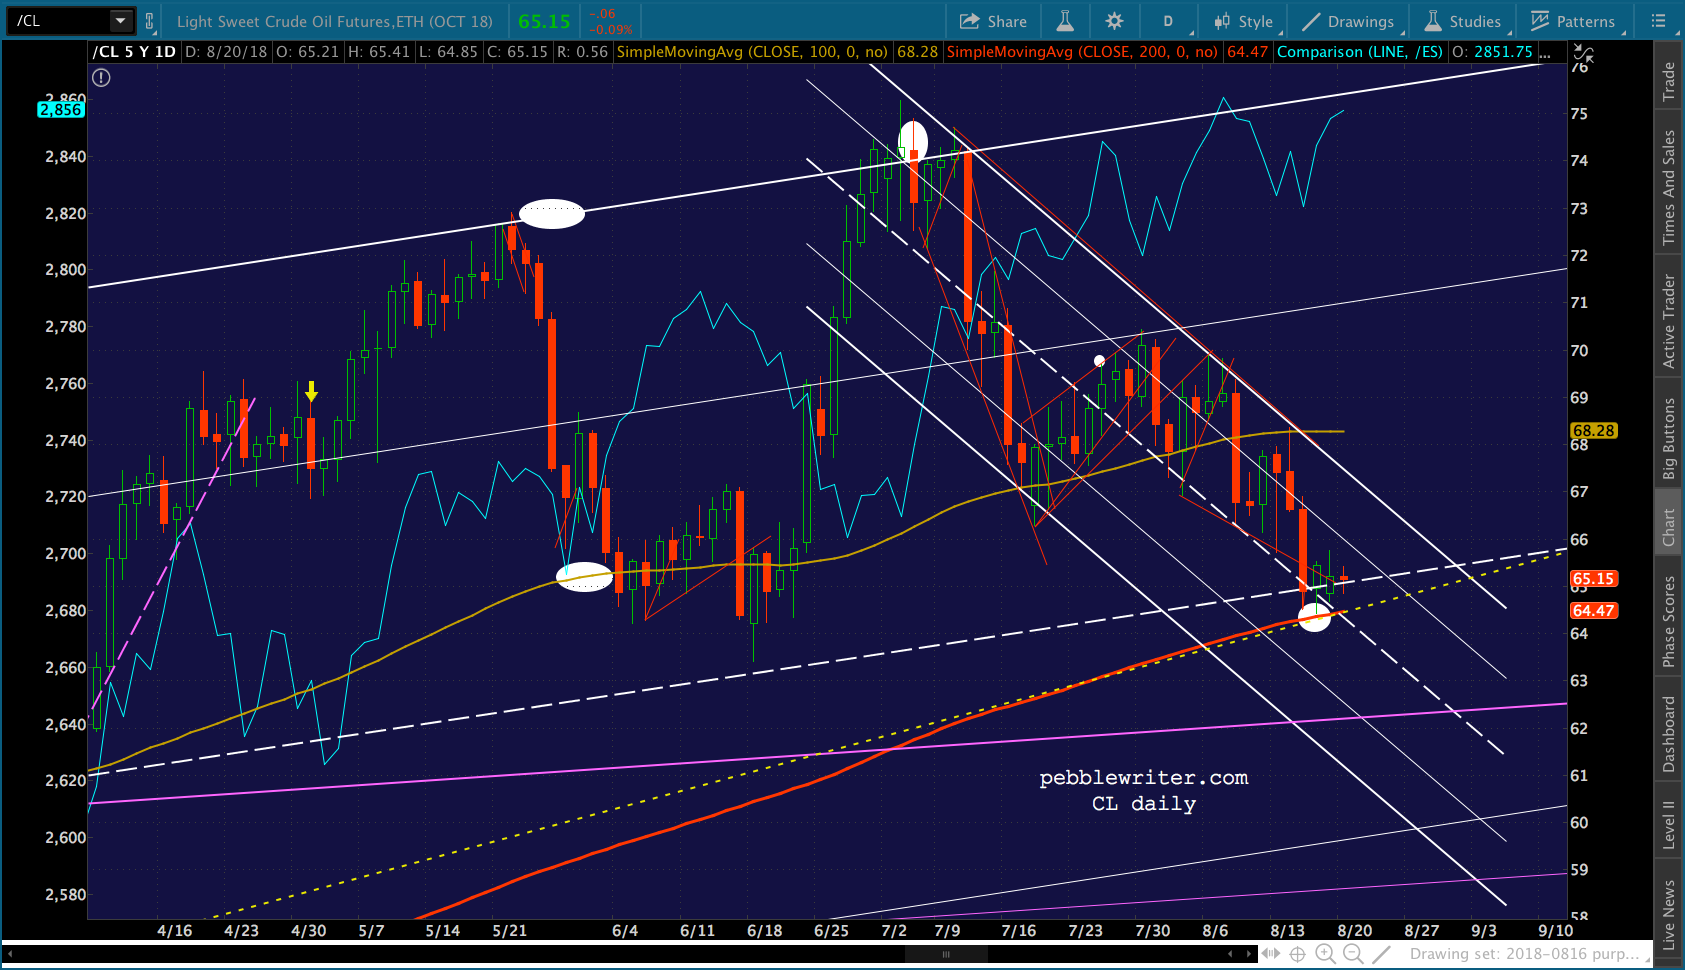
…and USDJPY continues to threaten a tag on its SMA200 or SMA100.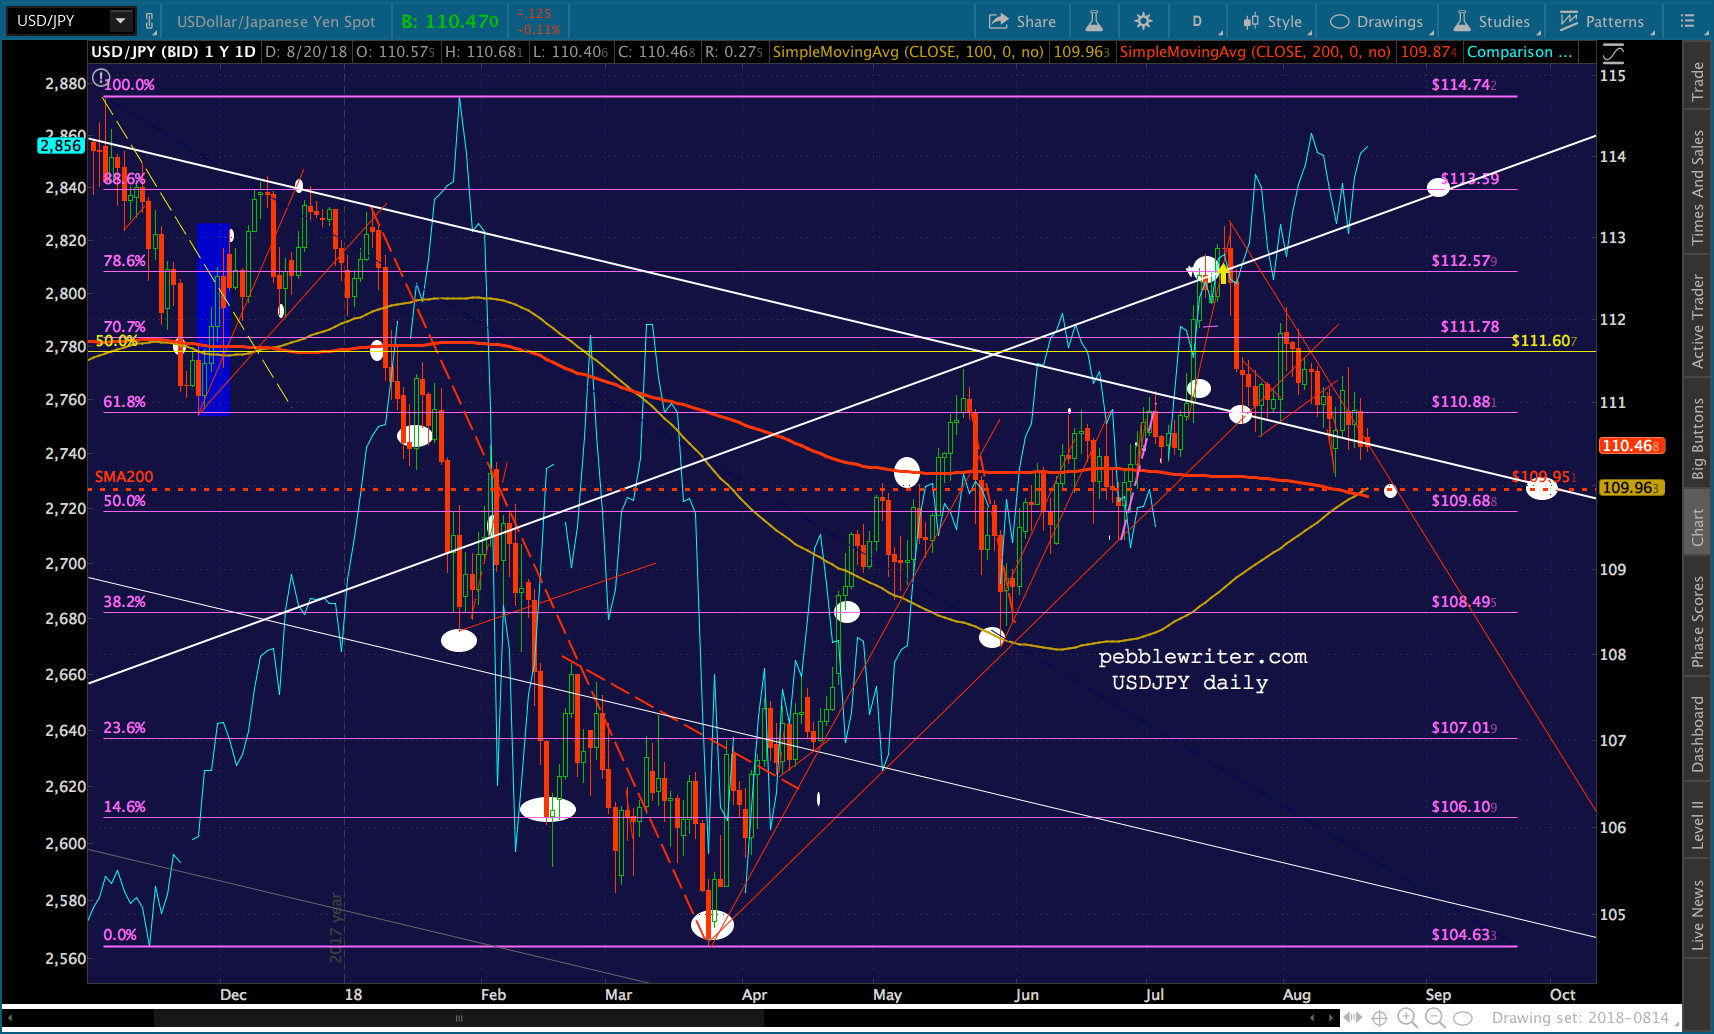 Oil and gas continue to hover over their SMA200s…
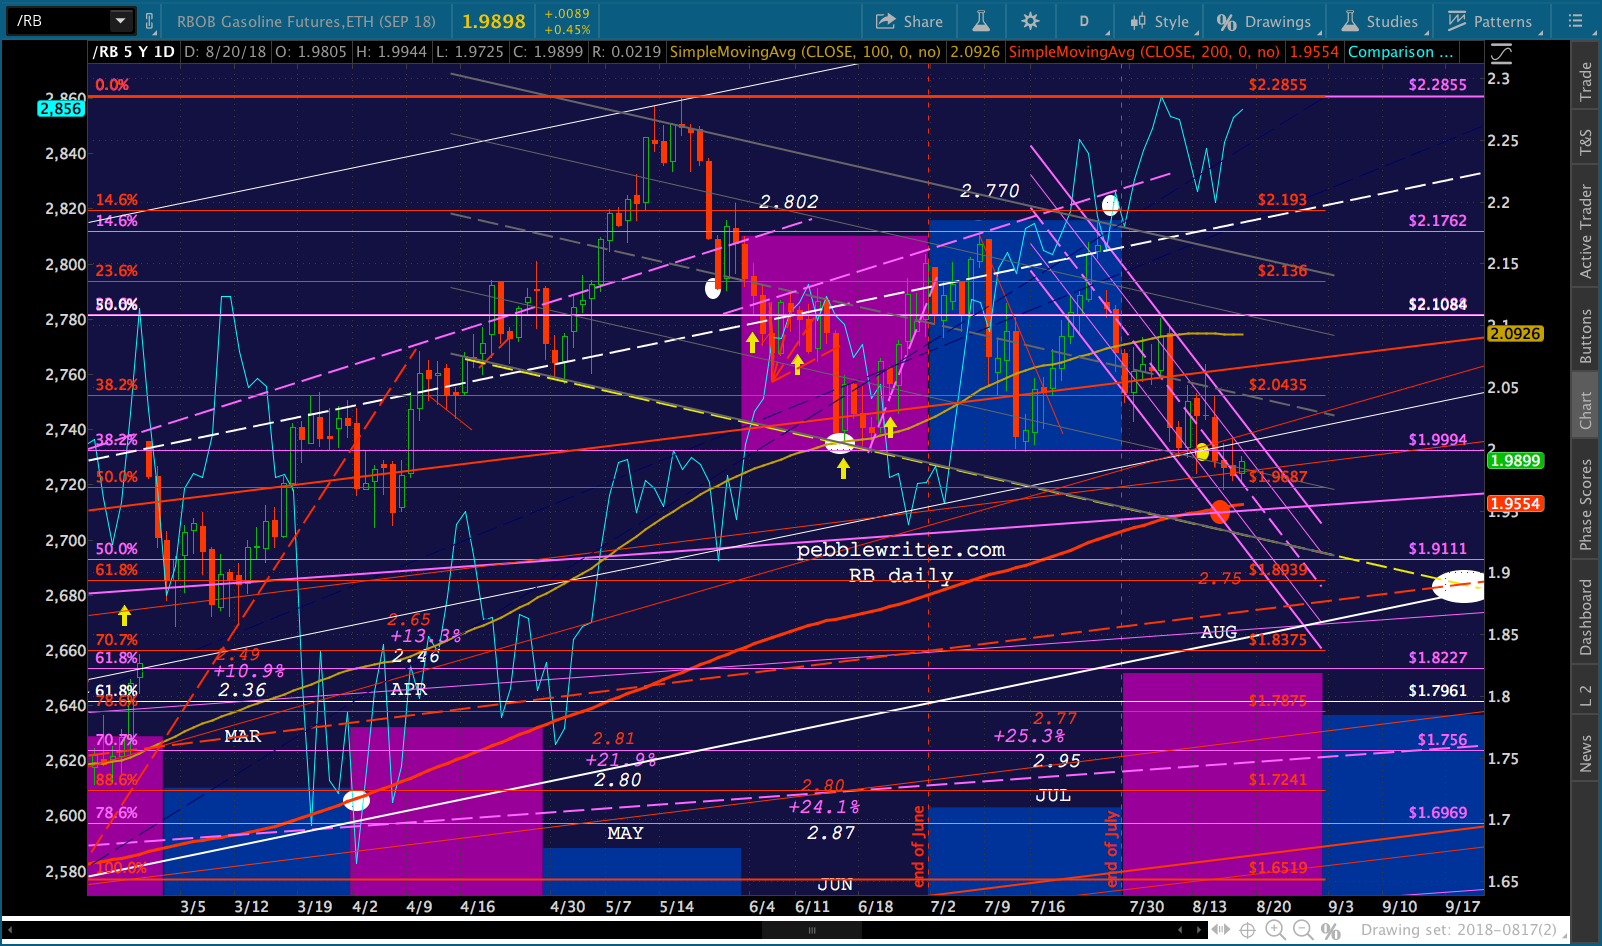
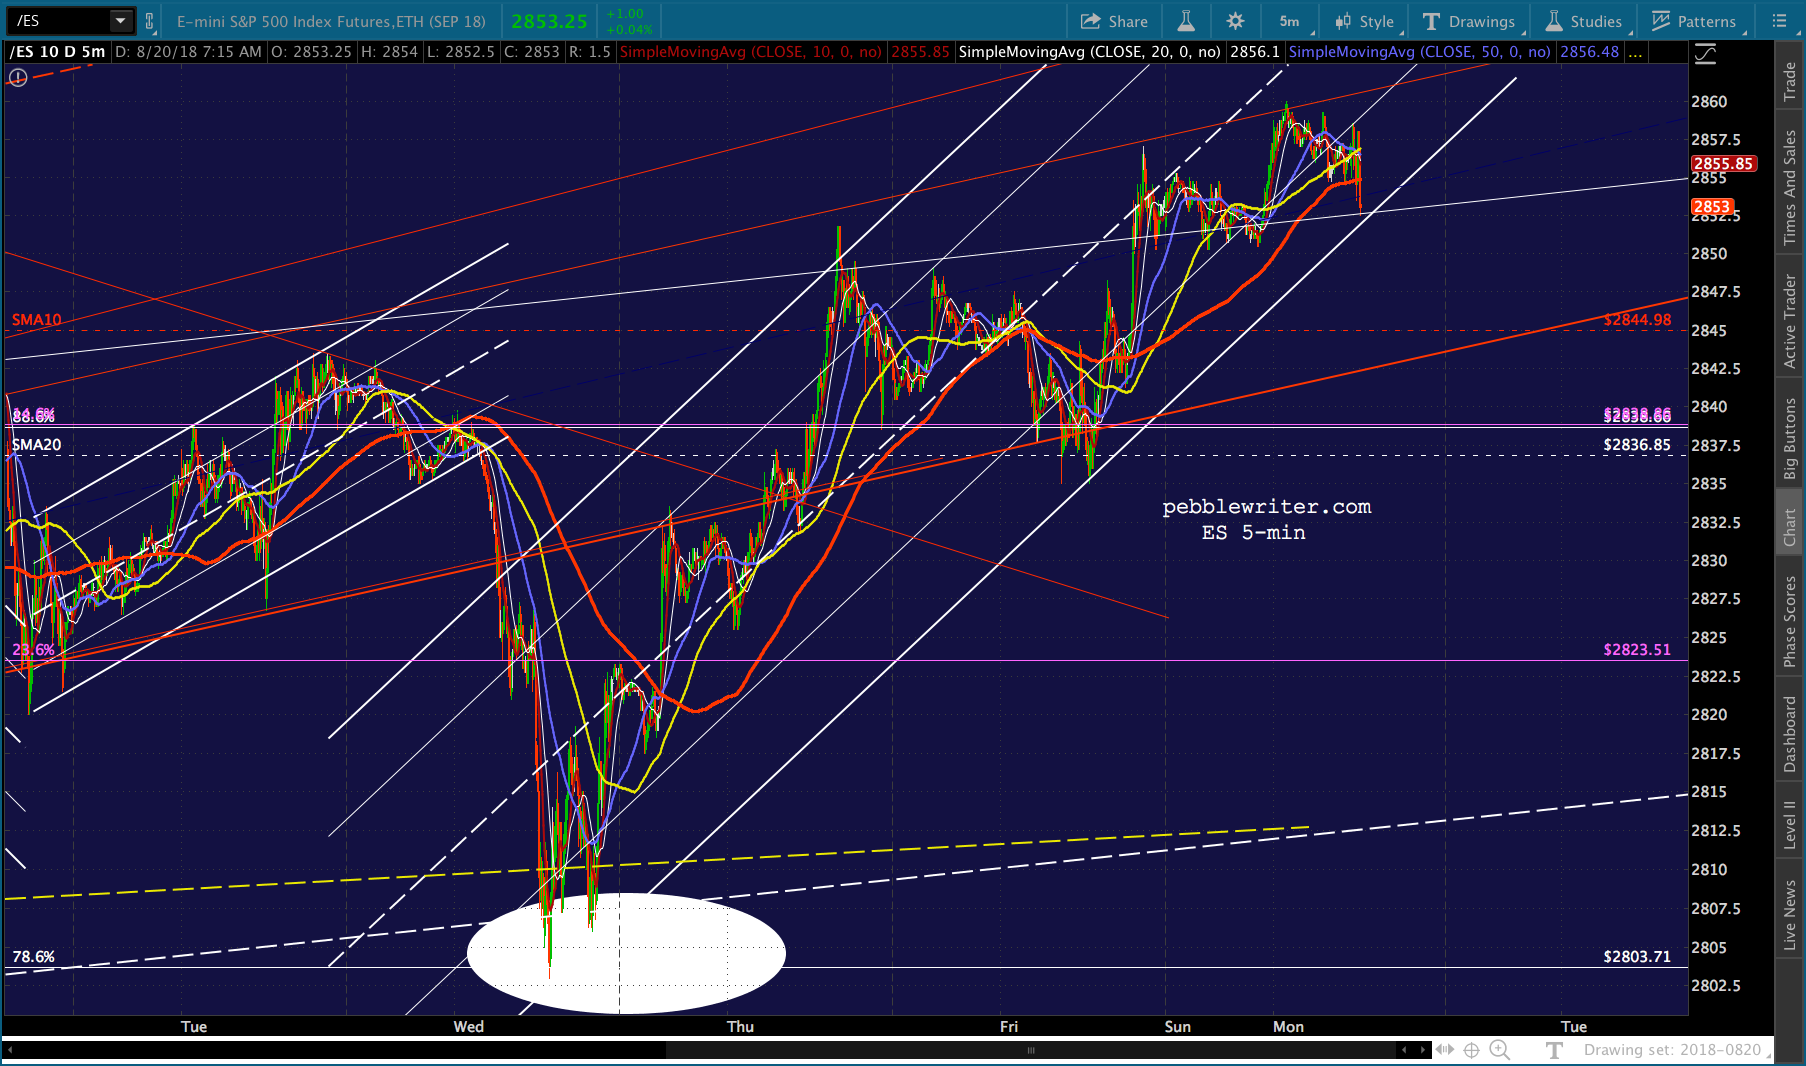
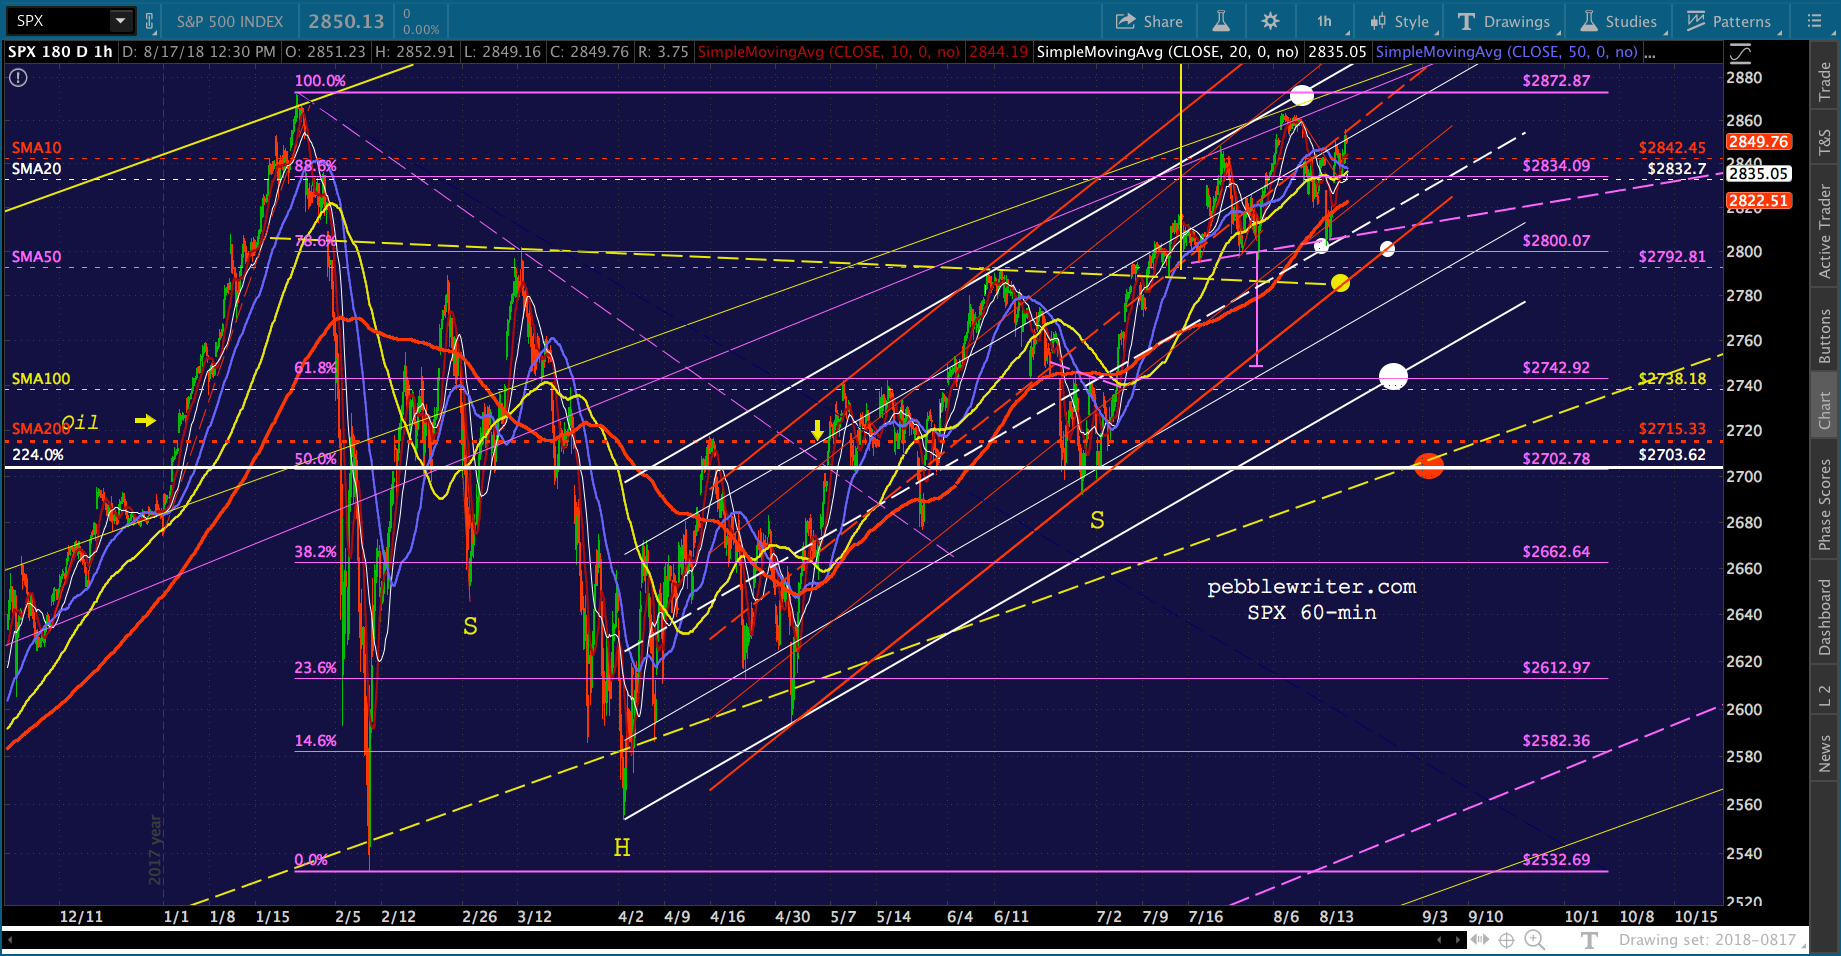
 …while ES and SPX are seemingly on hold — not willing to punch through previous highs but not willing to break down either.
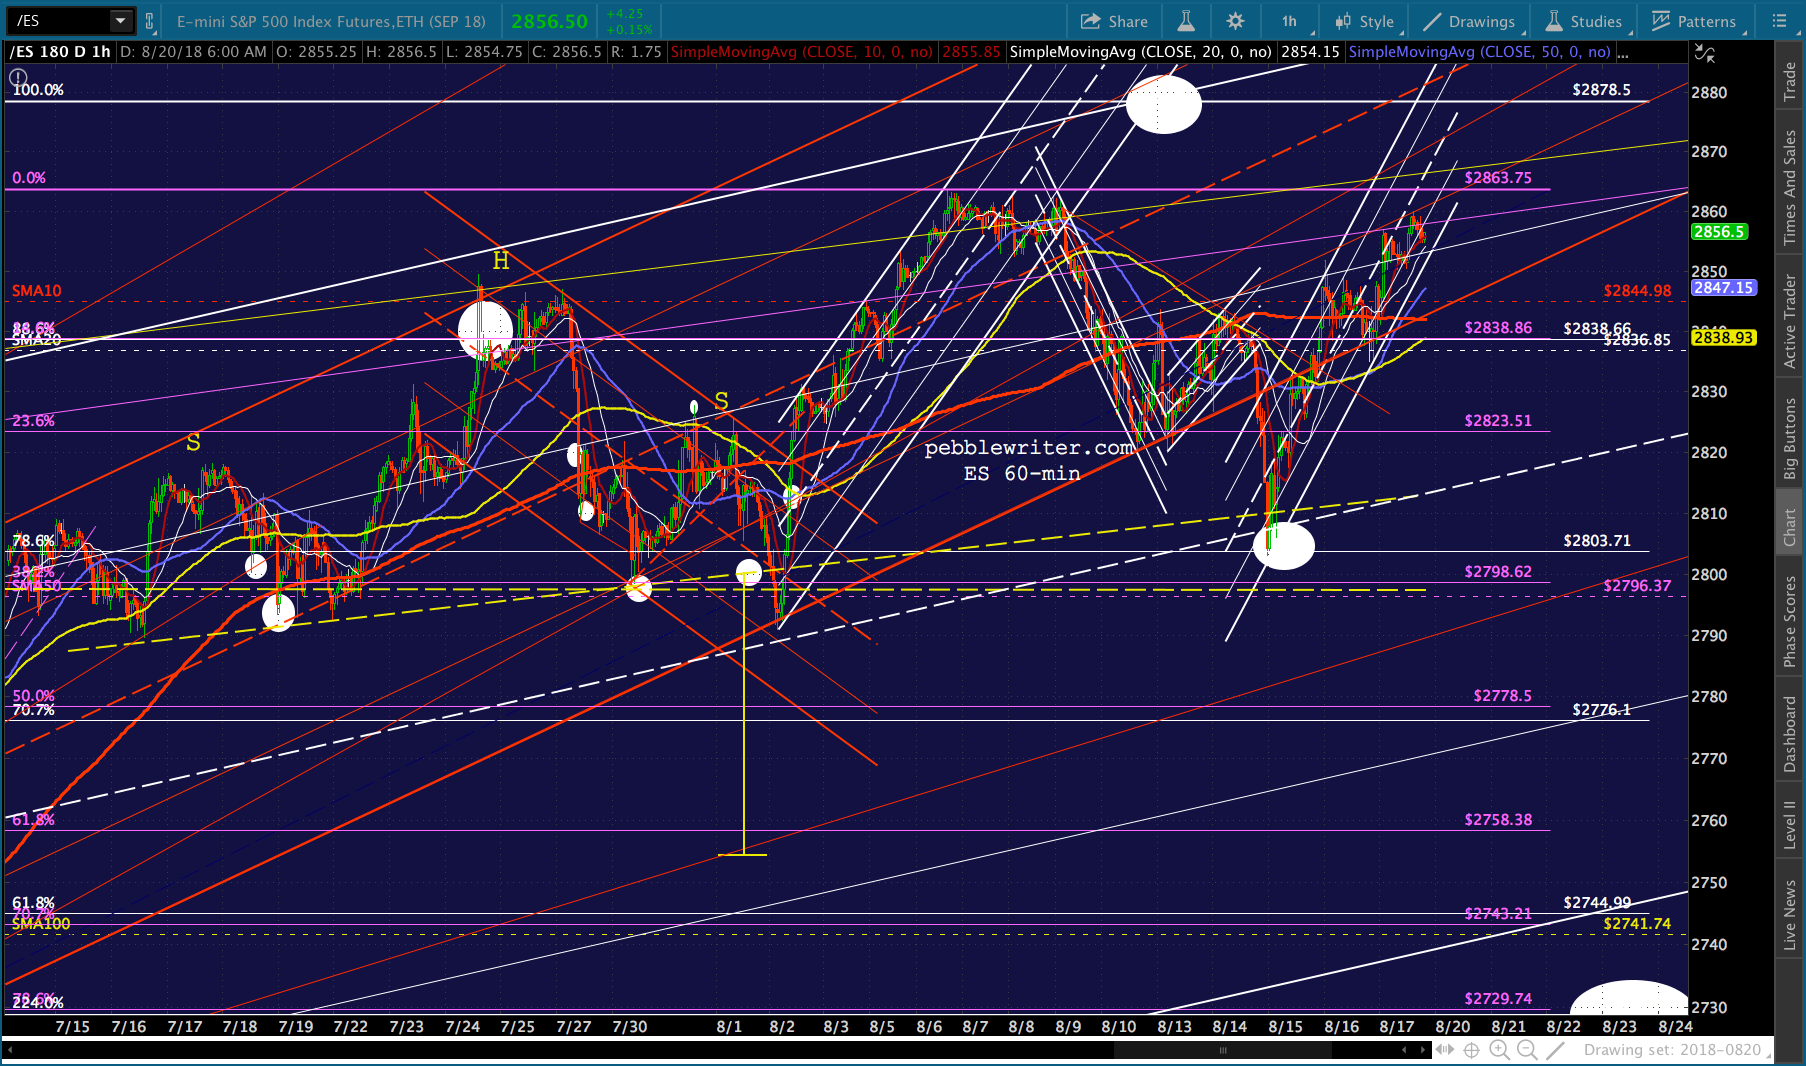
Look for VIX to continue pacing them.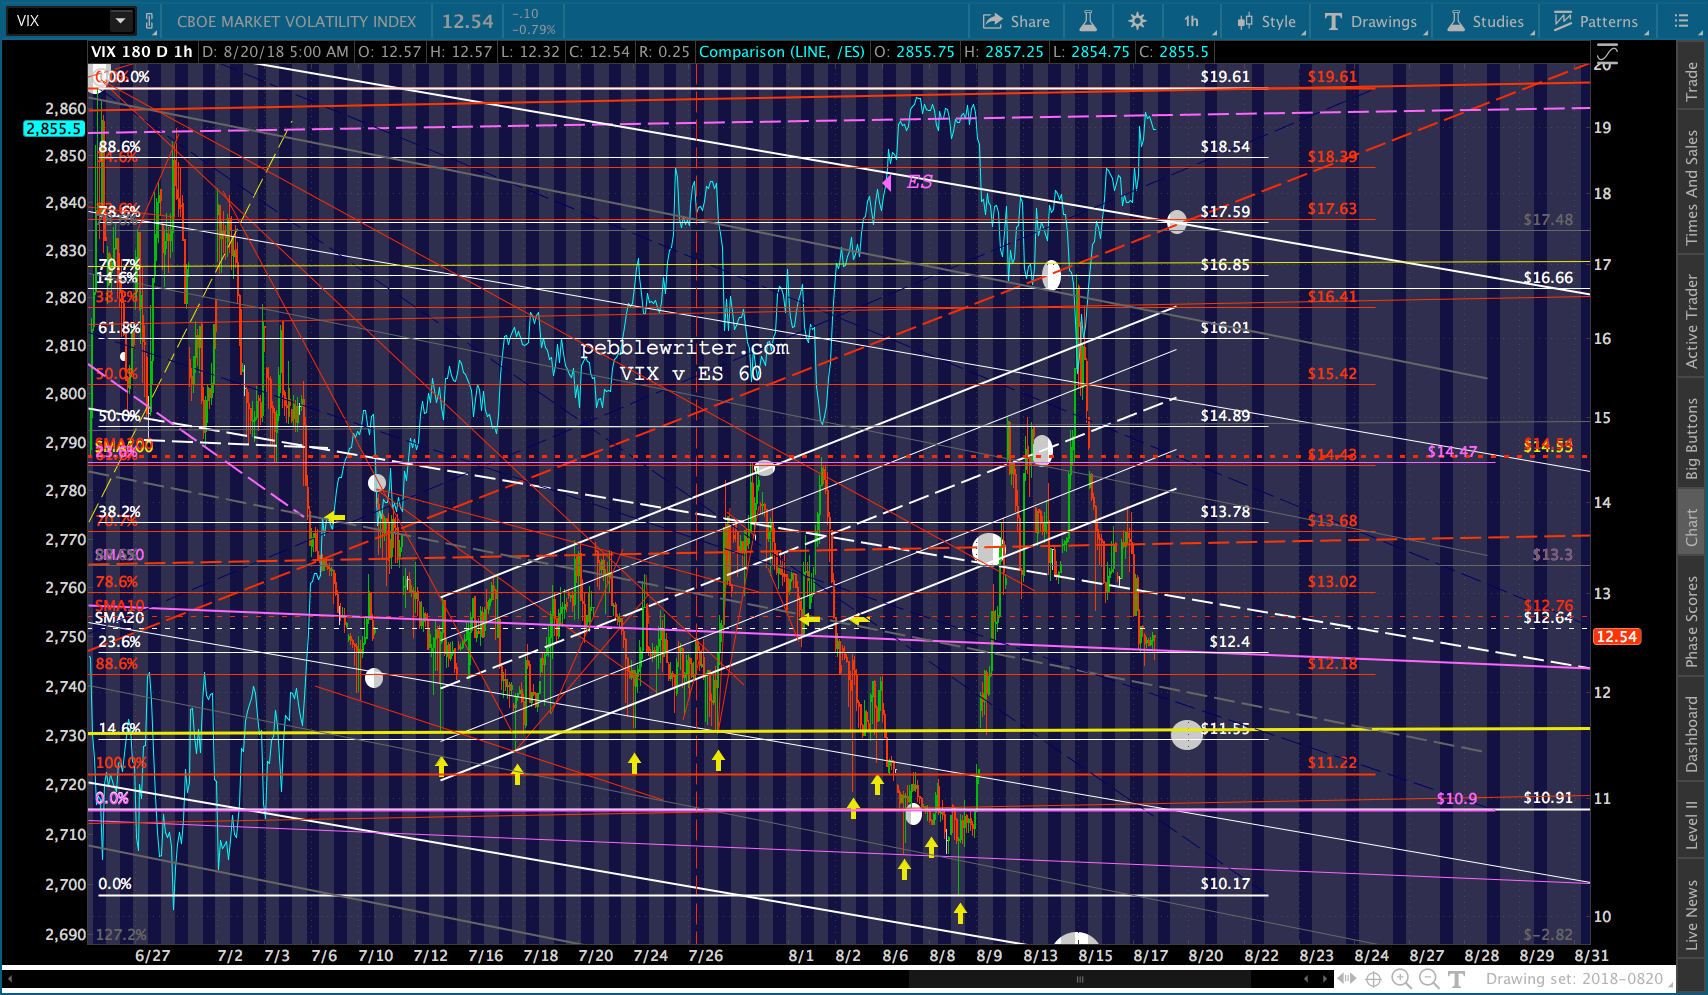
UPDATE: 10:15 AM
ES has reached channel support. A drop through 2853 would give SPX a chance to work on some of those downside targets. The SMA10 at 2844.98 (2842.45 for SPX) would be the next level of support.