It was a rather listless after-hours, with ES meandering back and forth across its SMA10 following yesterday’s continuing bounce off our initial downside target. Consumer sentiment and leading indicators will be released at 10am this morning, perhaps offering traders some direction.
In the meantime, oil and gas have bounced, USDJPY has slumped, and VIX is back down to its recent lows.
Deutsche Bank, the systemically important bank that no one talks about, continues to drift southward.
continued for members…
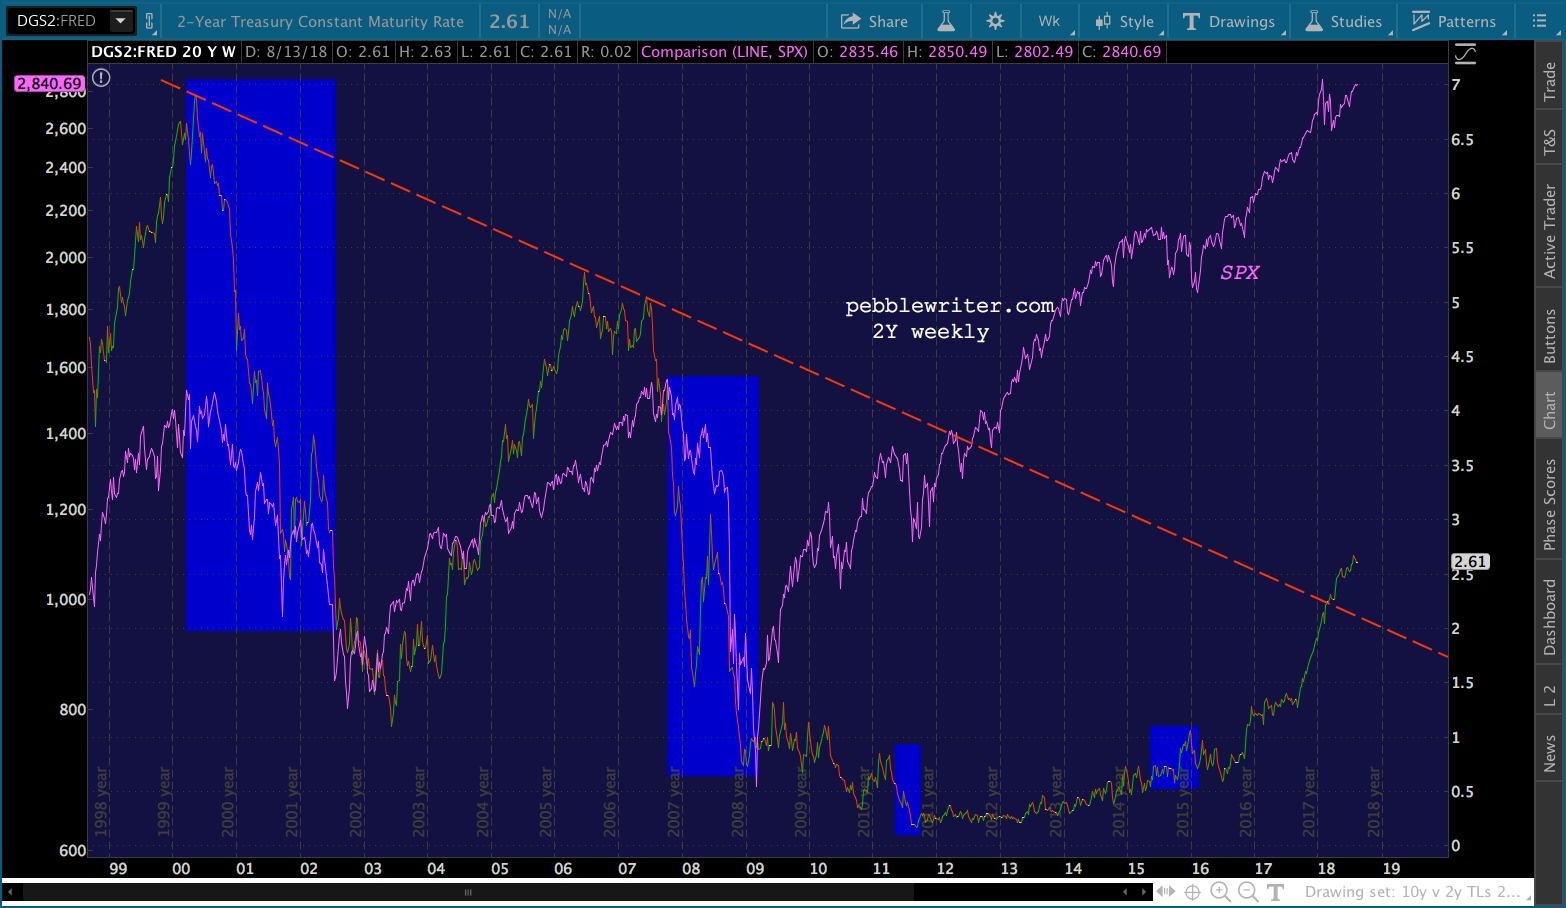
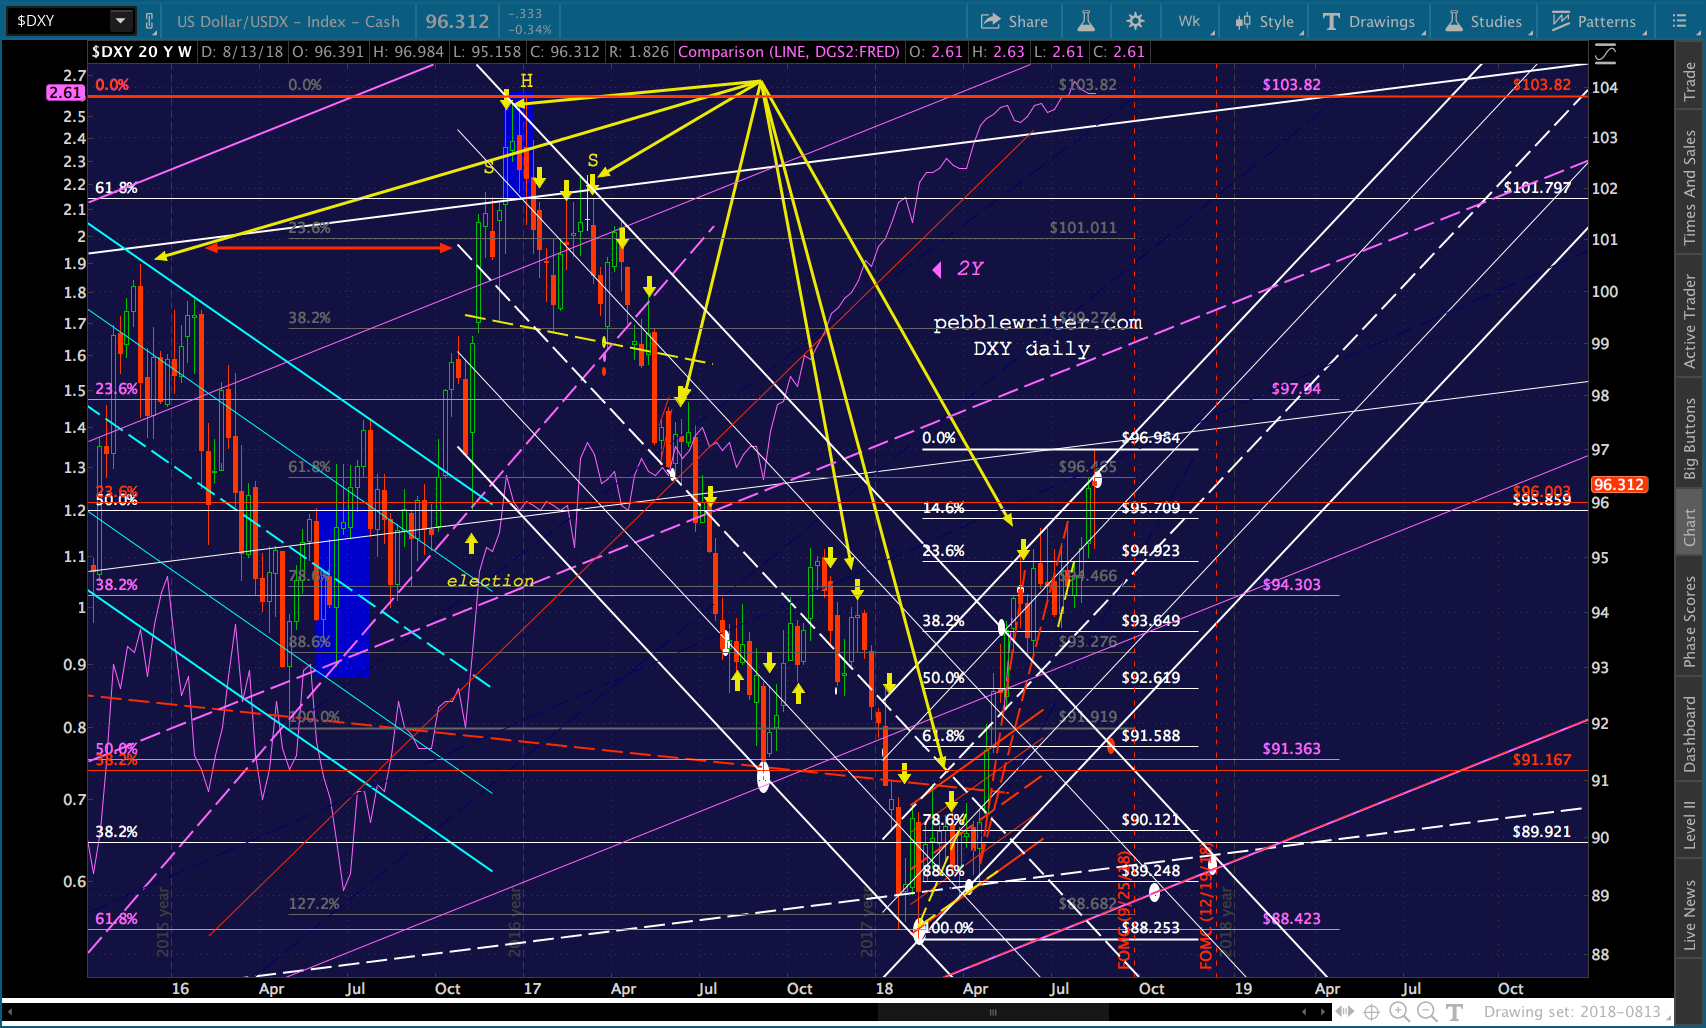
I’ll continue my work on the oil and gas forecast — updated on yesterday’s post. In the meantime, here are the charts worth watching today. The 2s10s is back to 25bps…a reminder that the 2Y remains broken out while the 10Y has definitely not.
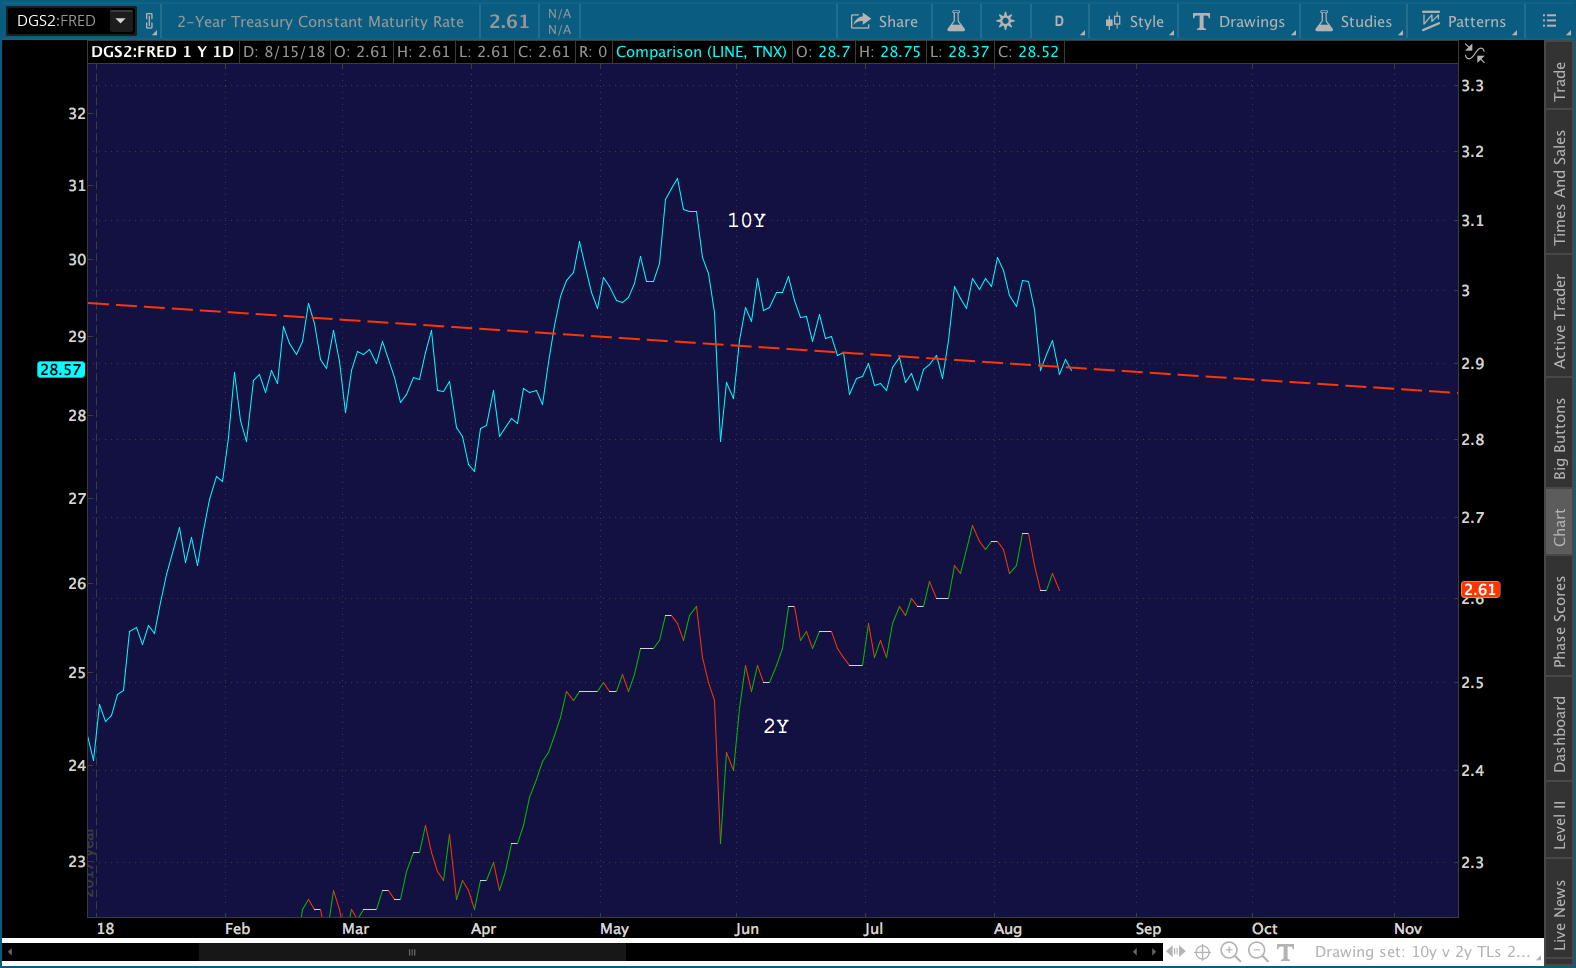 TNX remains in a consolidation.
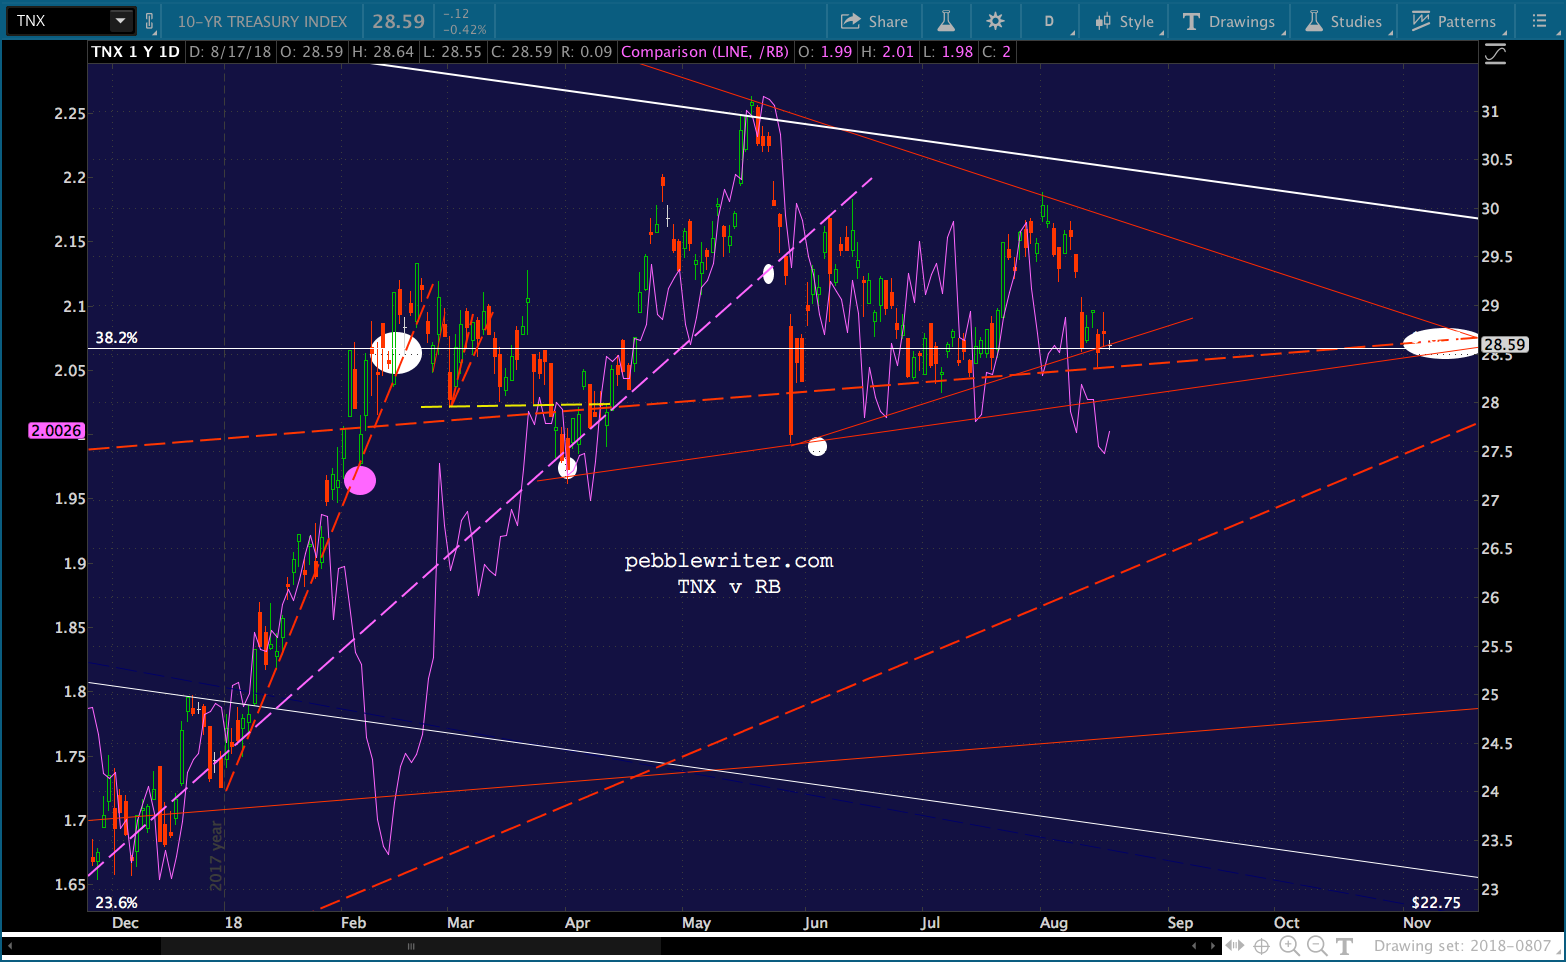 VIX has a shot at popping up to 17.59…
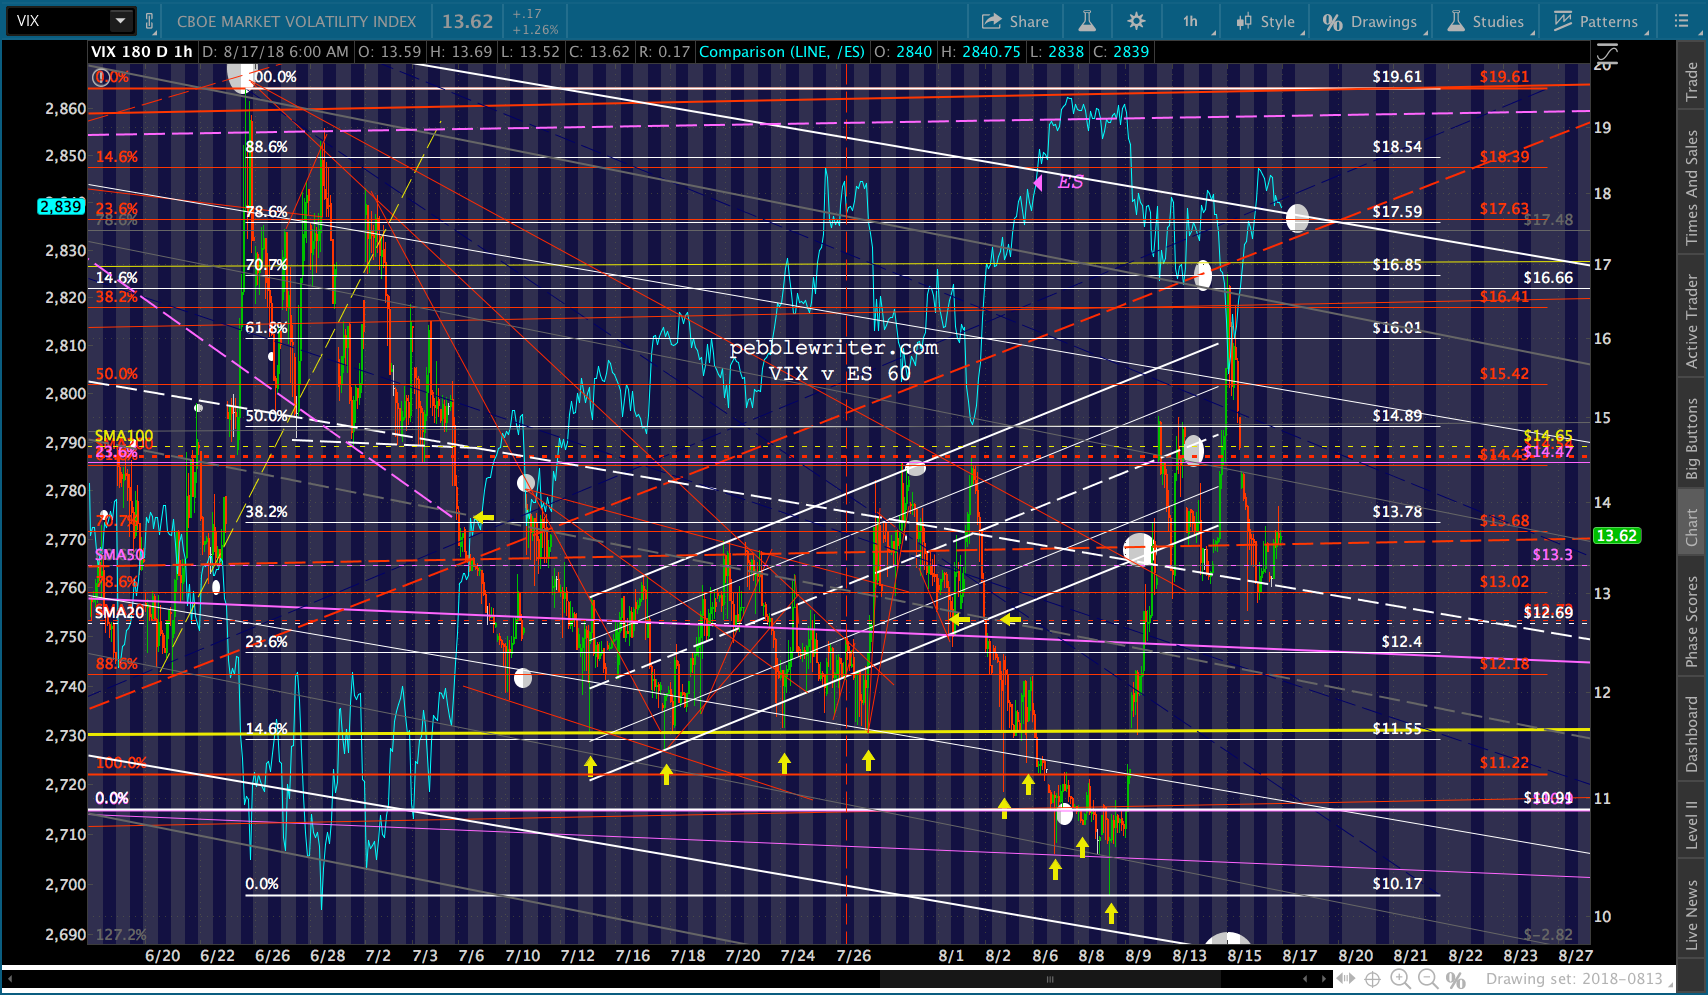
…but, not until ES’ red channel breaks down again. We’ll put the line in the sand at 2838.66 — also the .886.
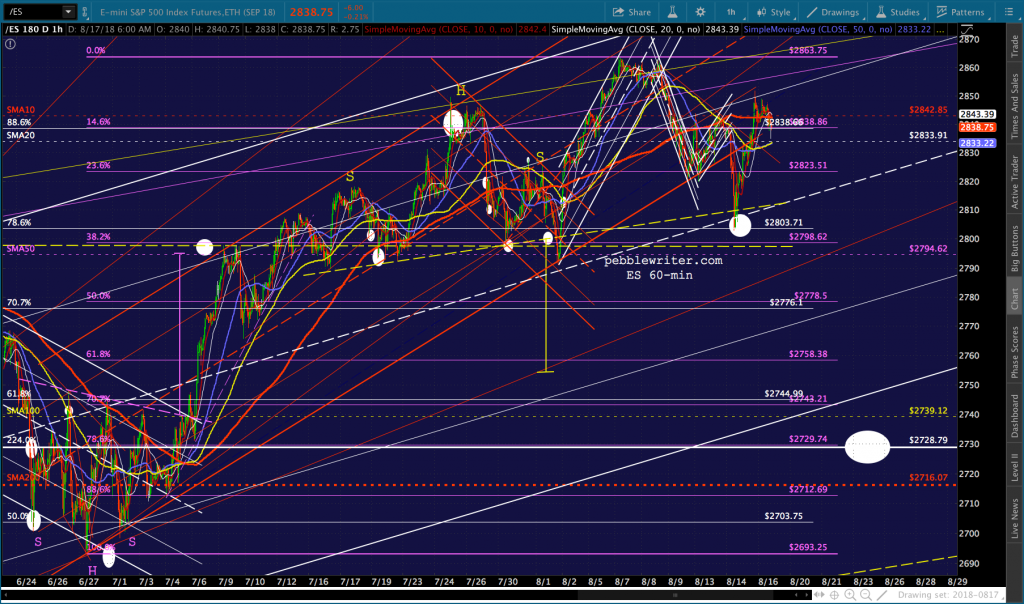
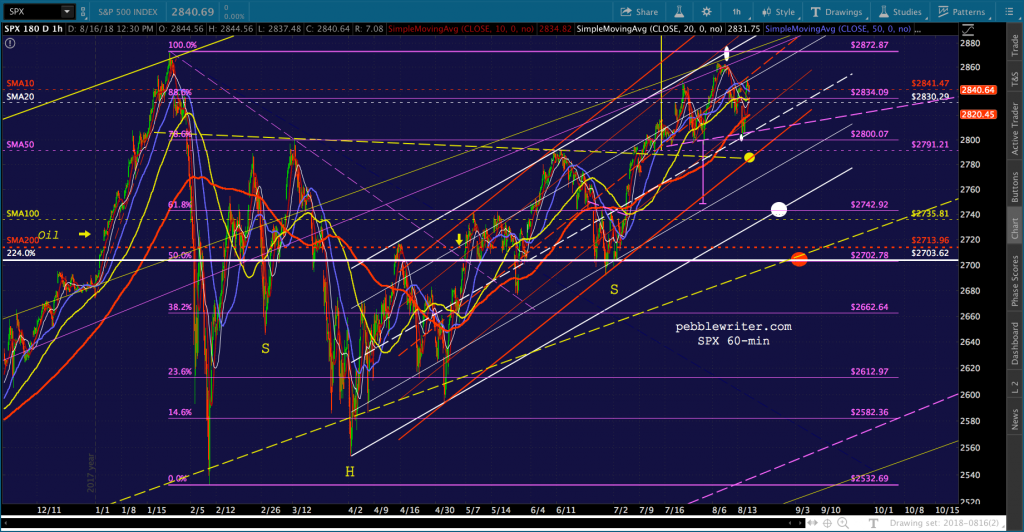
As a reminder, SPX never reached its .786 on Wednesday. A tag of 2800 or 2785 would make a lot of sense. But, I wouldn’t bet on it unless ES loses the red channel again.
On the currency front, USDJPY still threatens to tag its declining SMA200… …while EURUSD continues to bounce off its channel top. A backtest of the H&S neckline is in order. And, if that doesn’t hold, a backtest of the broken white channel.

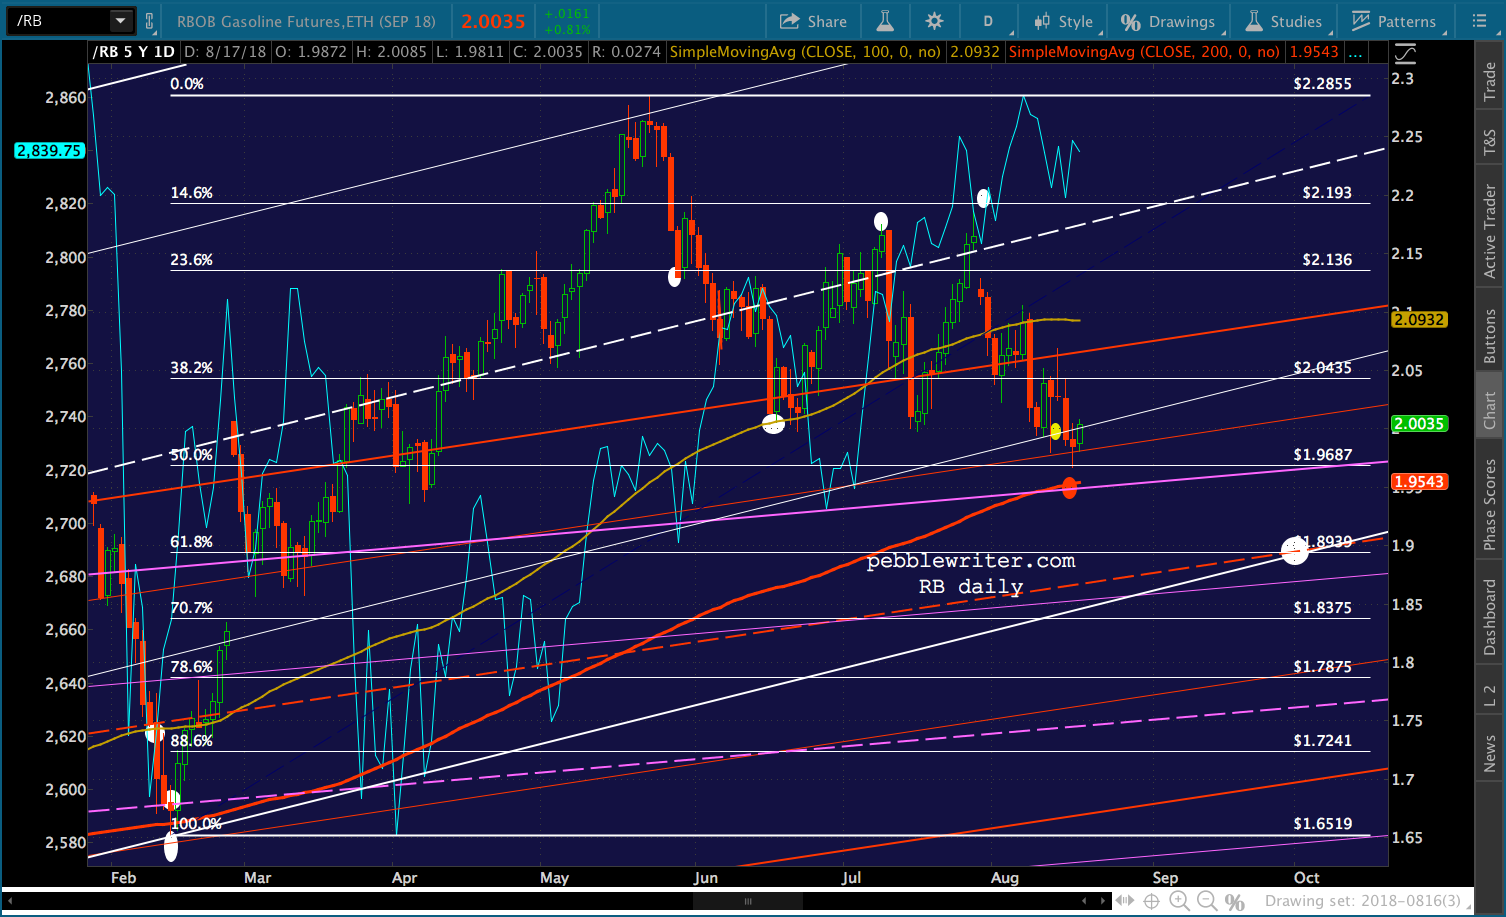
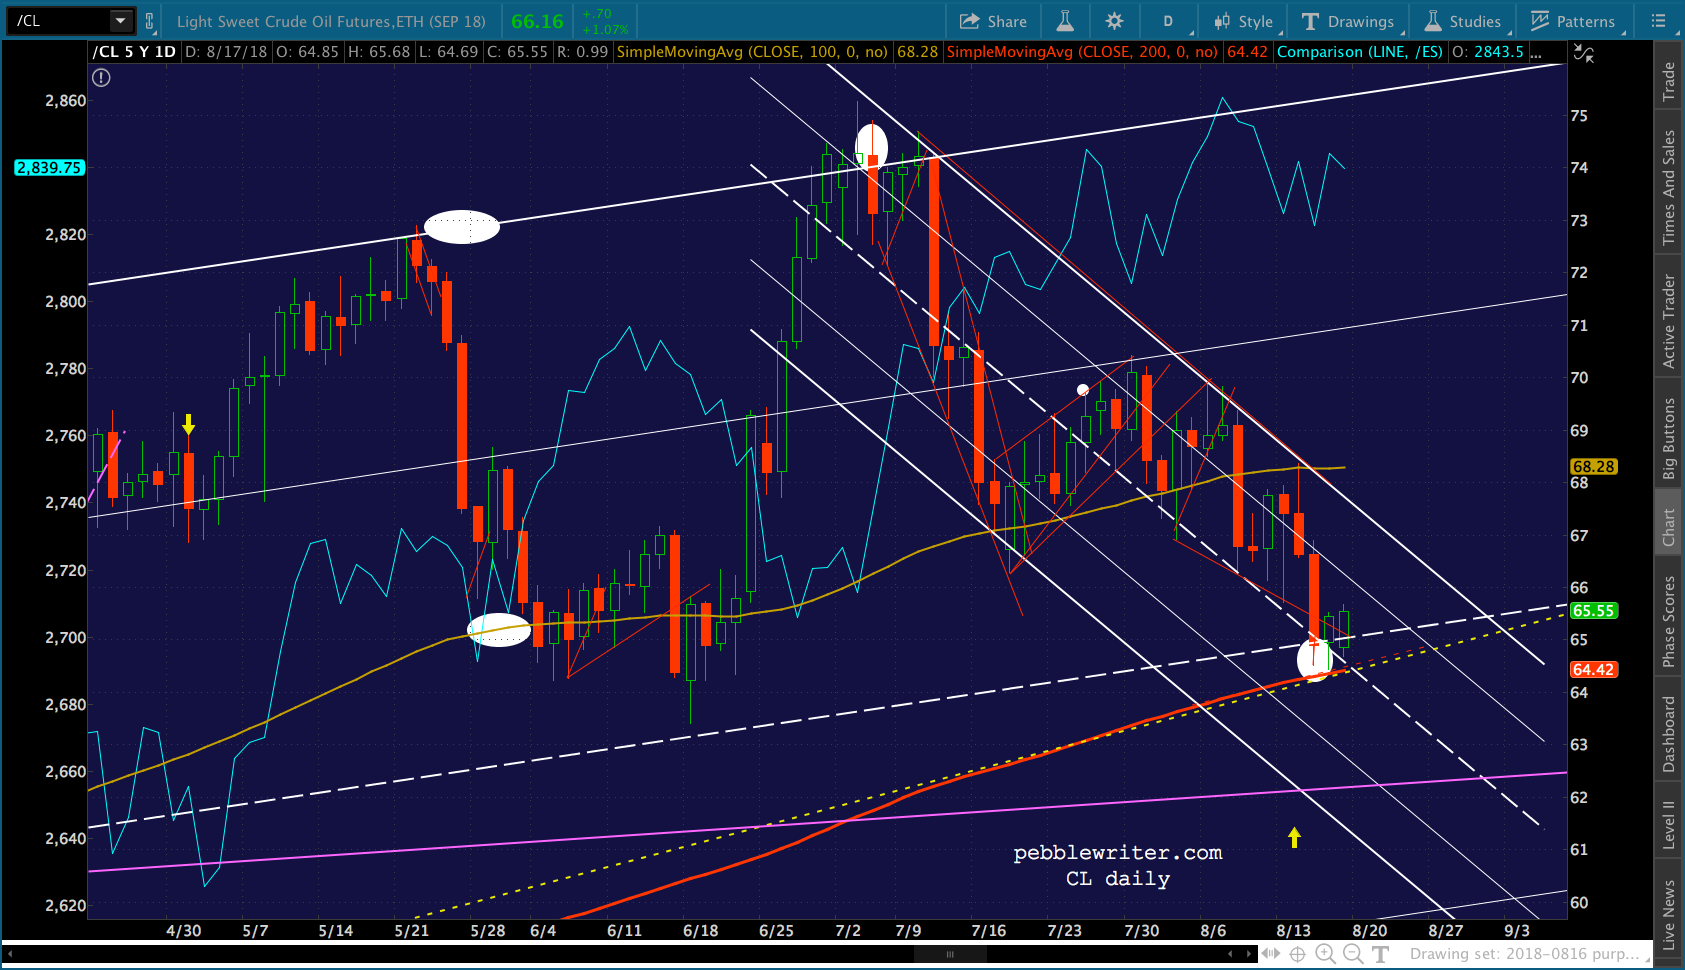
Will continue CL and RB on the other post, but posting here just for reference.