If you’re going to manipulate stocks, you push them up past resistance, then (and, this is key) backtest that former resistance. It’s a way of declaring that the resistance is well and truly done, that it didn’t pose a problem before and it certainly won’t pose one now.
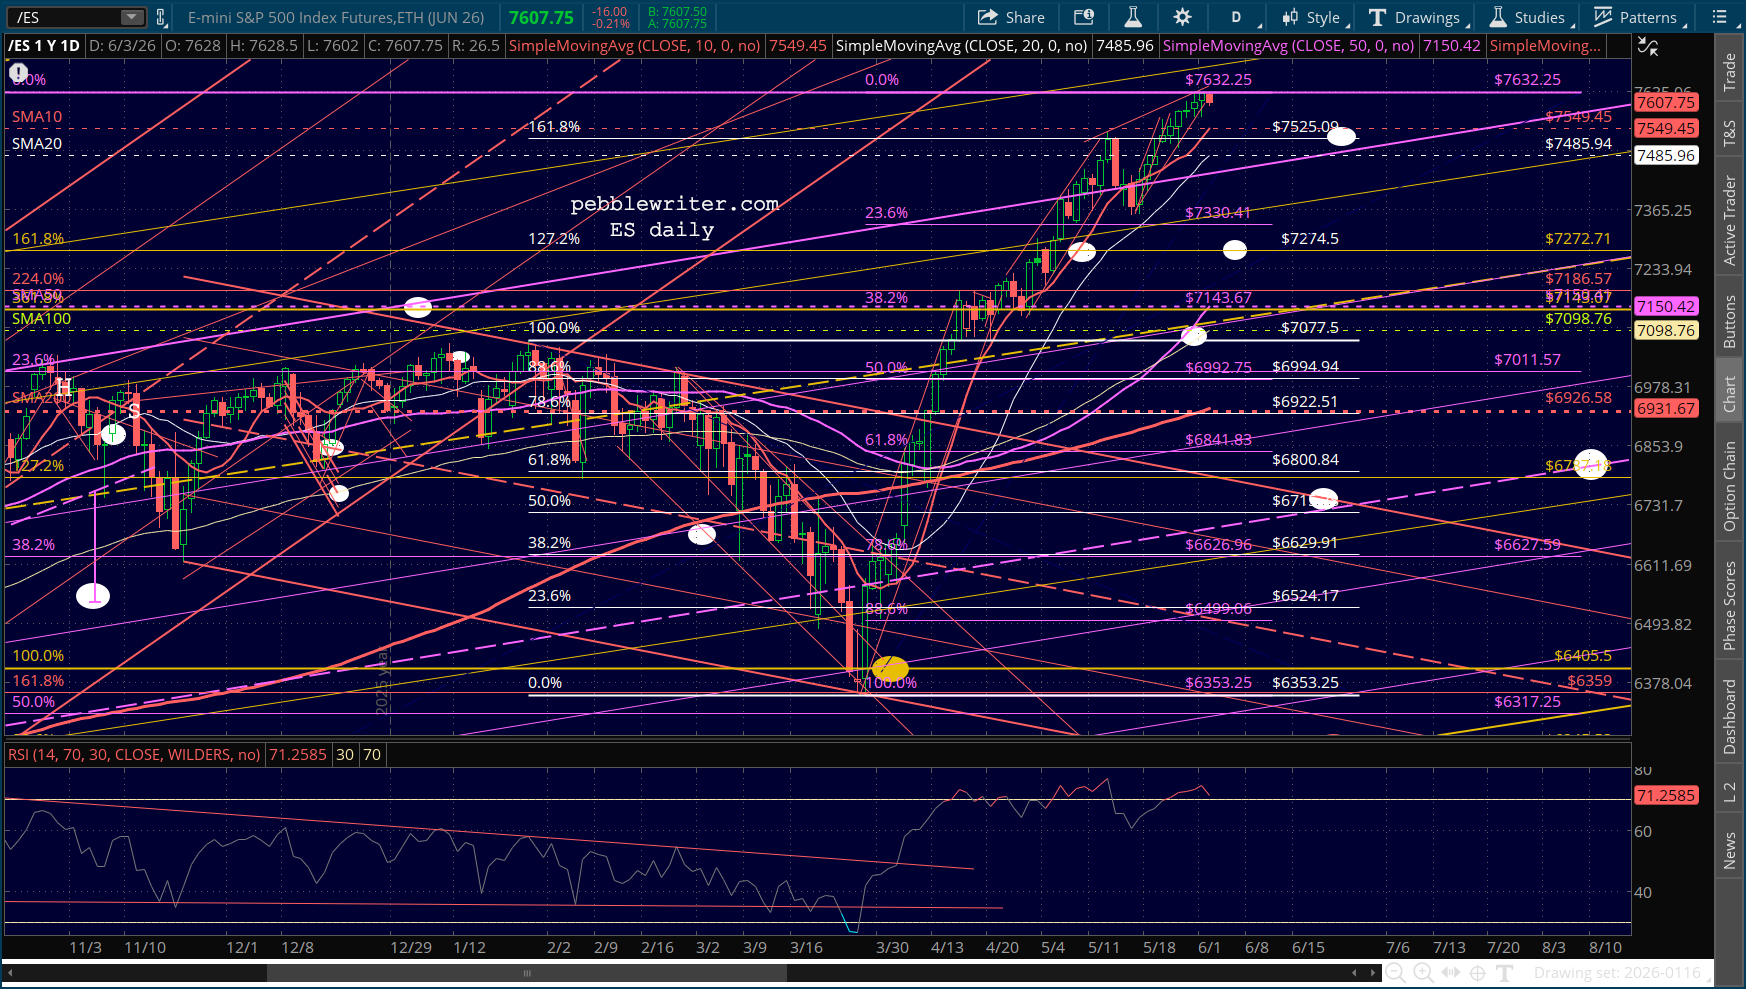
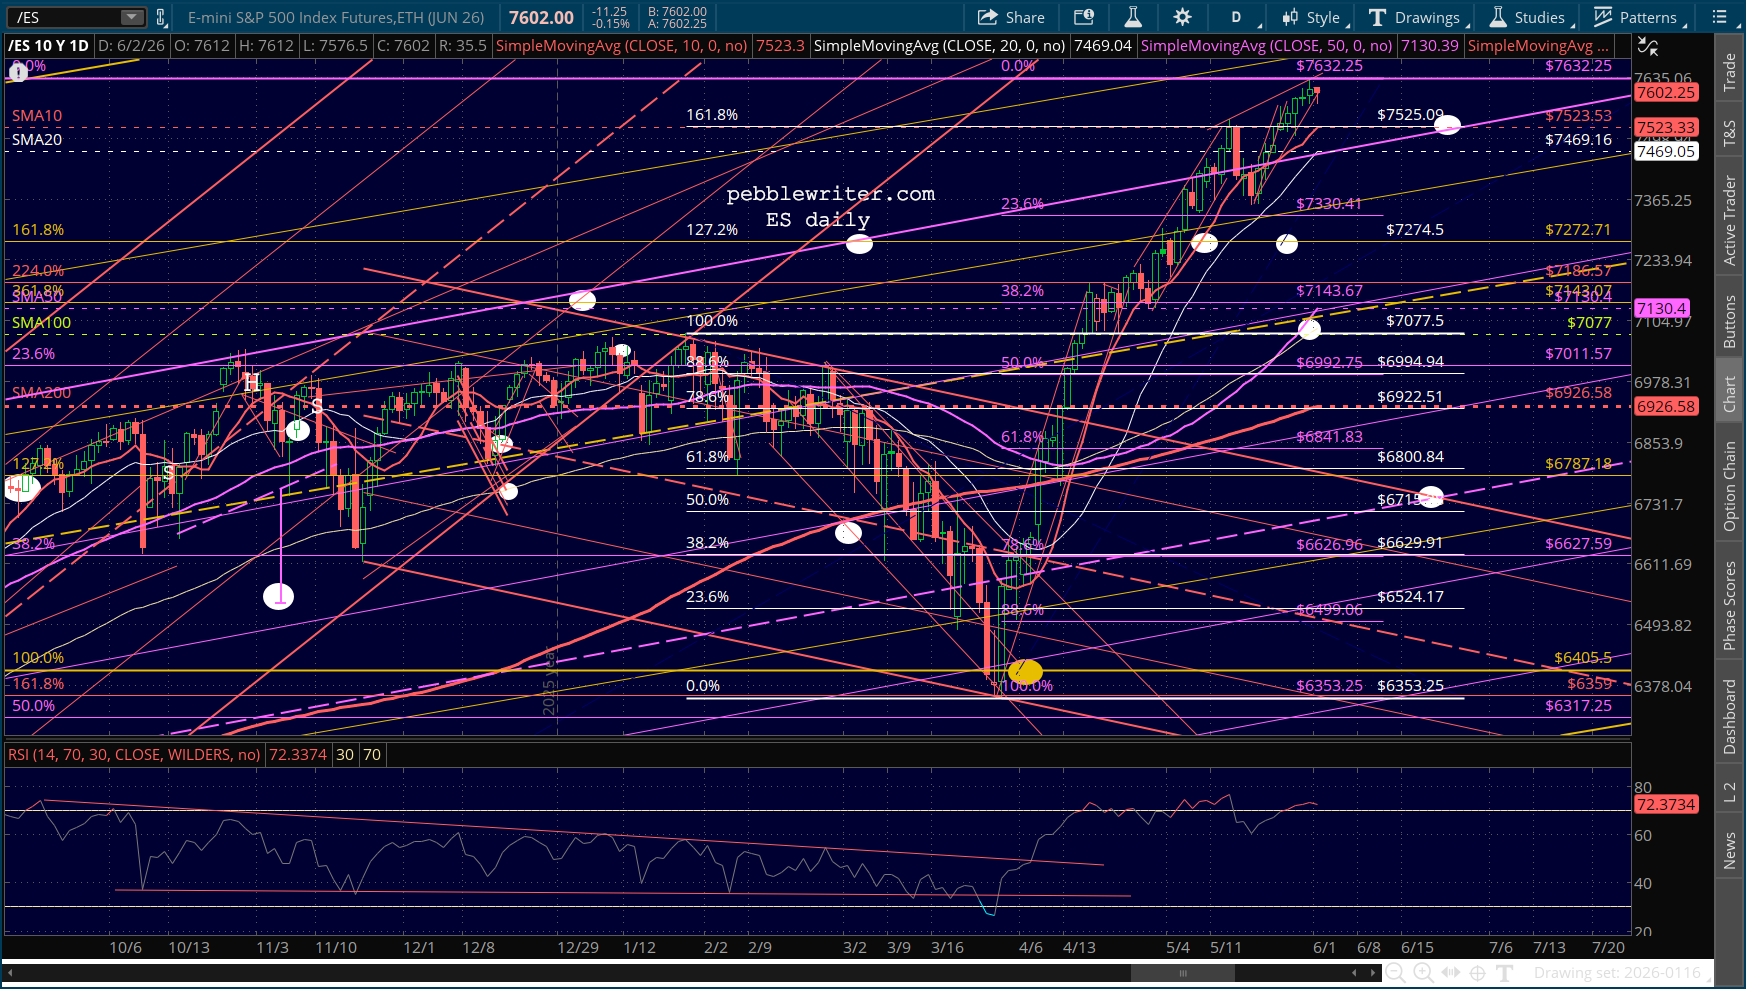
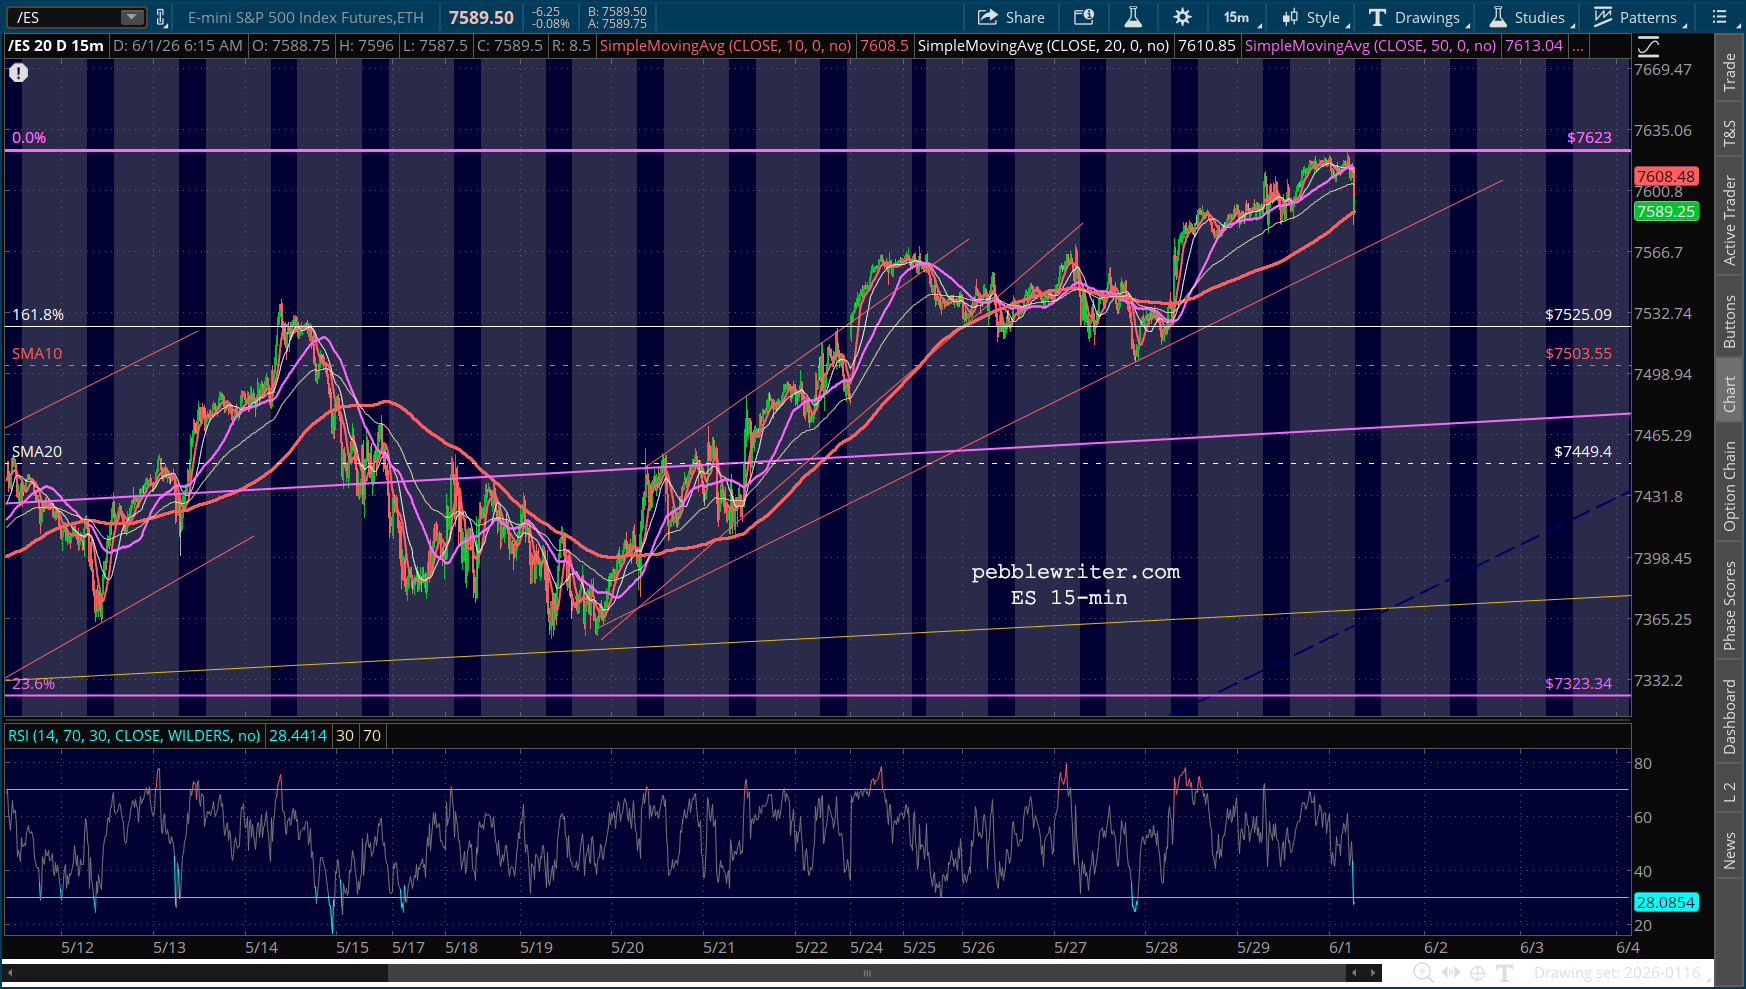
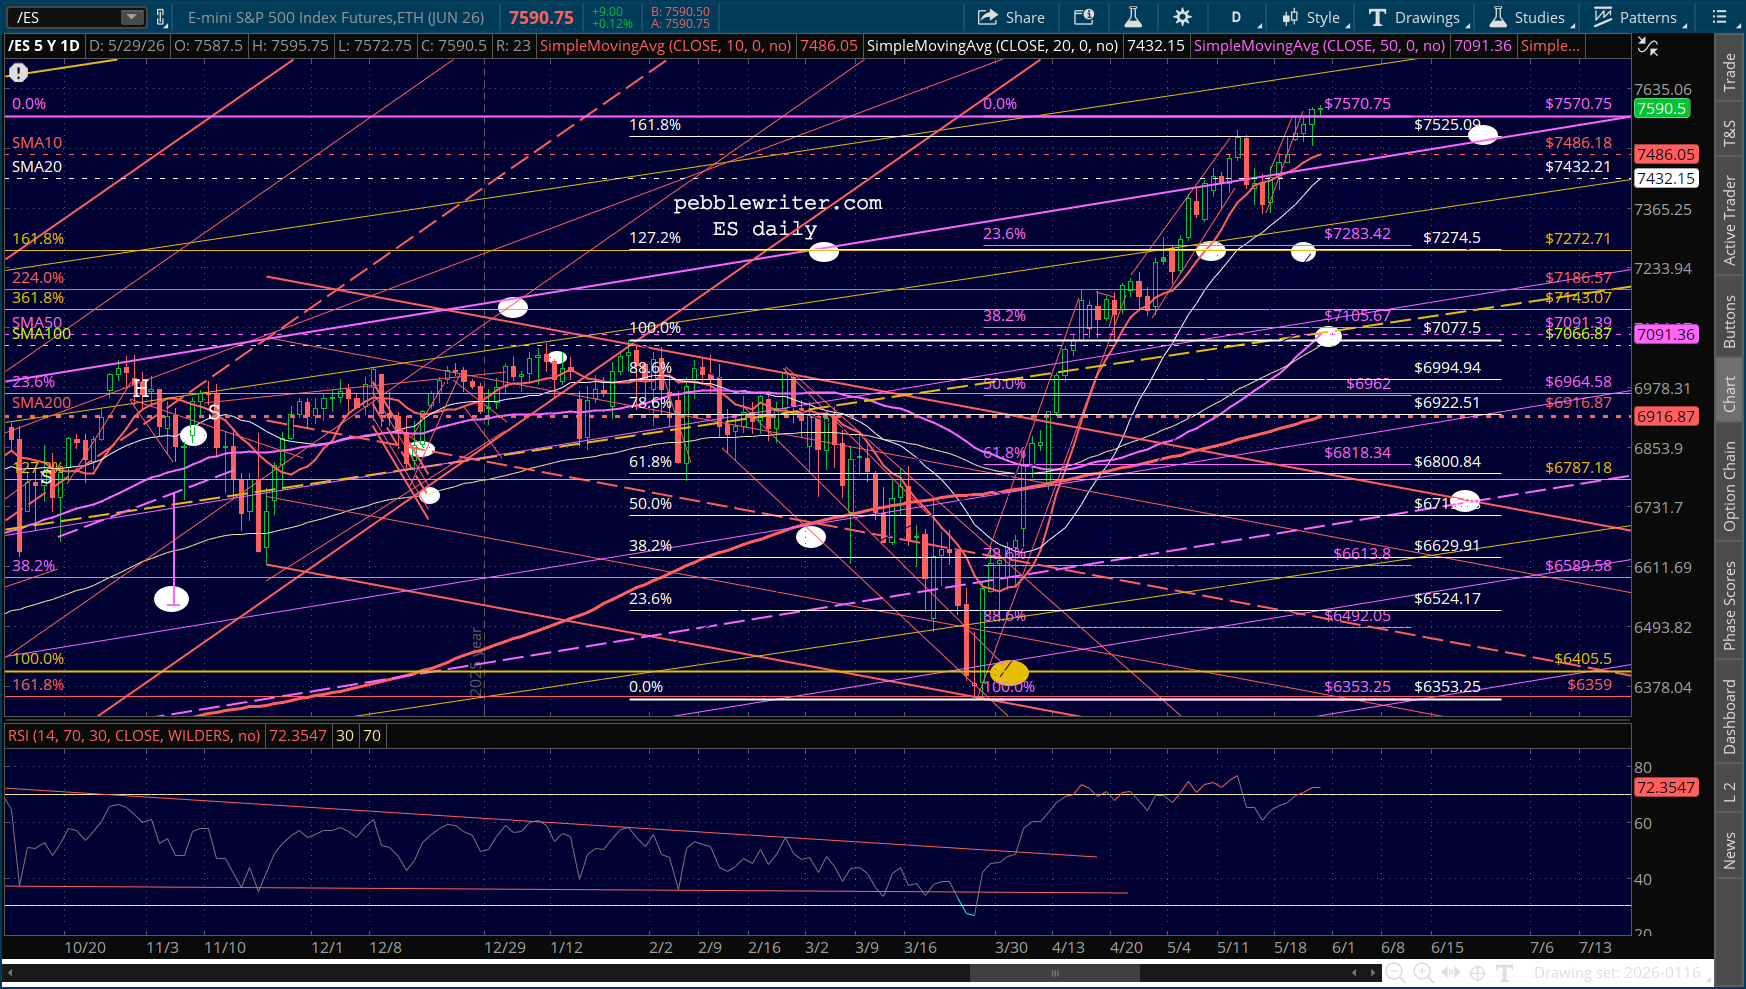
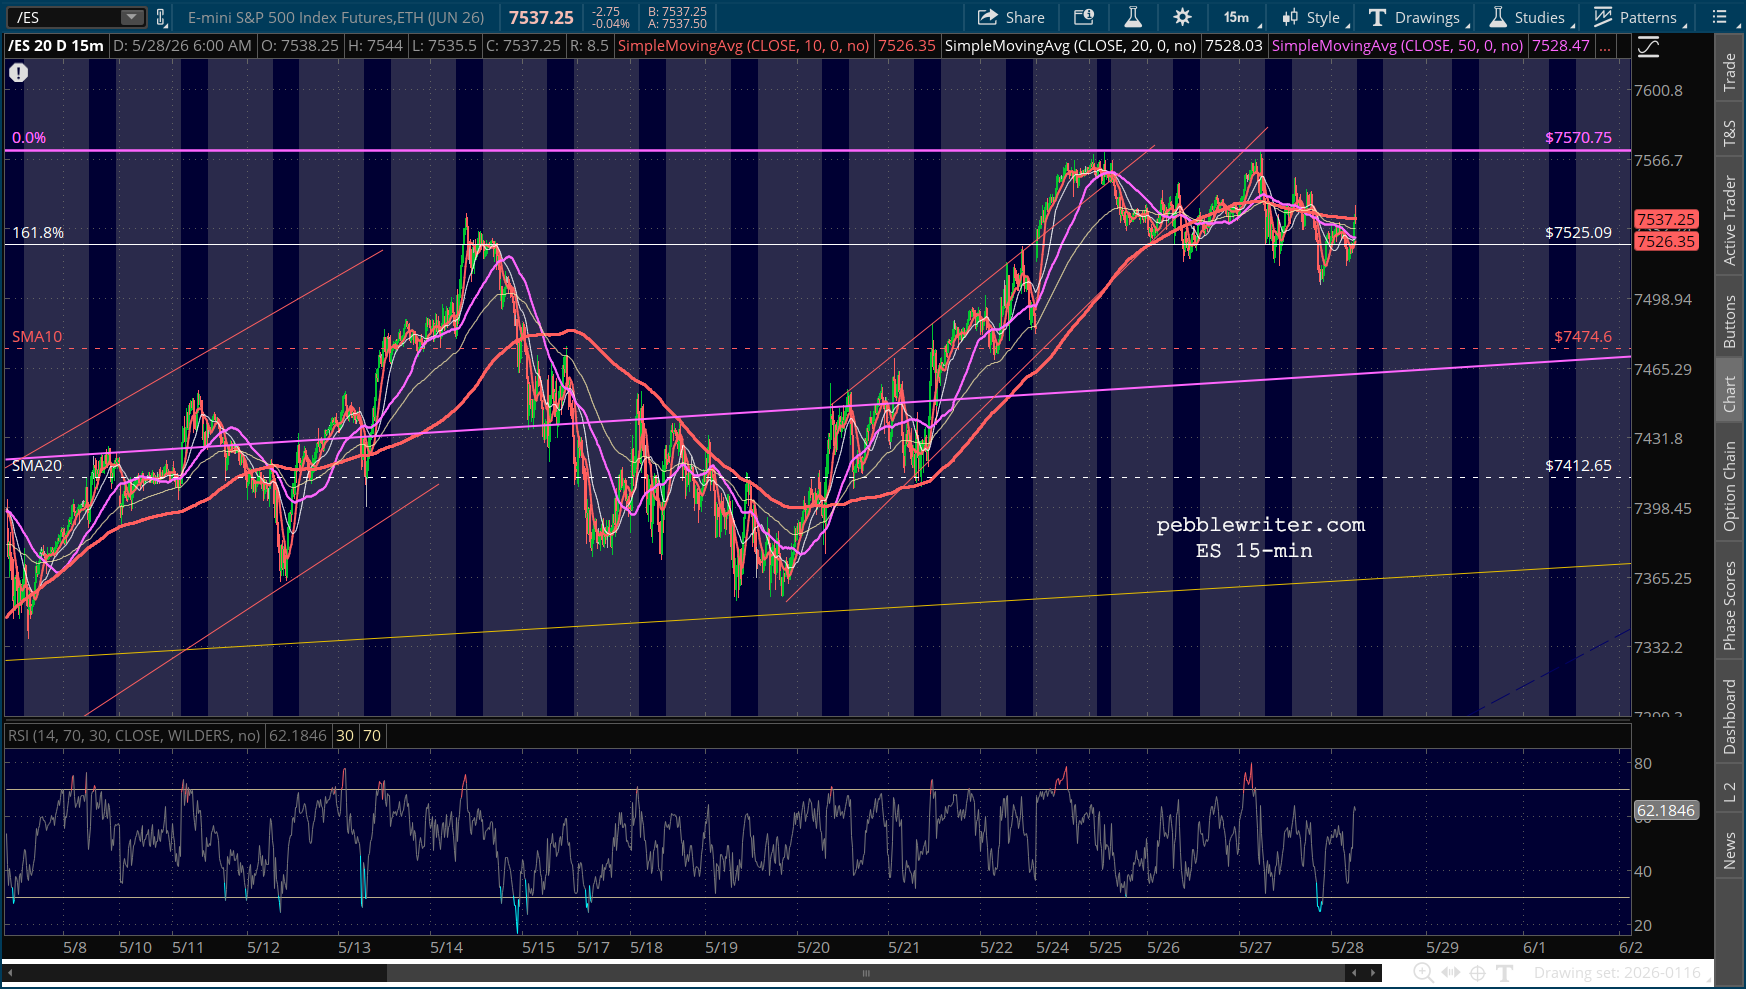
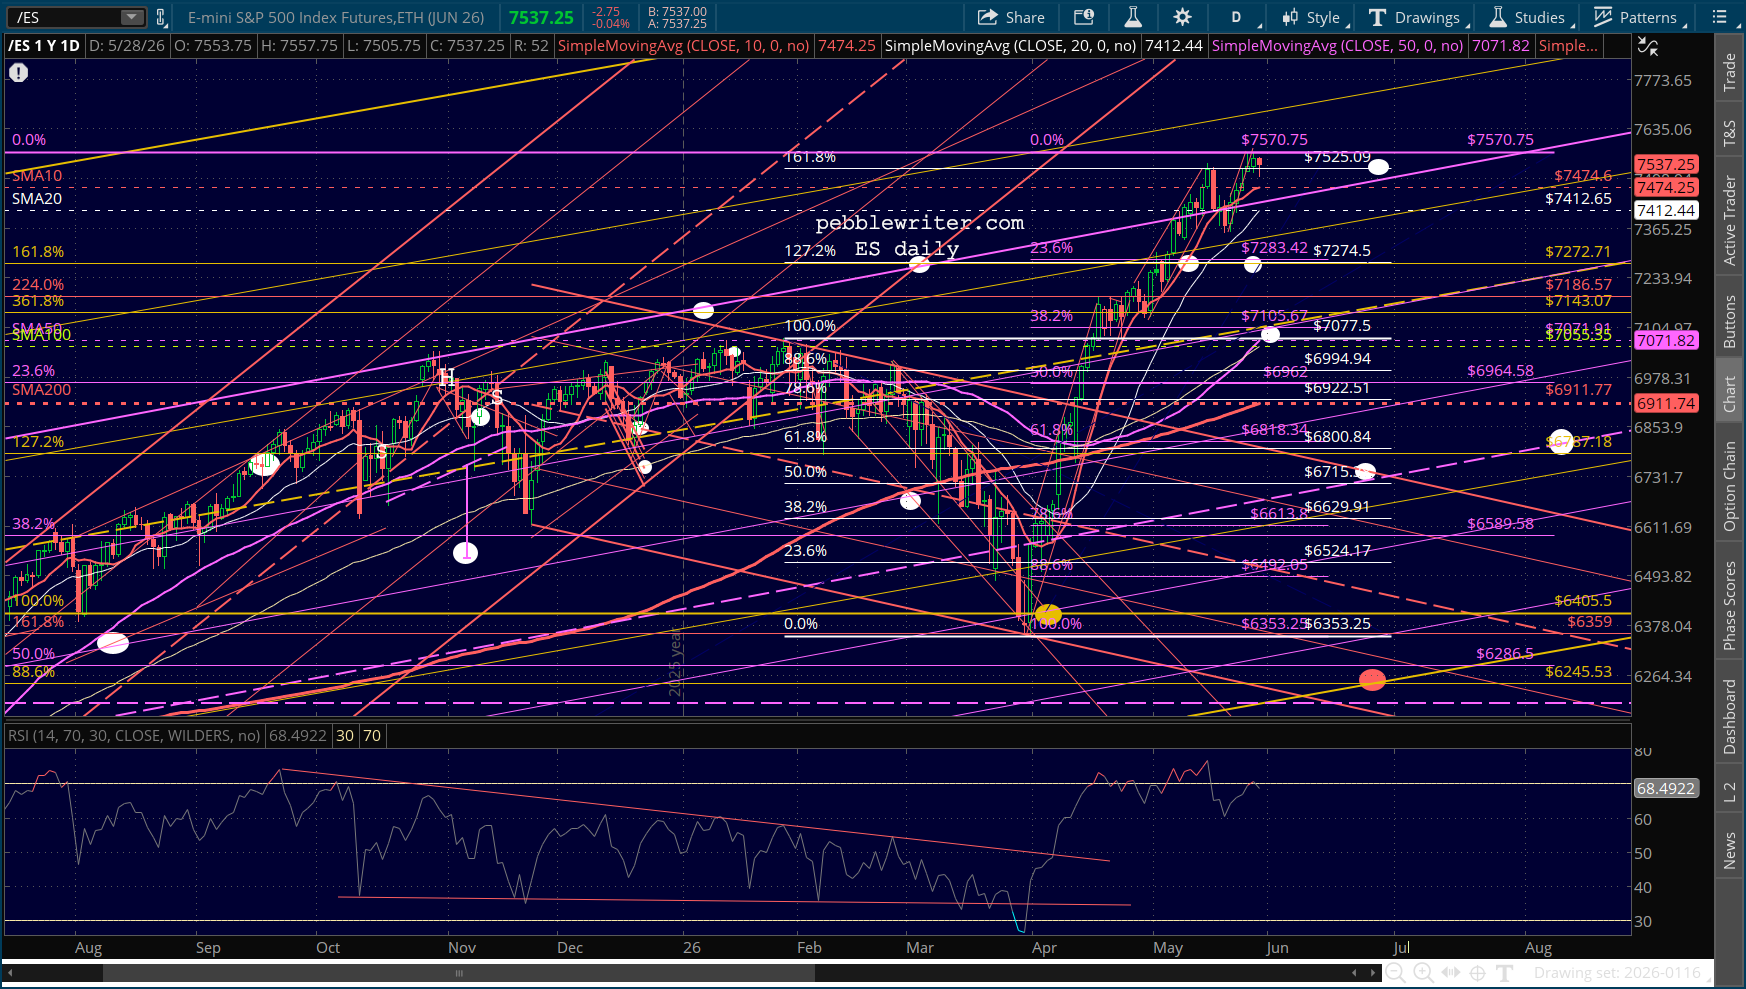
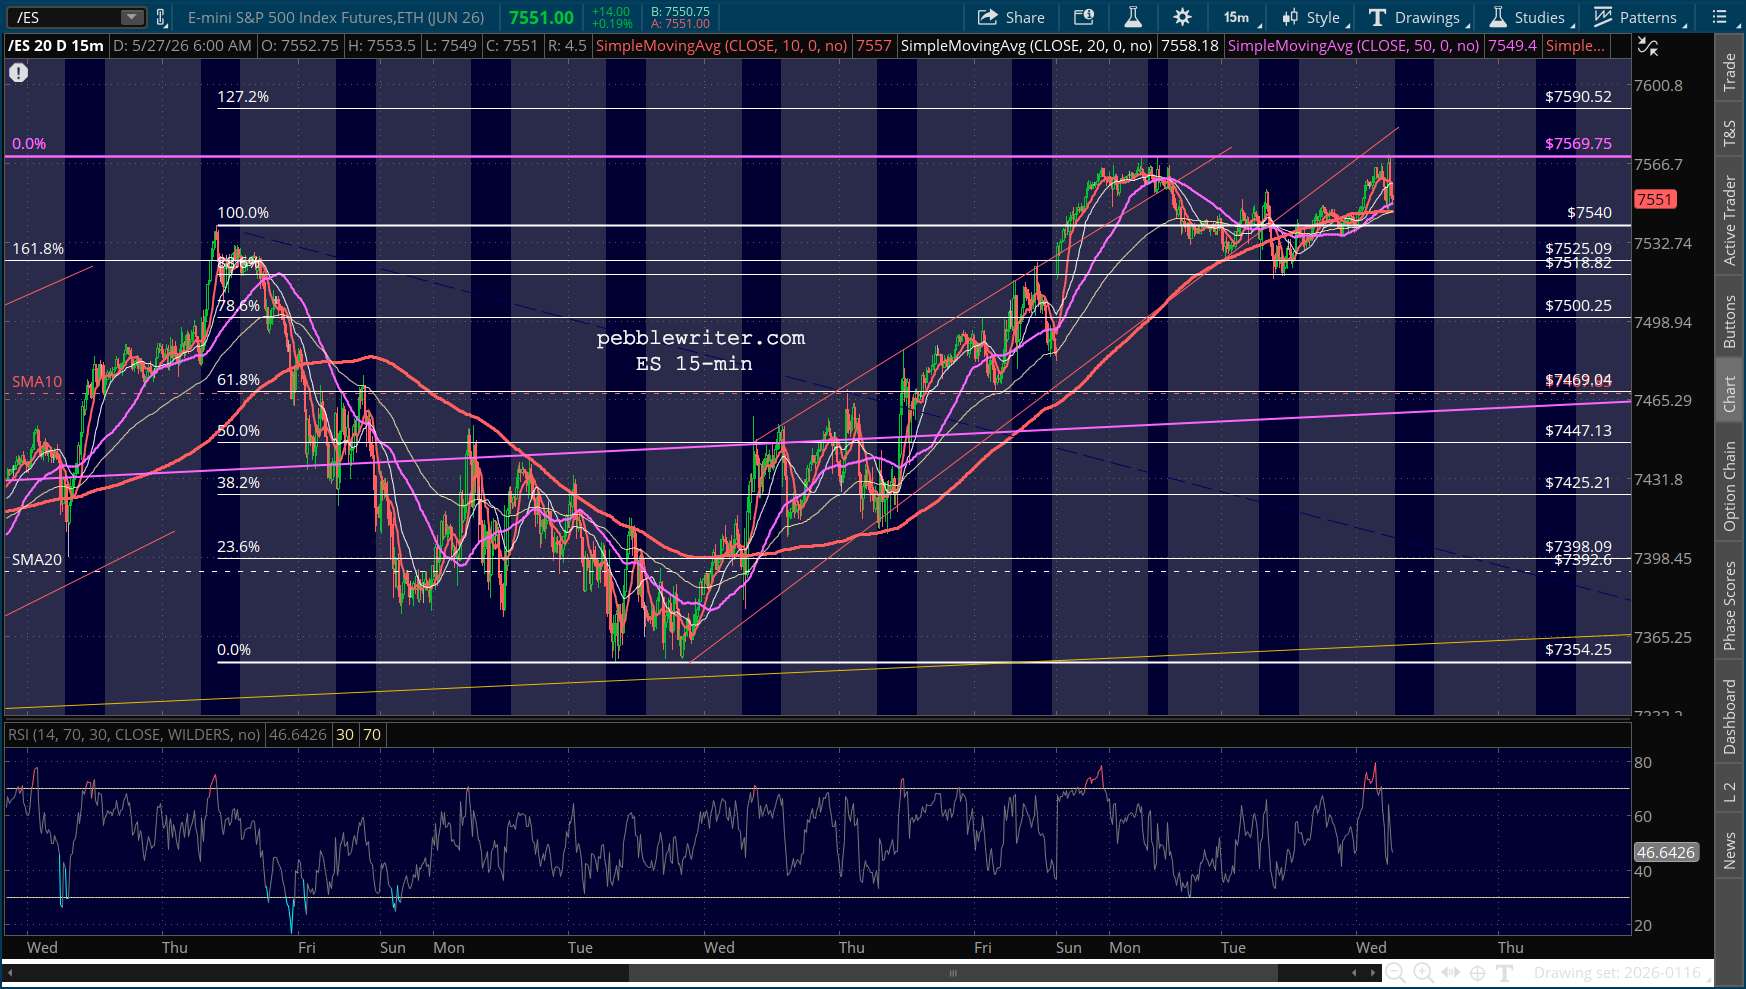
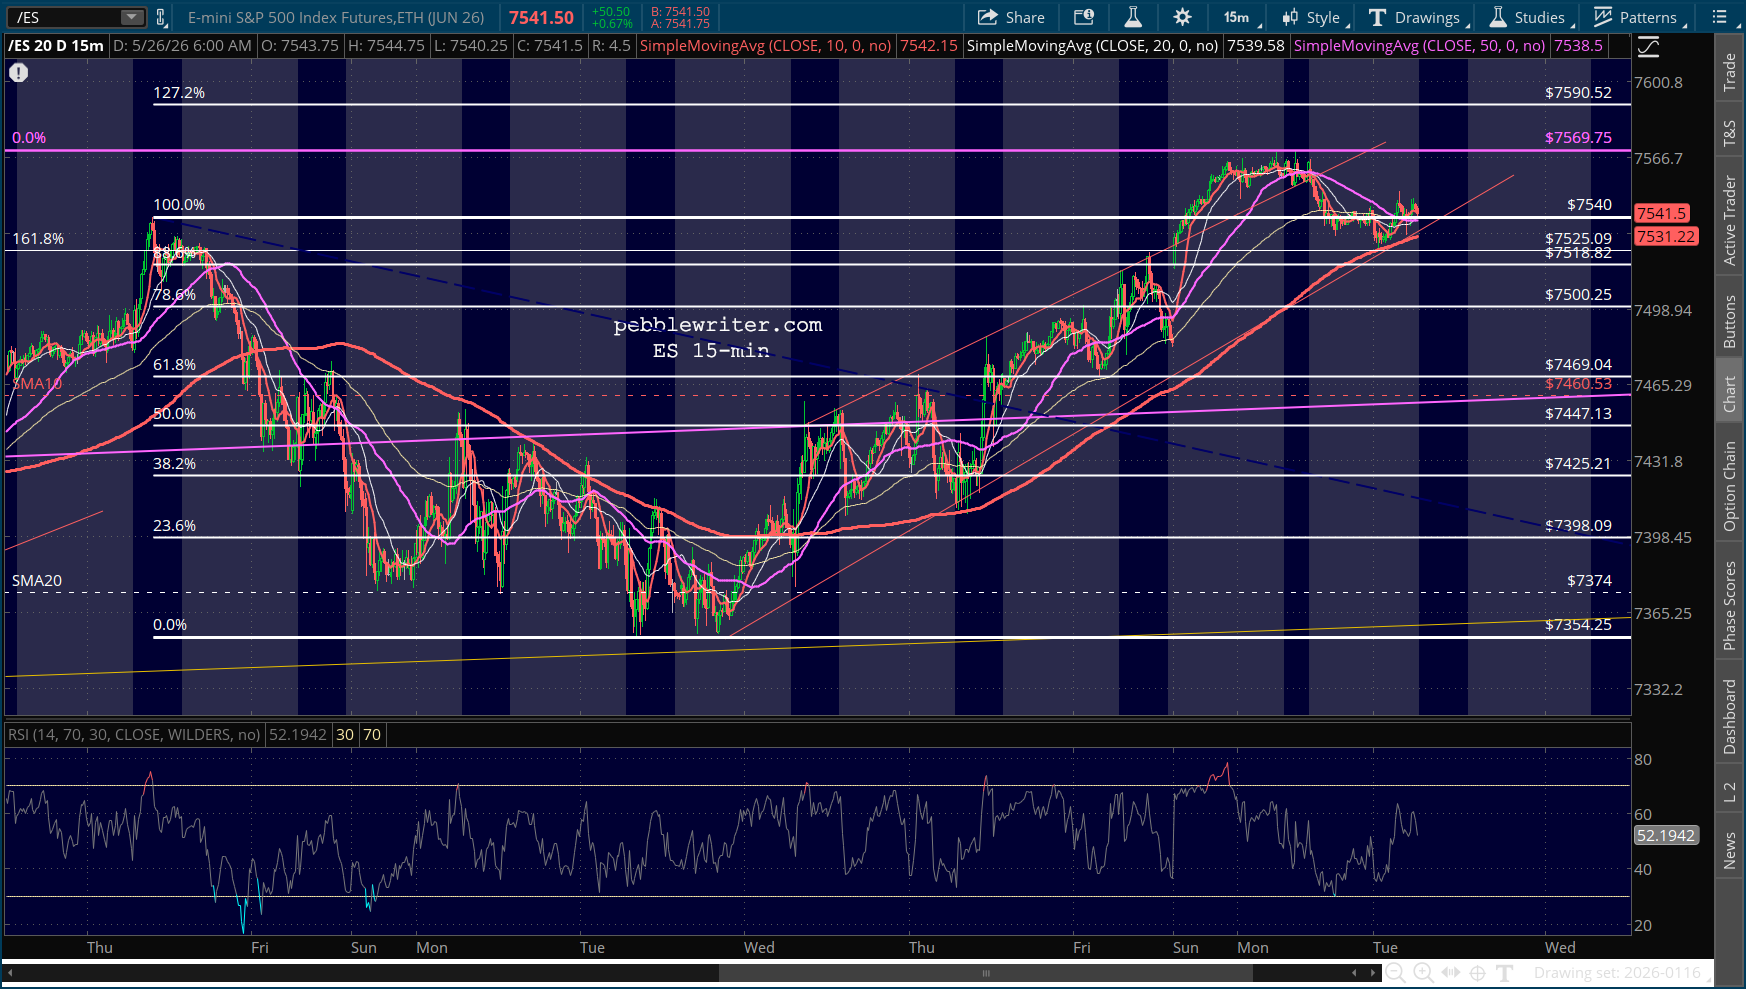
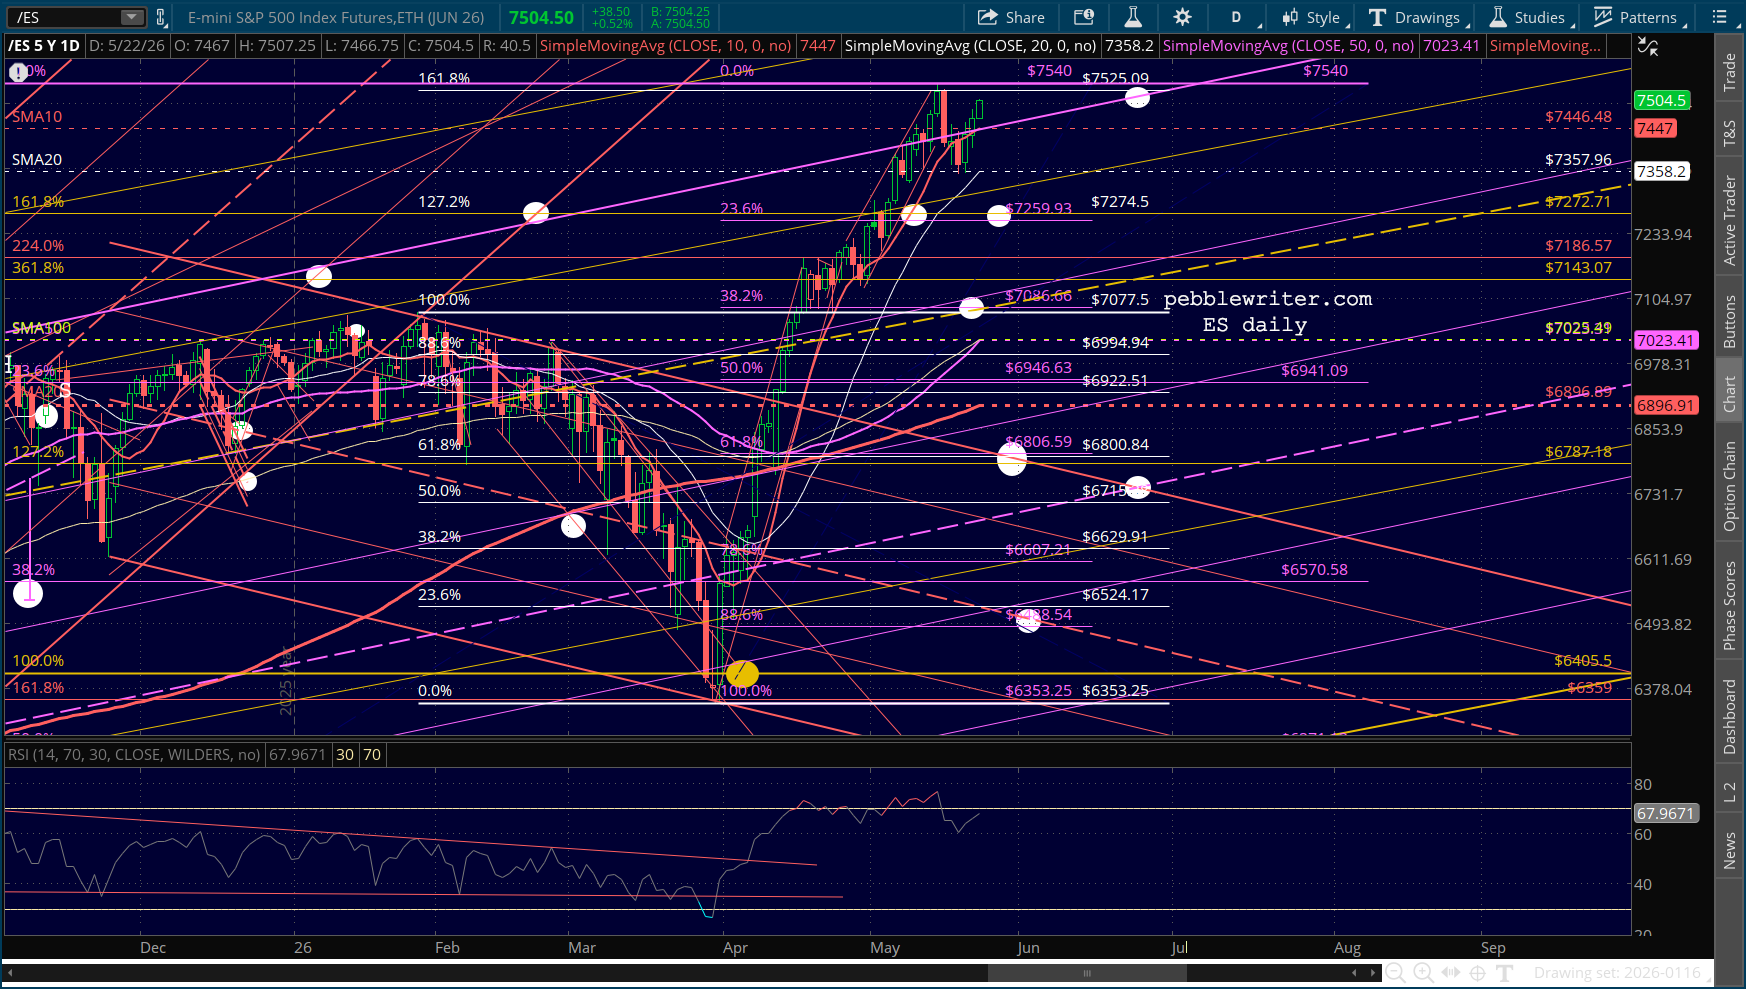
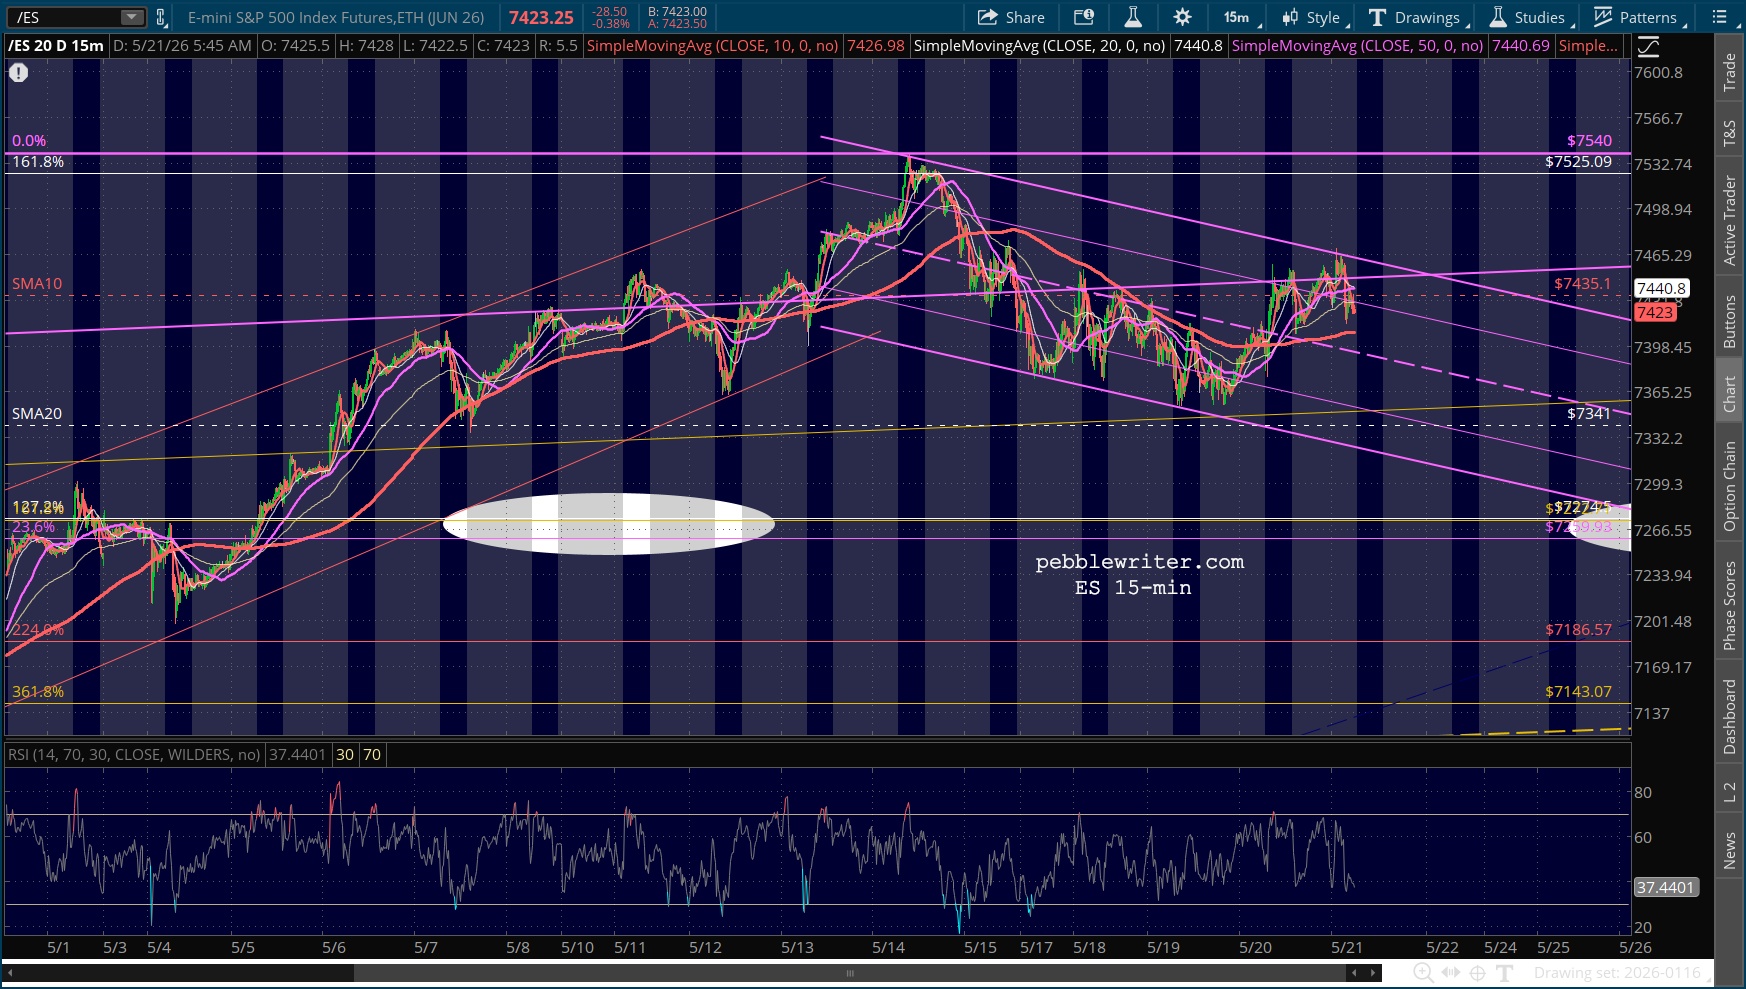
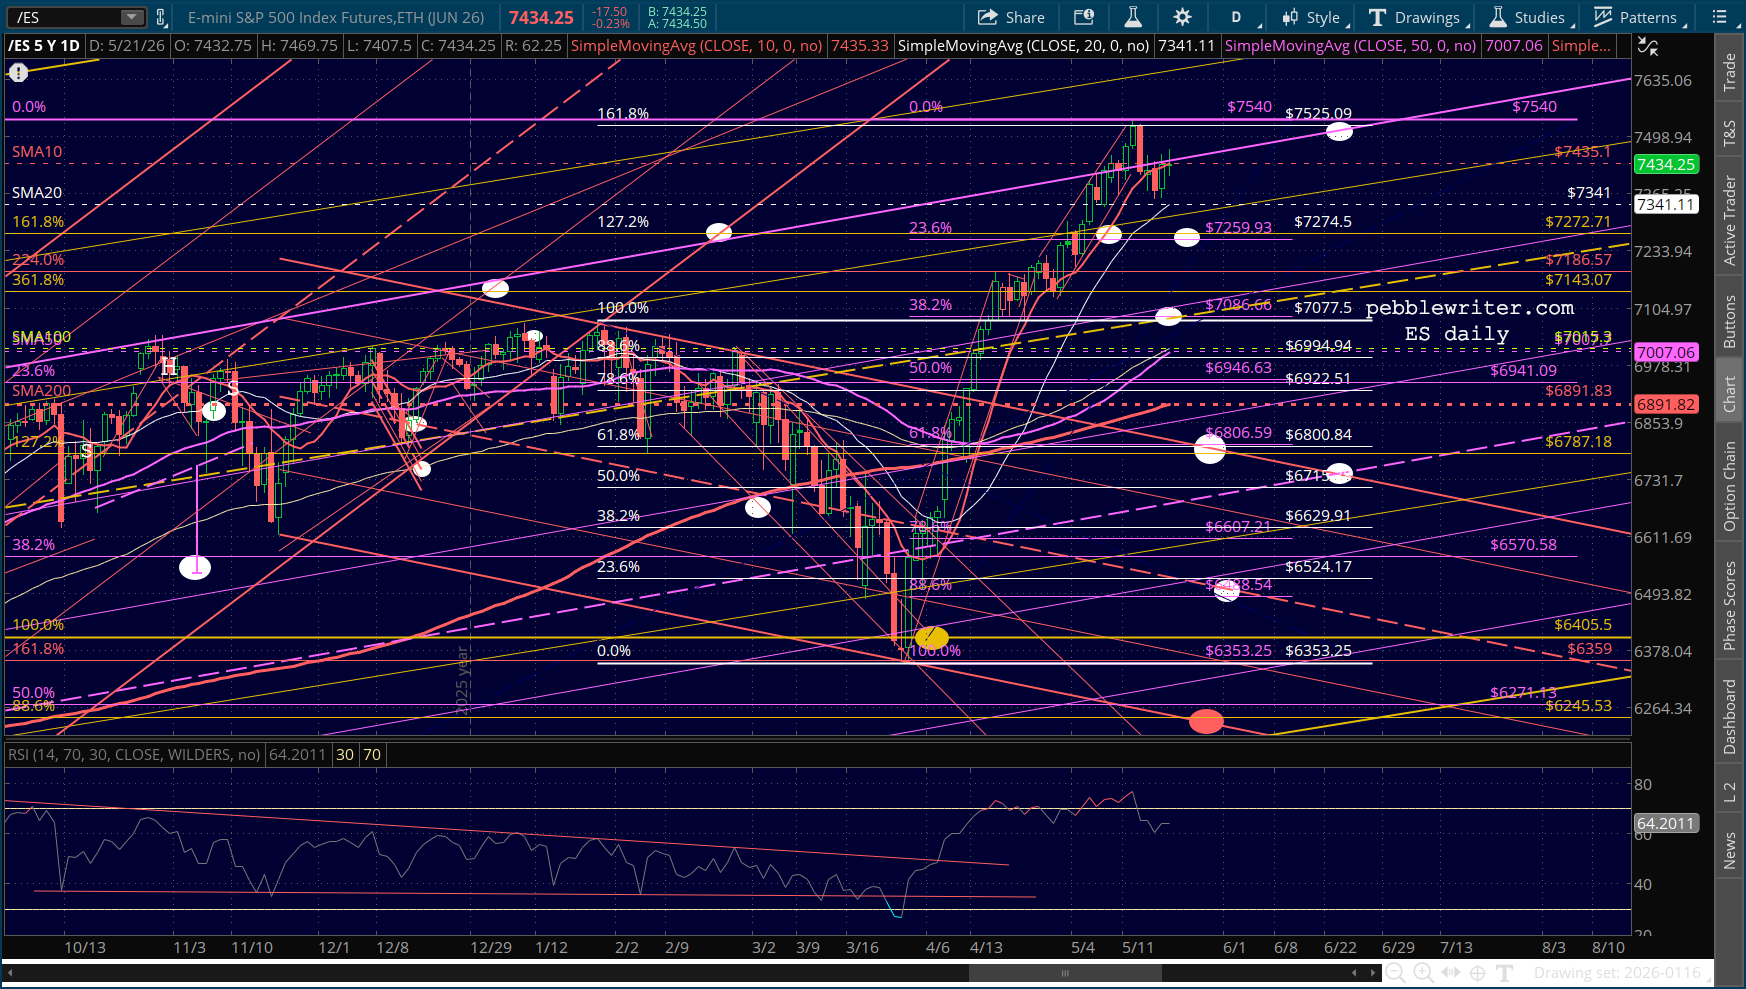
Such is the case with ES, which pushed up past its 1.618 Fib extension at 7525 after a very mild 2.5% stumble upon first reaching it two weeks ago.
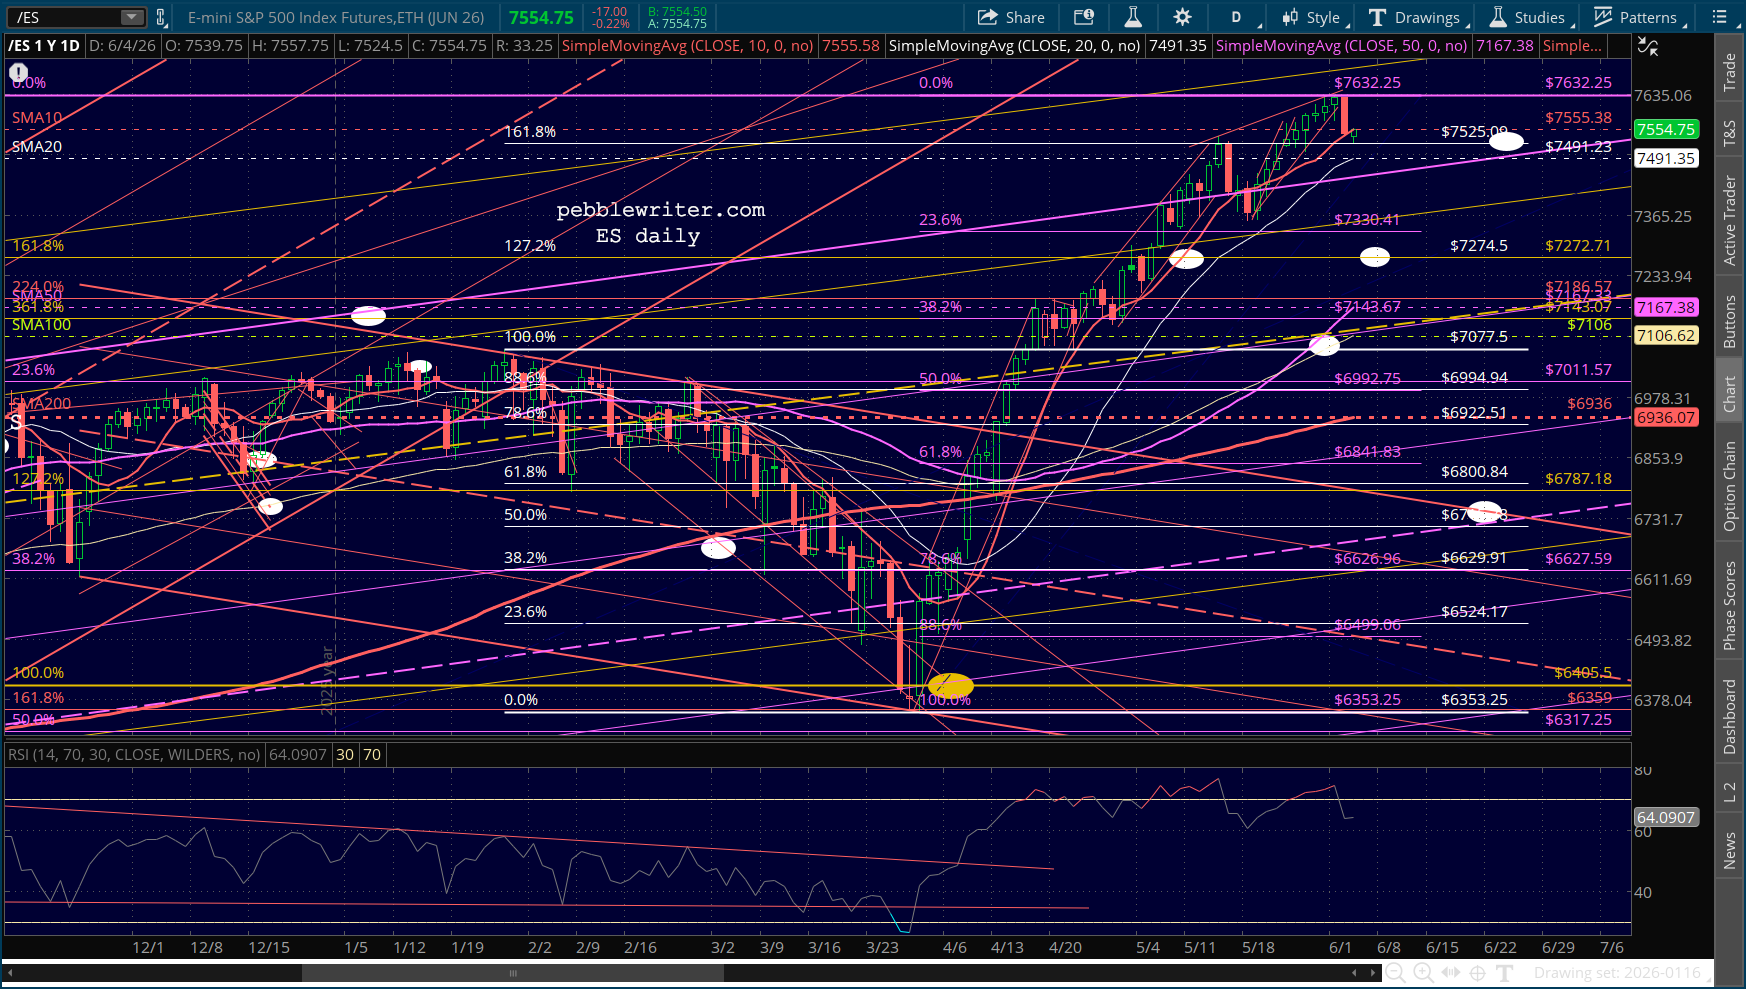
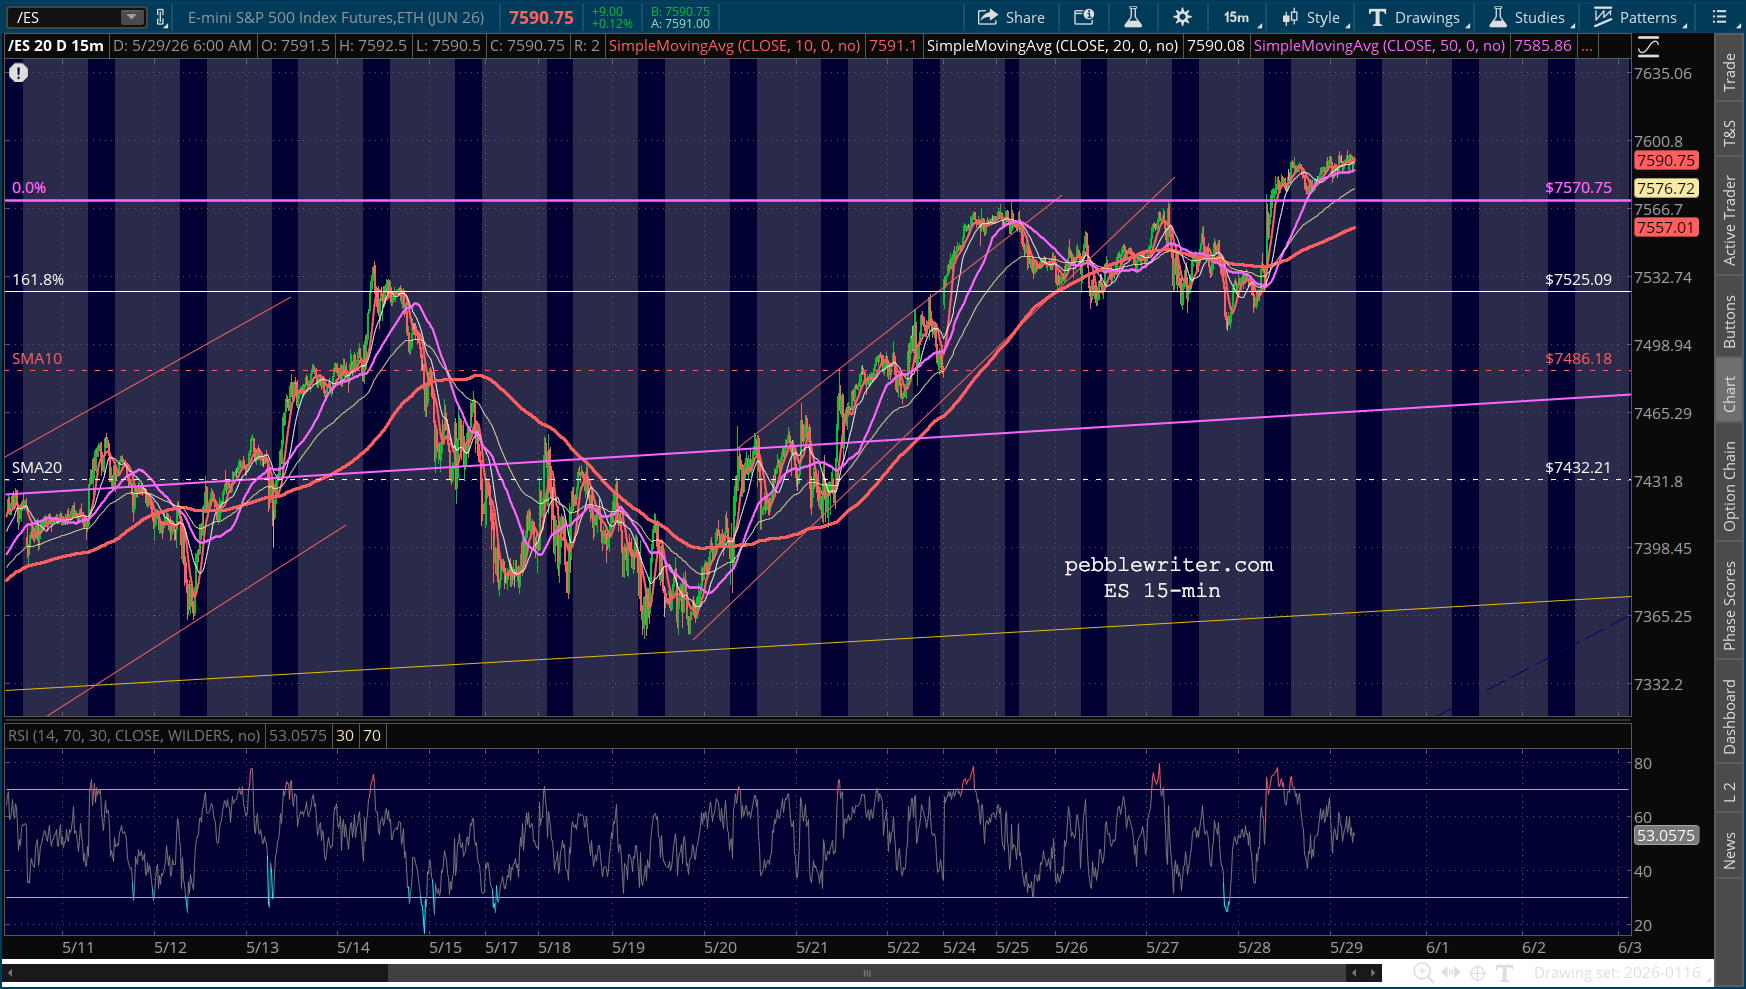
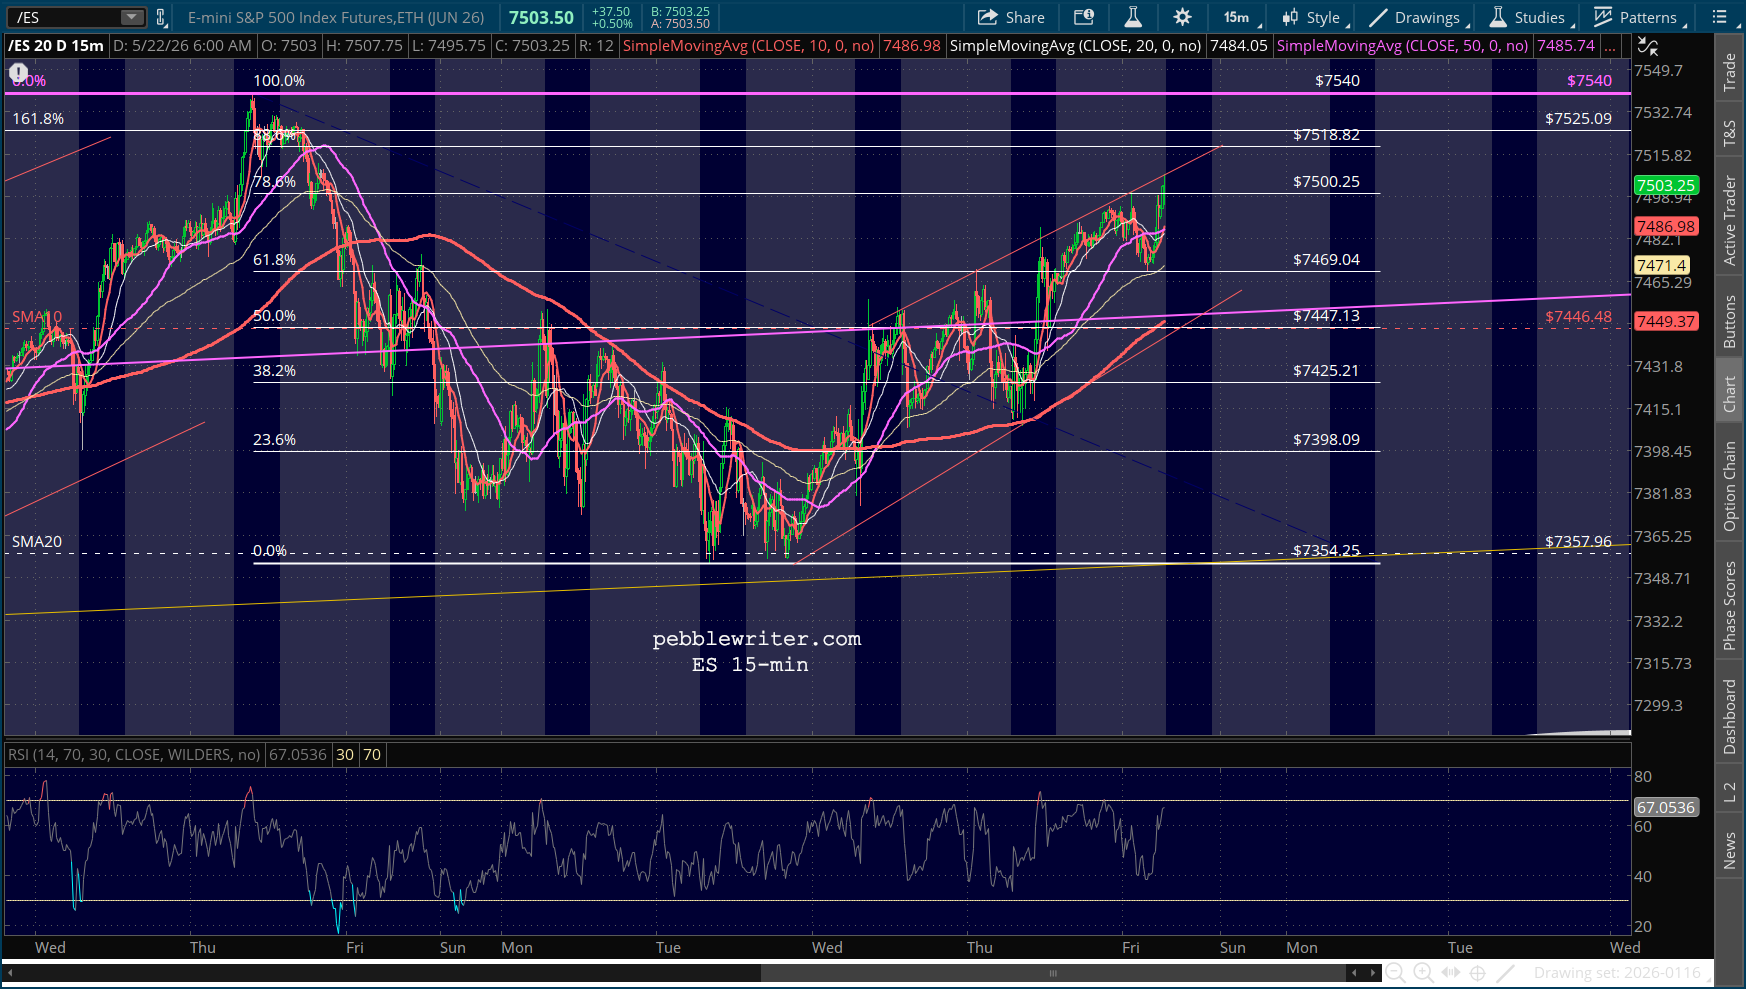
It came back and topped the 1.618 with ease (and help from the algos) seven sessions later. Last night, it executed a picture perfect backtest.

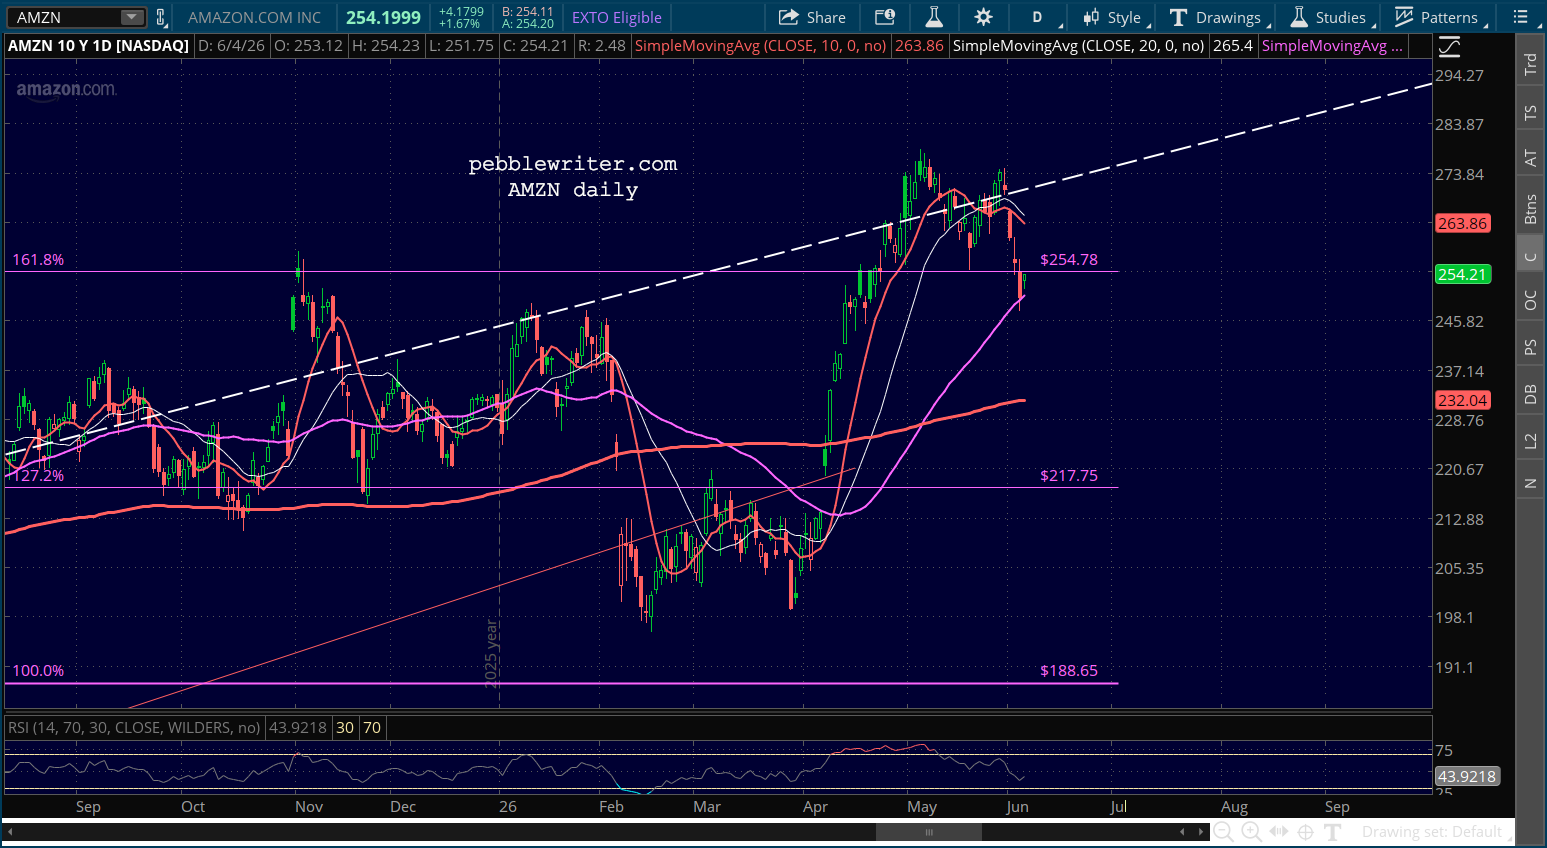
At the moment, it’s bumping up against its SMA10. And, it would surprise no one if it pushed past it, especially on a day when DJIA is up over 500 points. But, there are a few concerning issues, not the least of which is AMZN – a bellweather of the US economy if there ever was one.
It pushed past its 1.618 in late April, then cleanly backtested it on May 19 and again on 6/2 – just in case the bears weren’t paying attention. It was a strong message. But, then something strange happened: it failed, closing 2.5% lower yesterday. Granted, it tagged the normally supportive SMA50 and is 1.2% higher this morning. But, it hasn’t pushed back above the 1.618. Hard to know what to expect next. But, for now, it’s one of those things worth keeping an eye on.
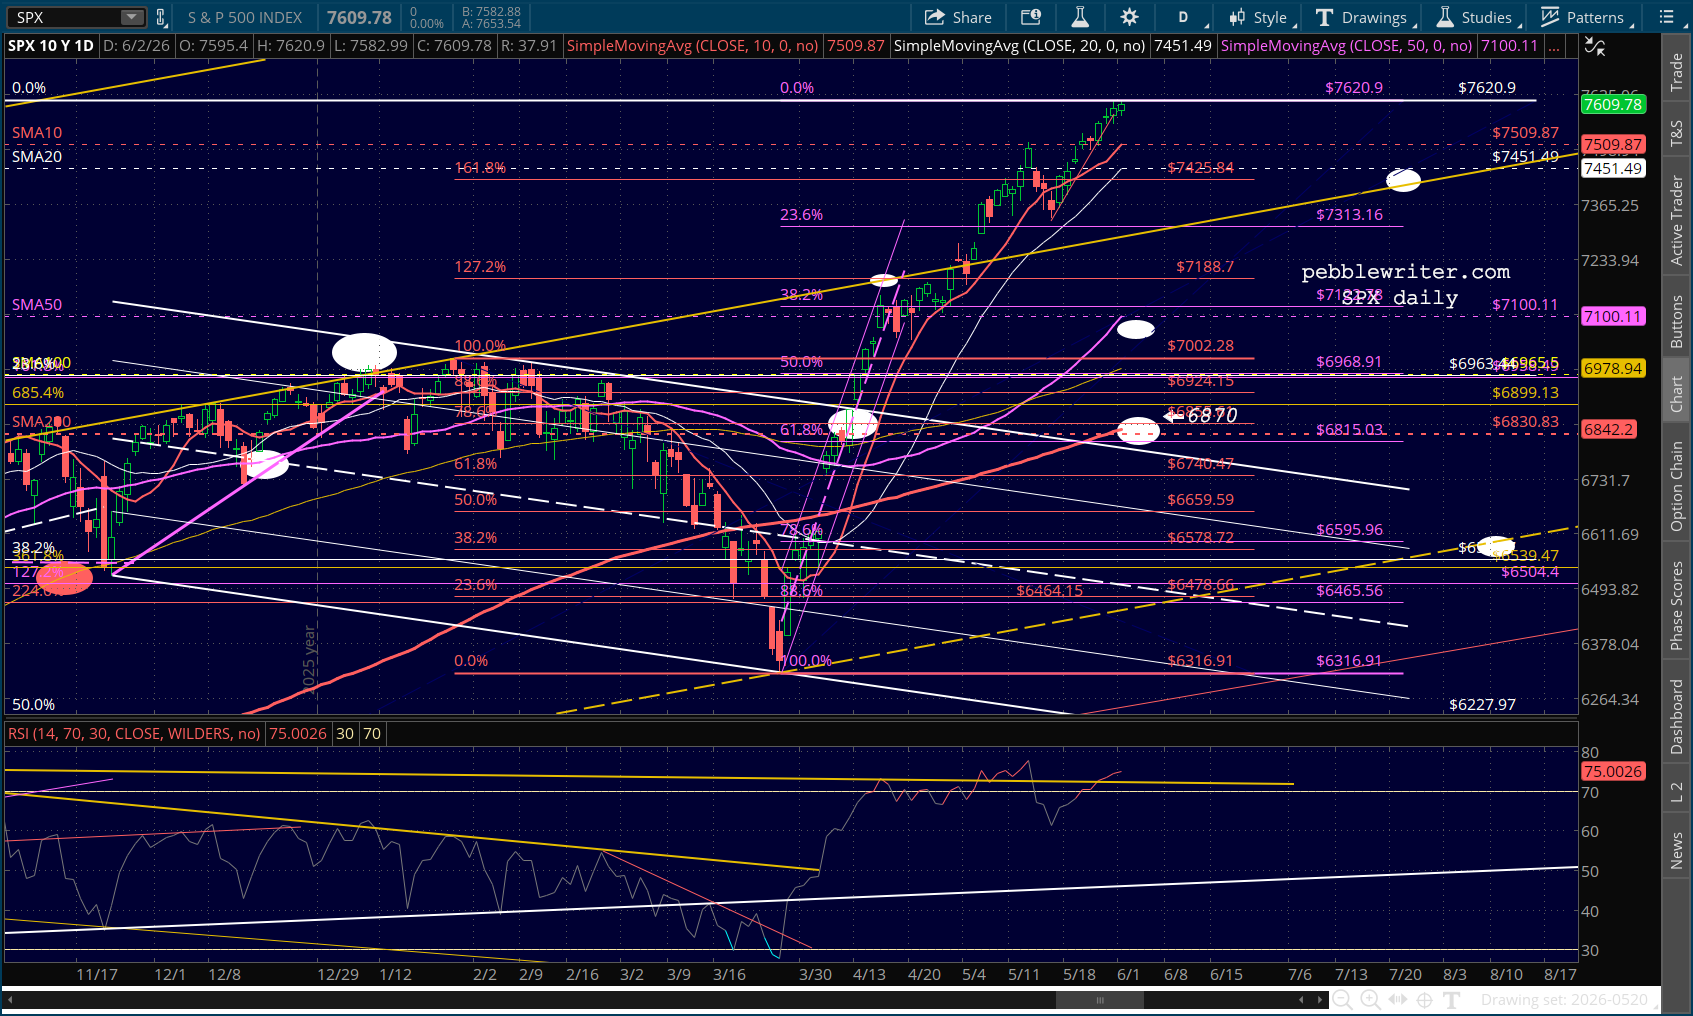
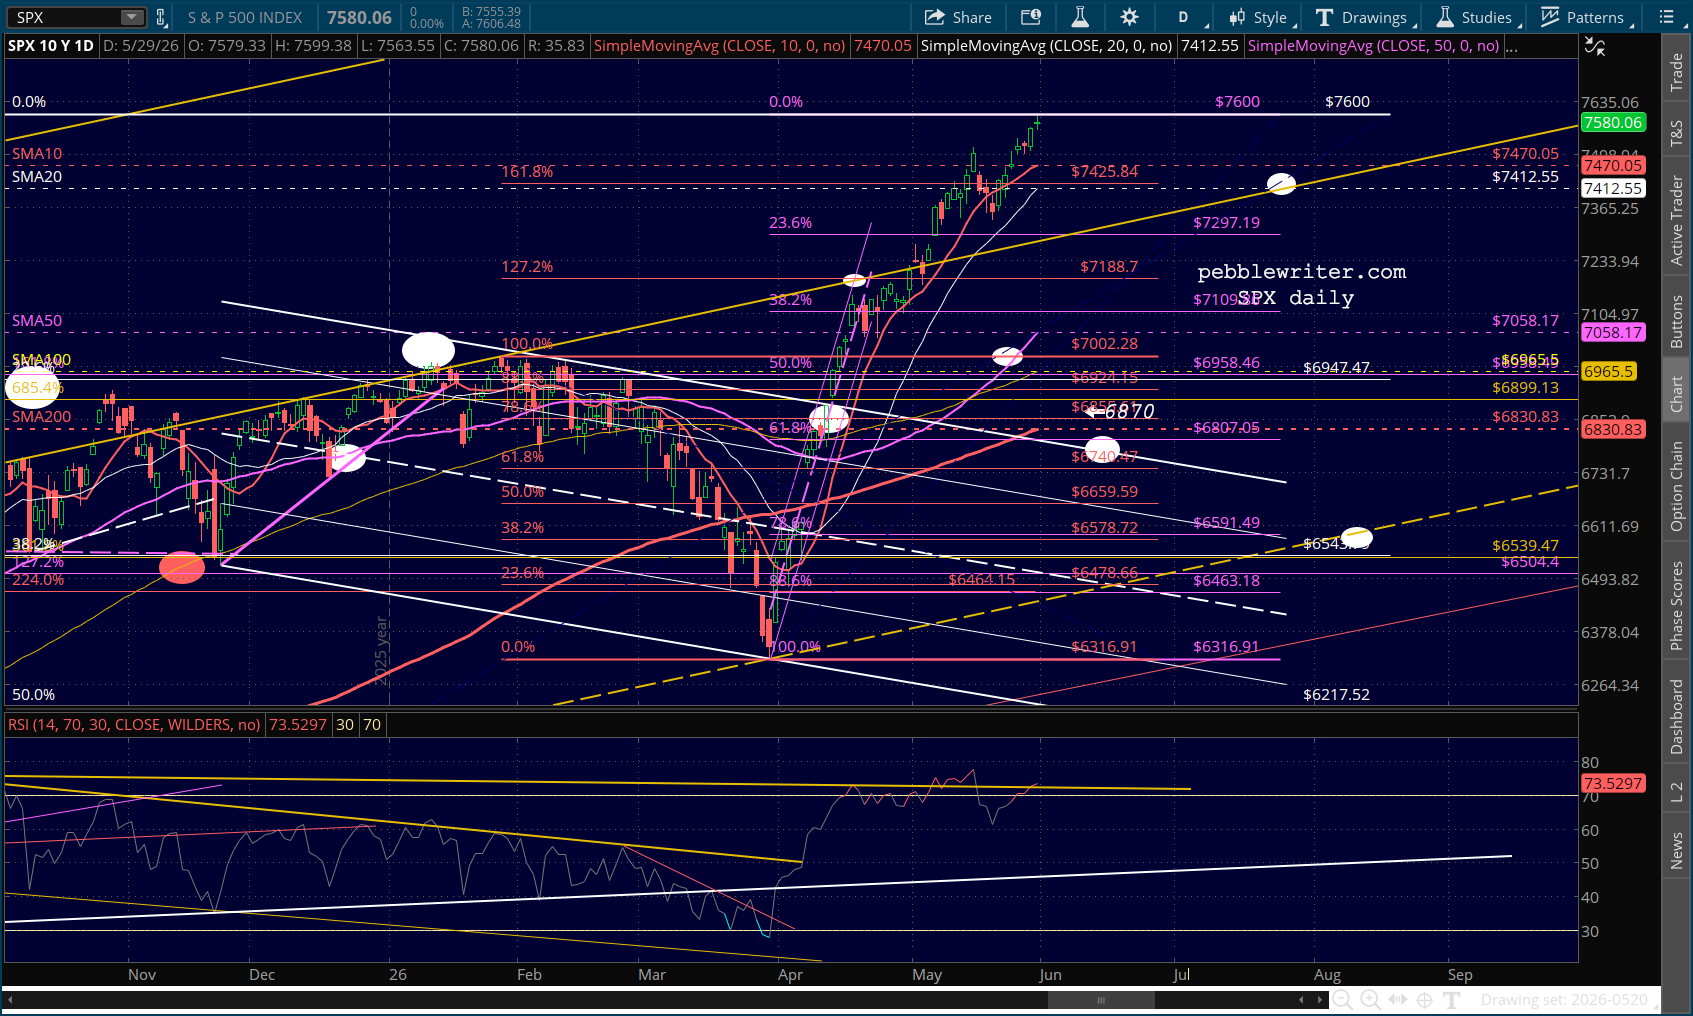
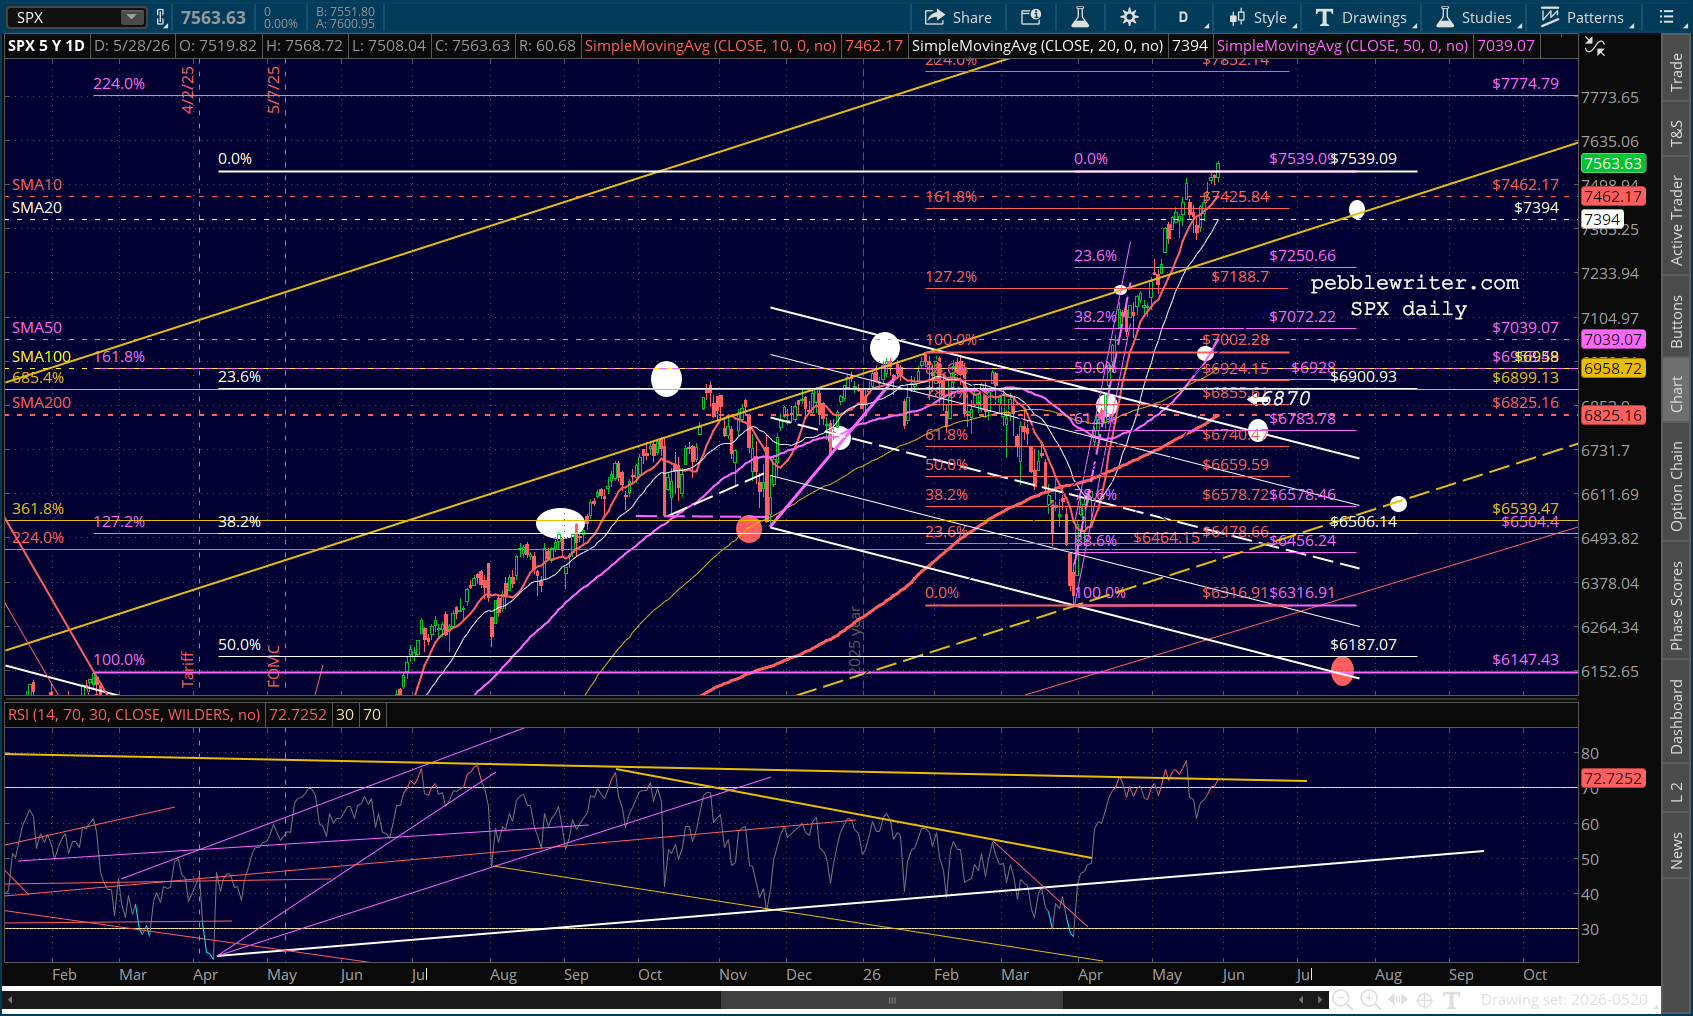
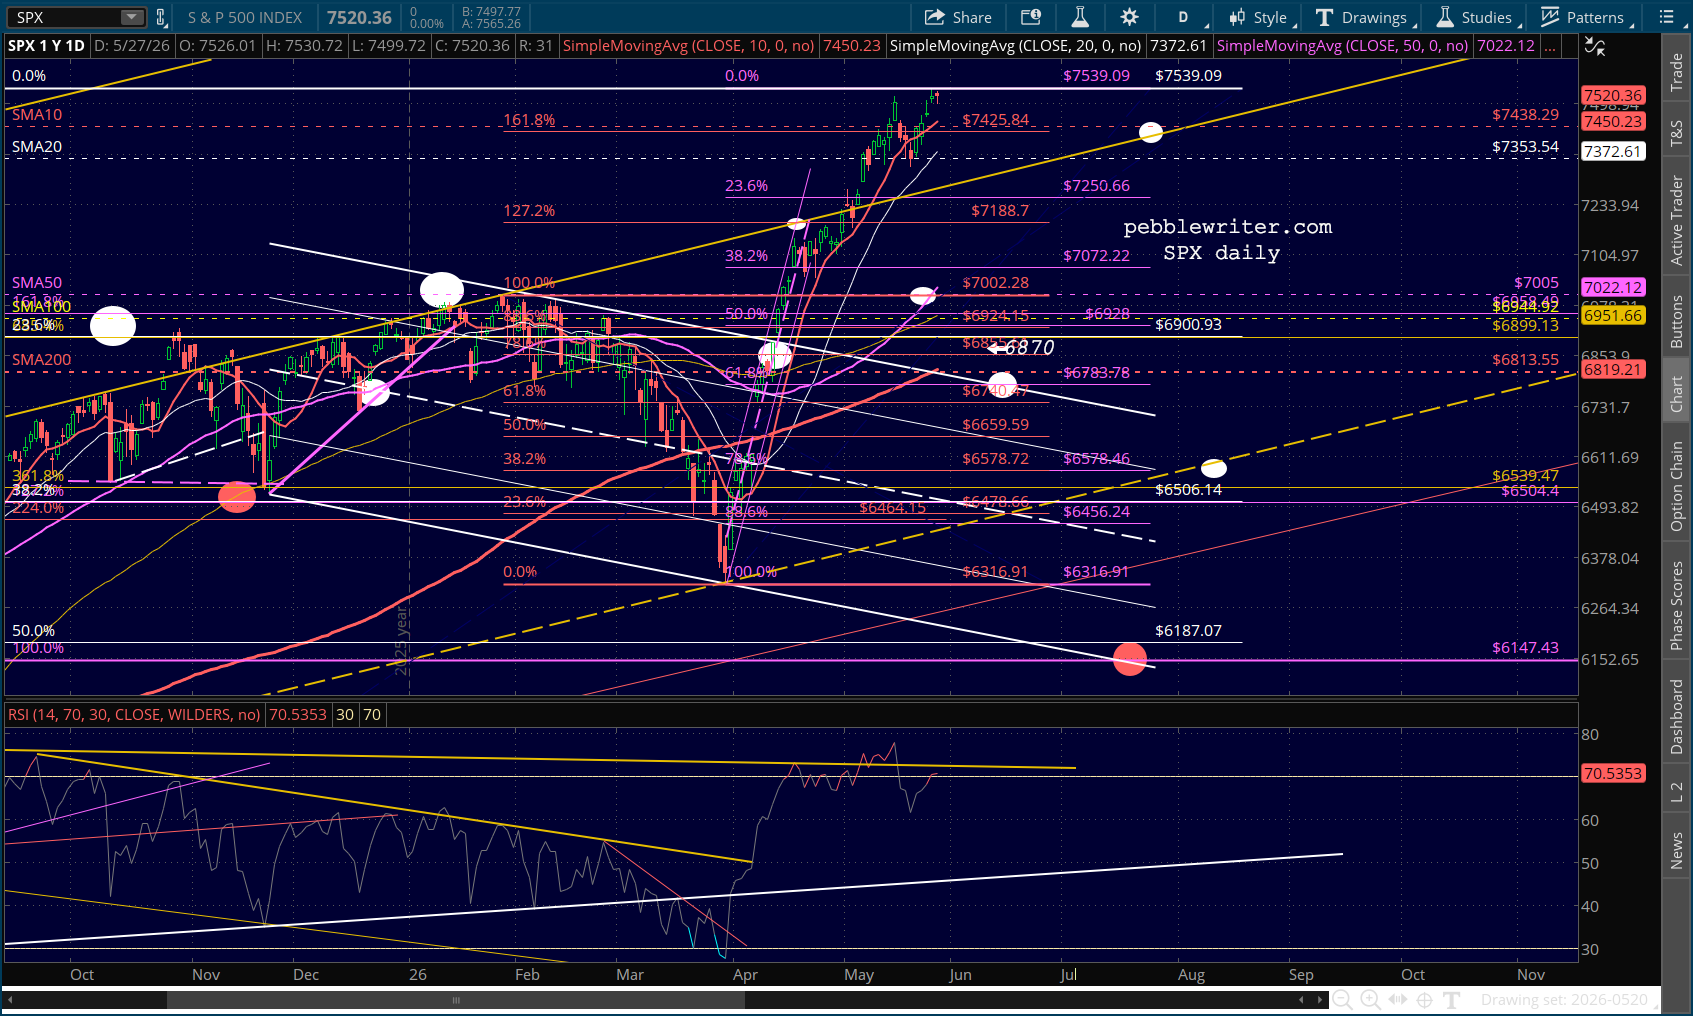
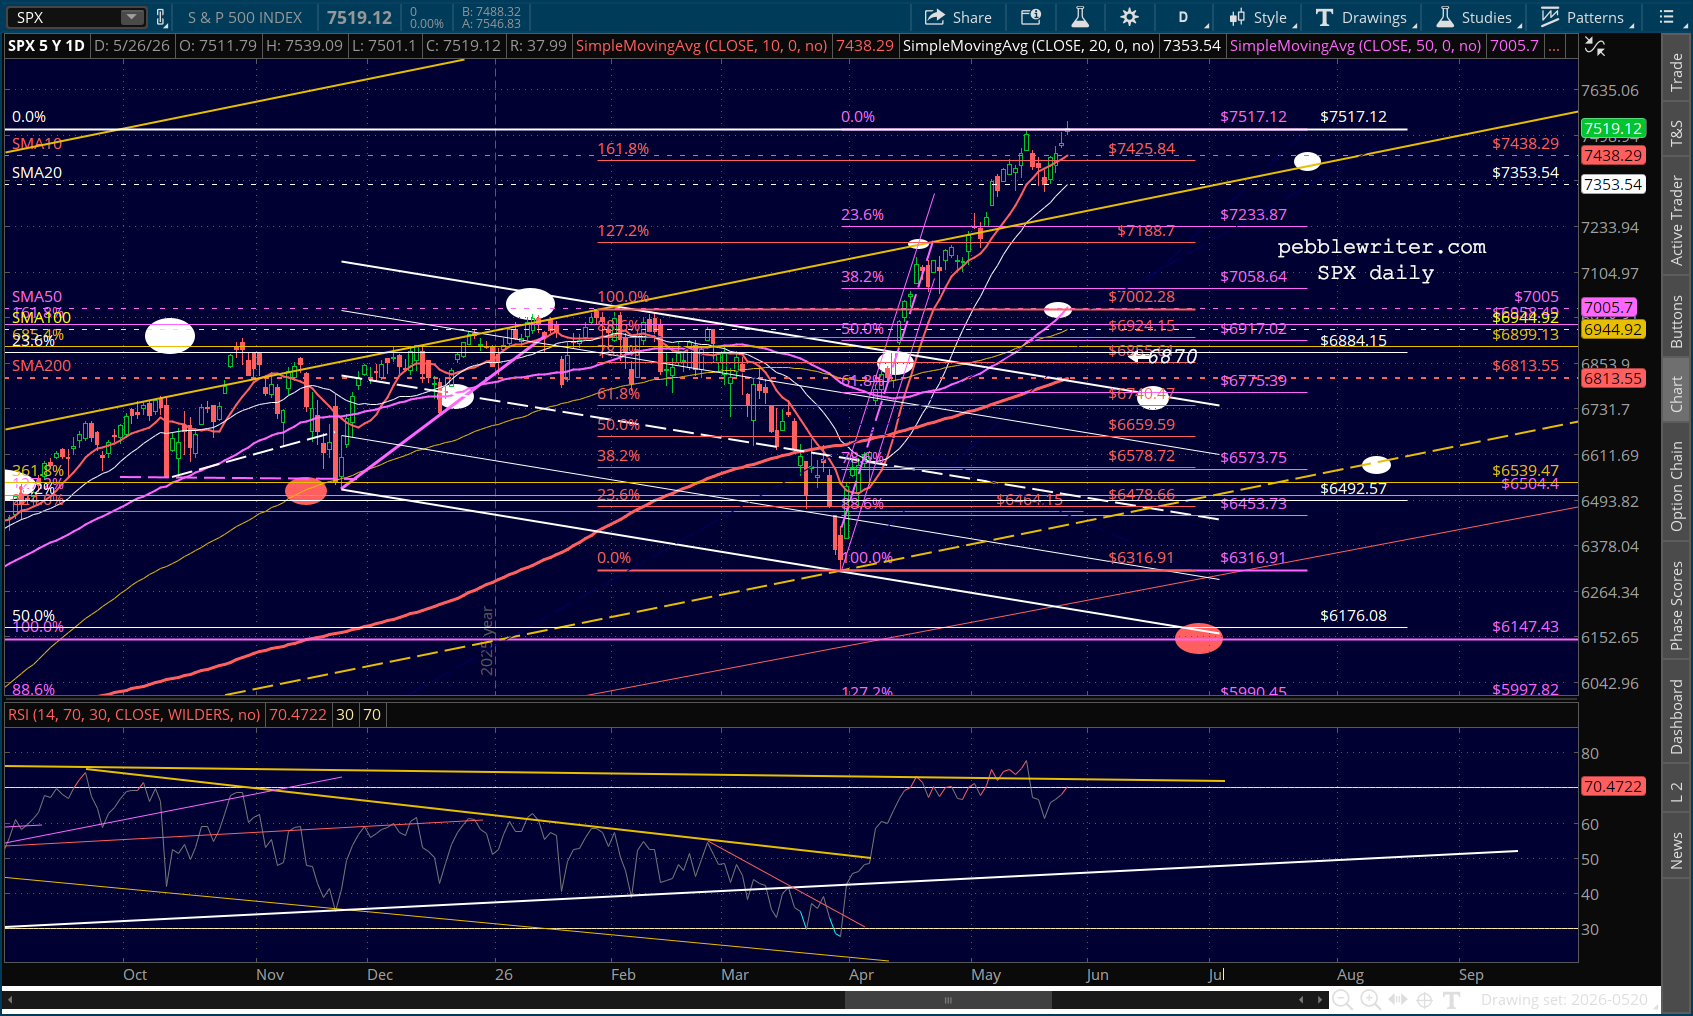
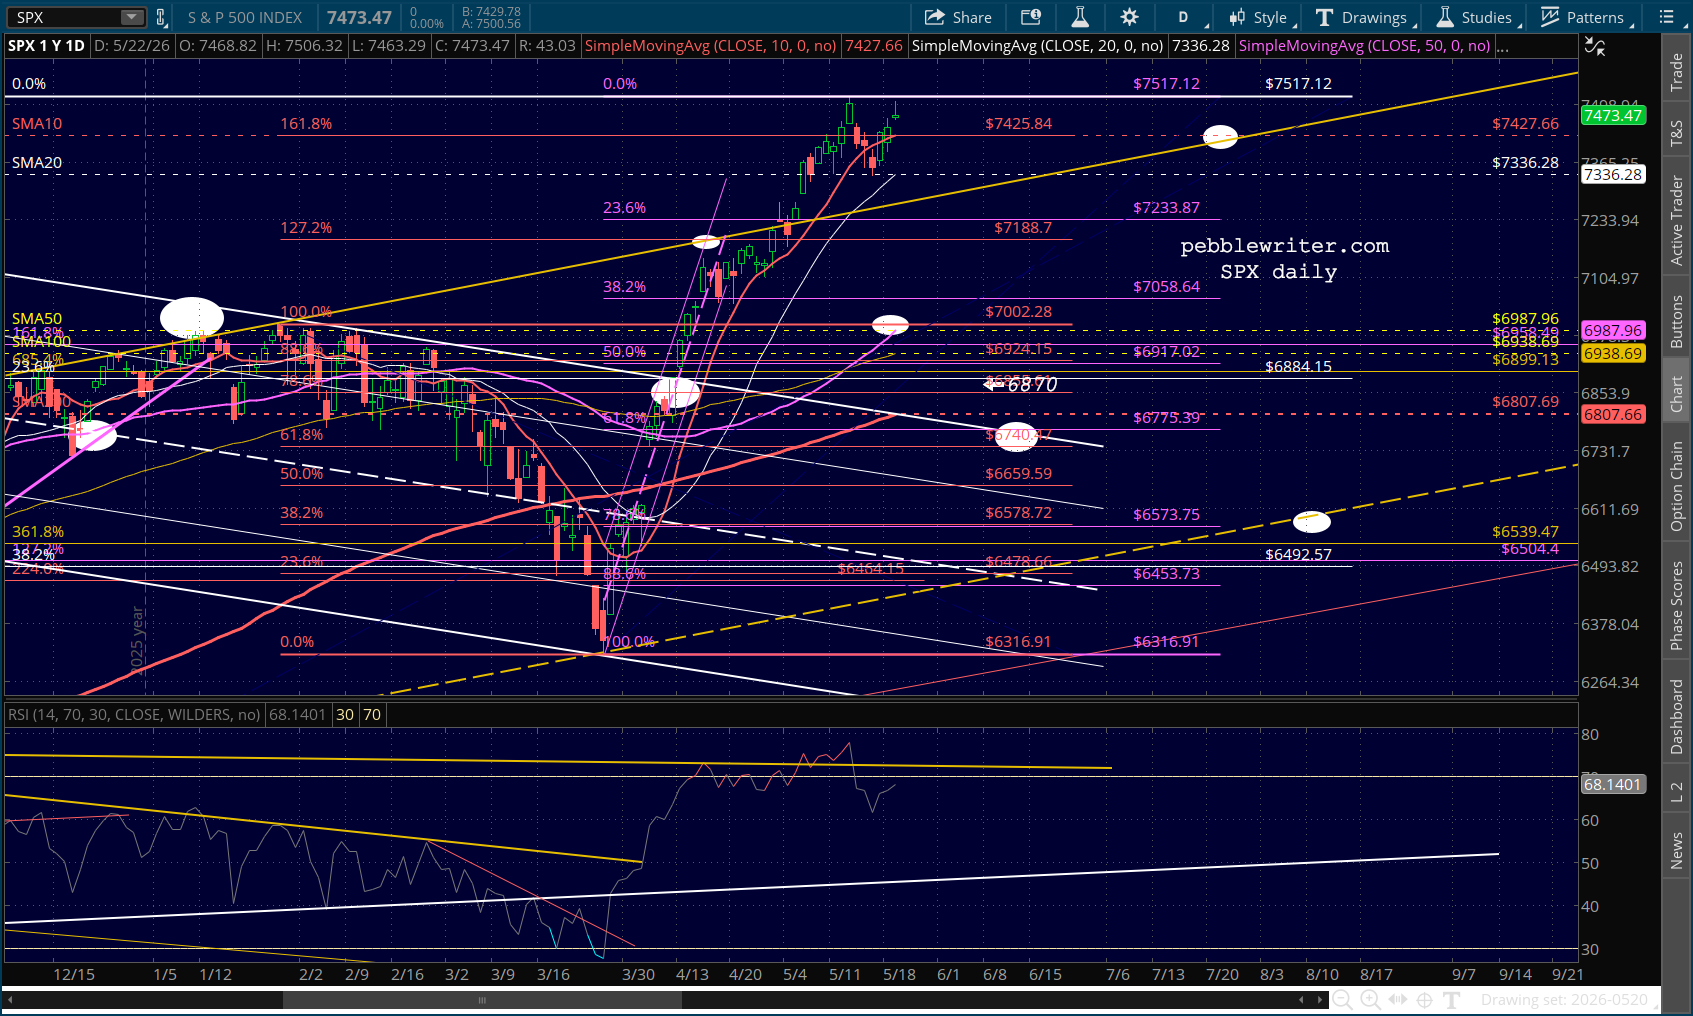
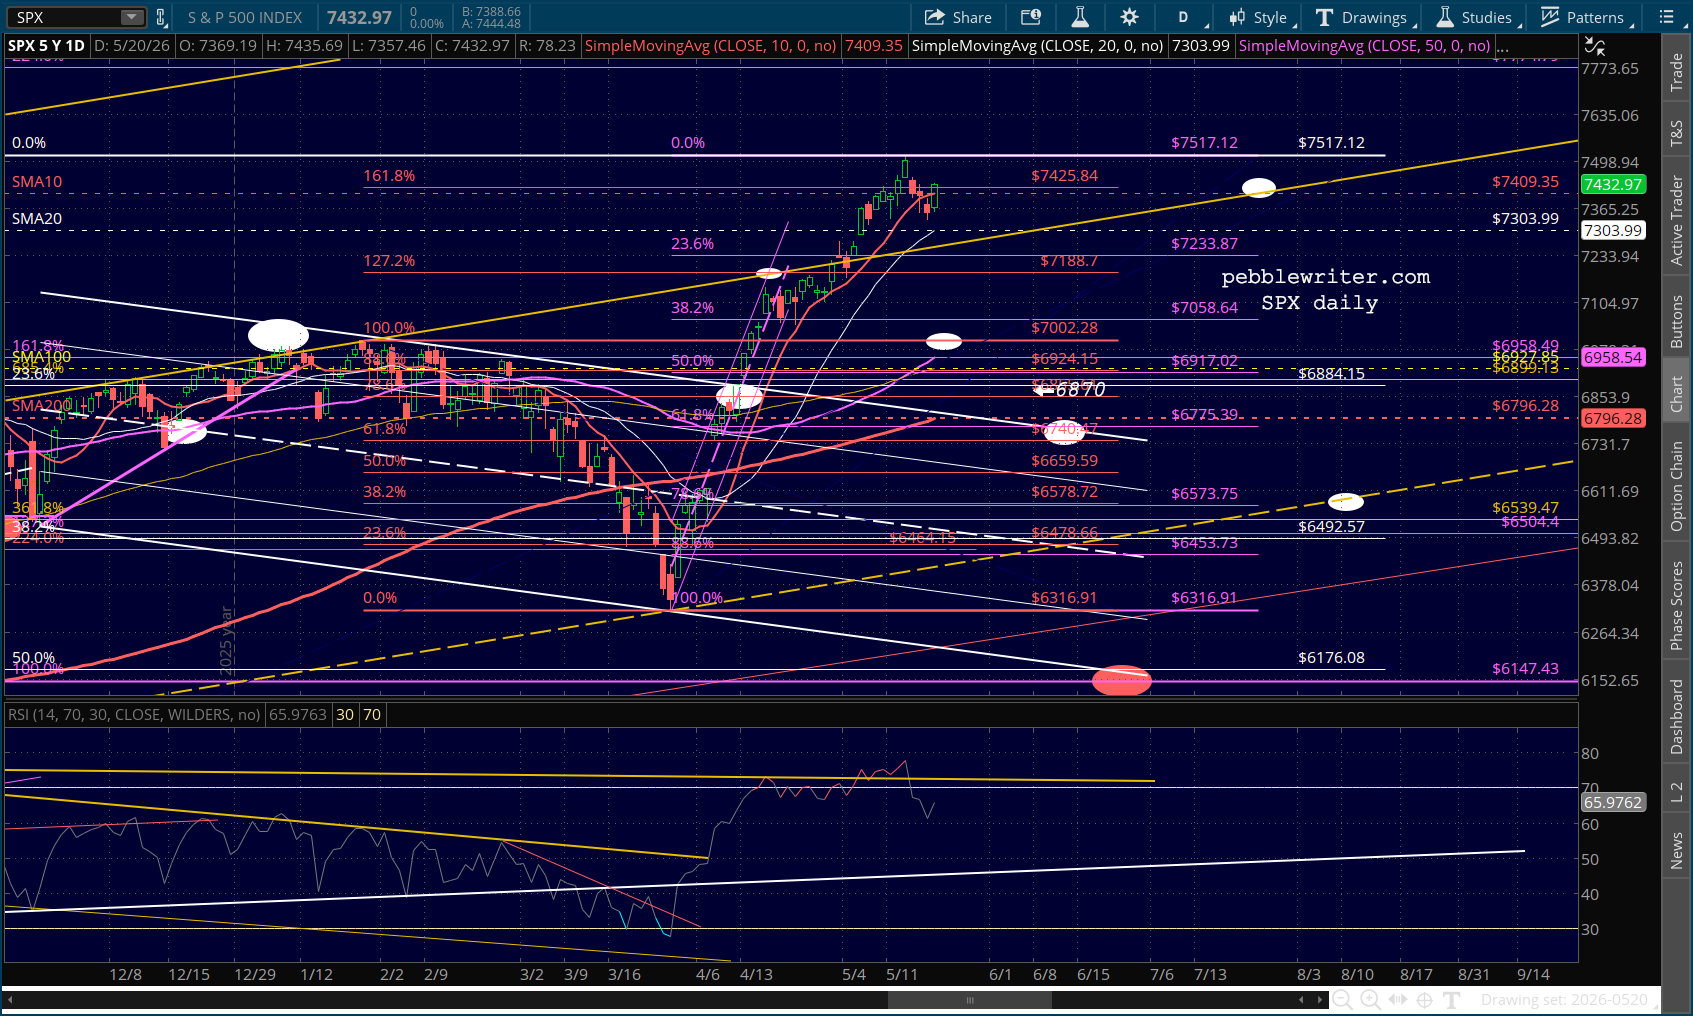
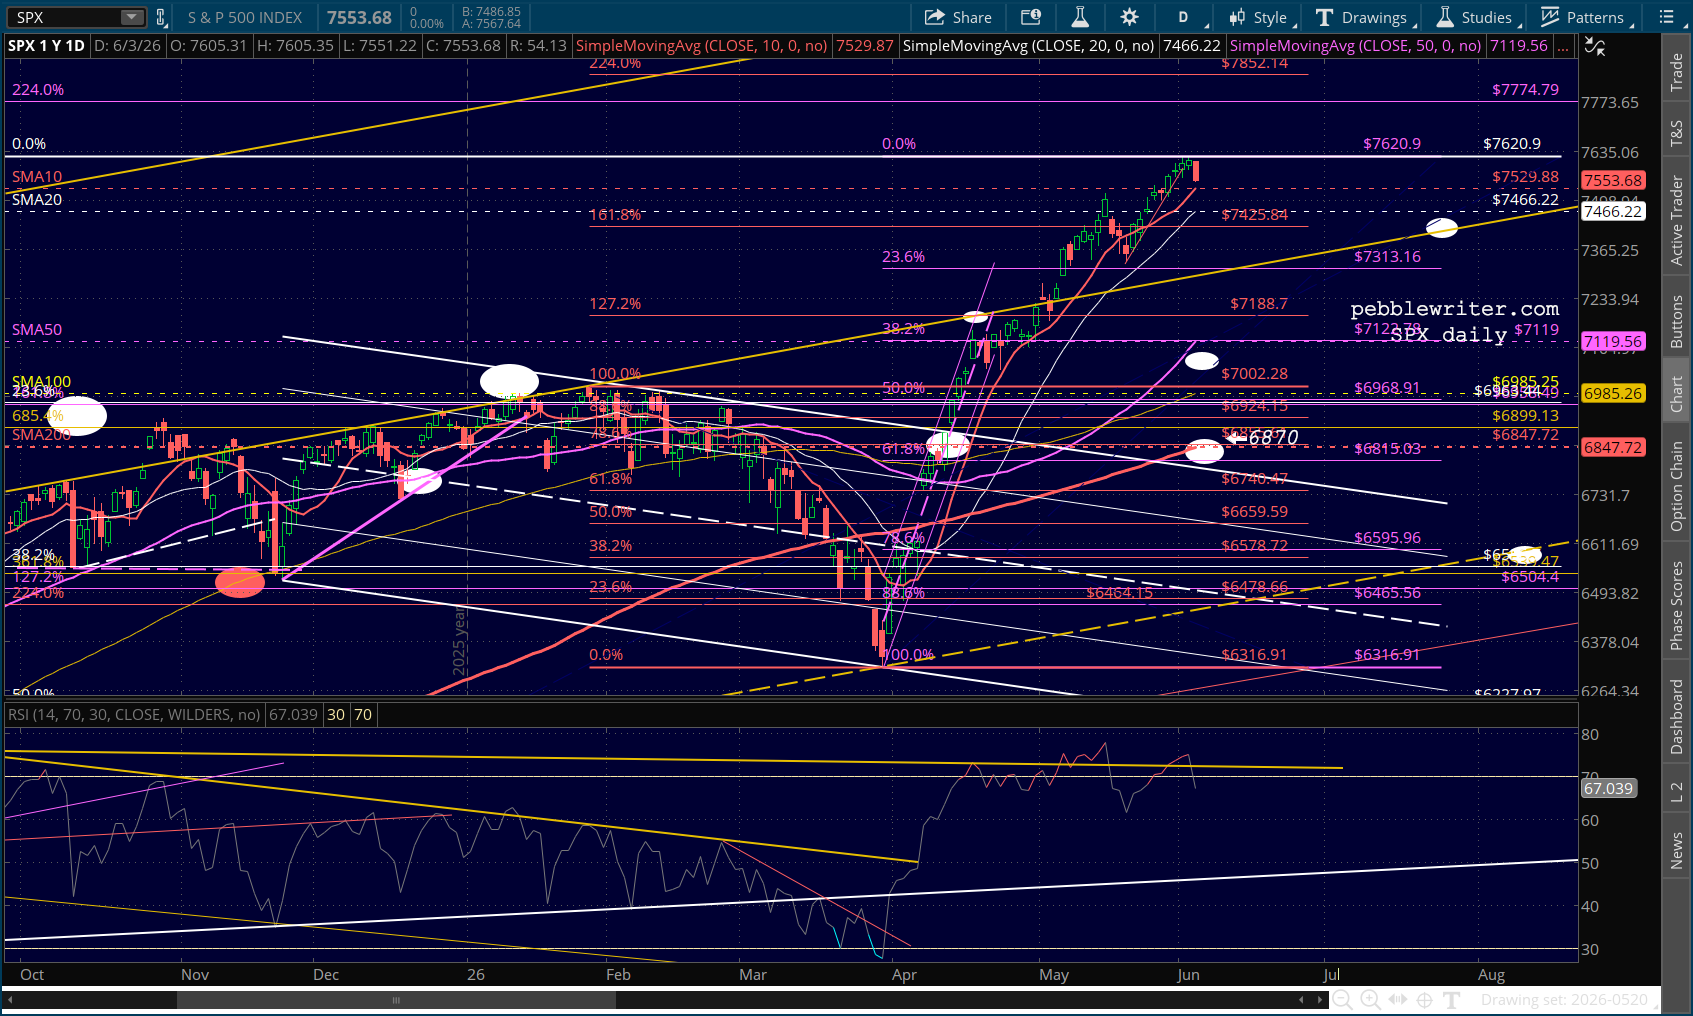
Meanwhile, SPX is well above its 1.618, meaning it would take a 100+ point drop to backtest the former resistance.
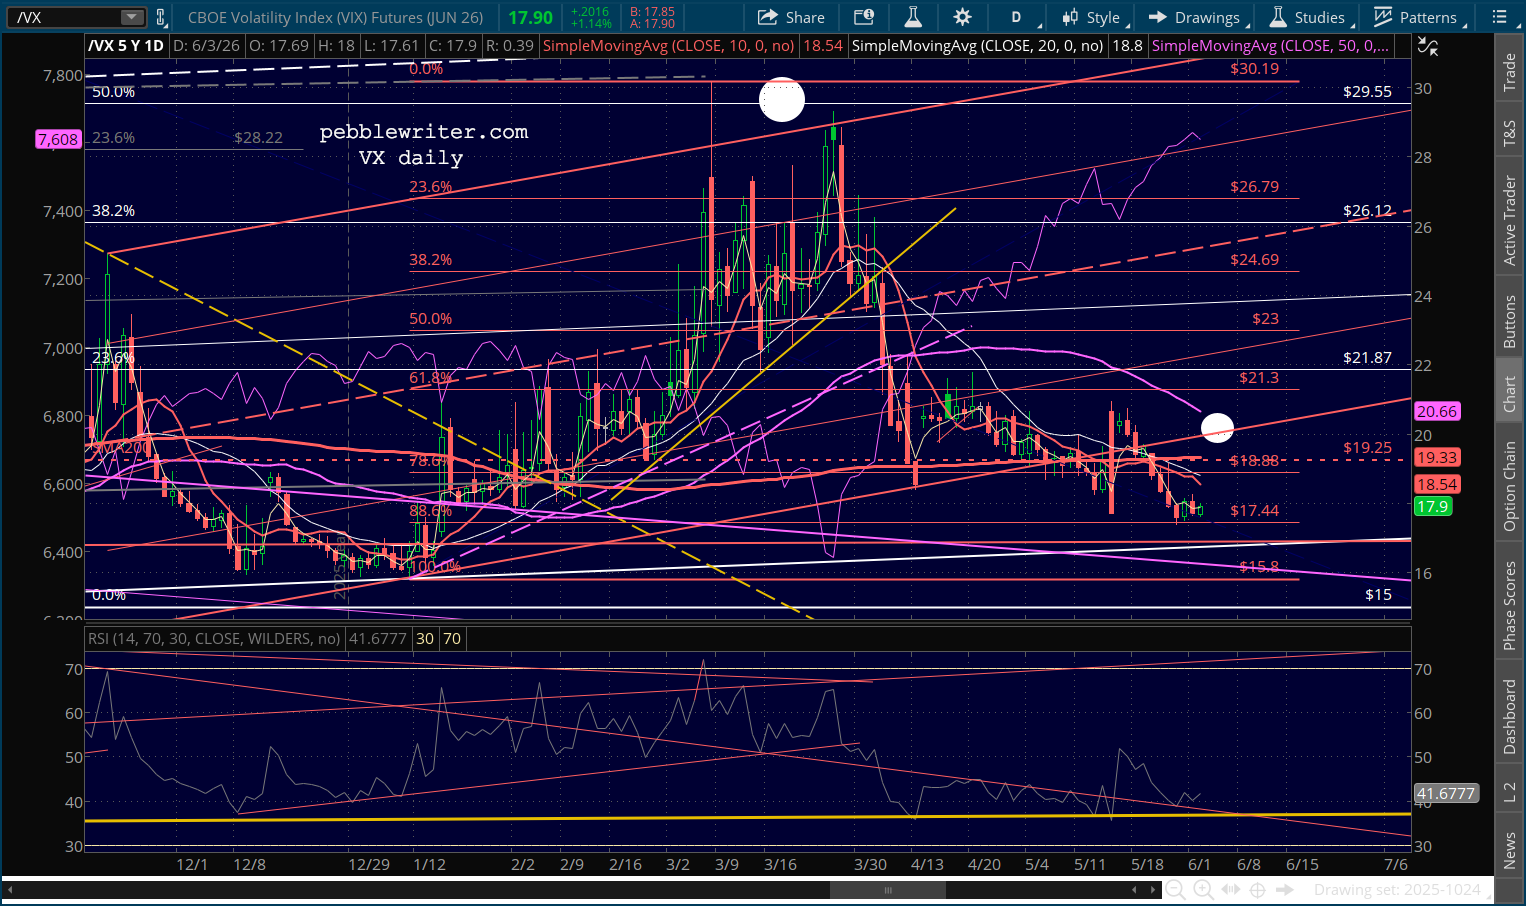
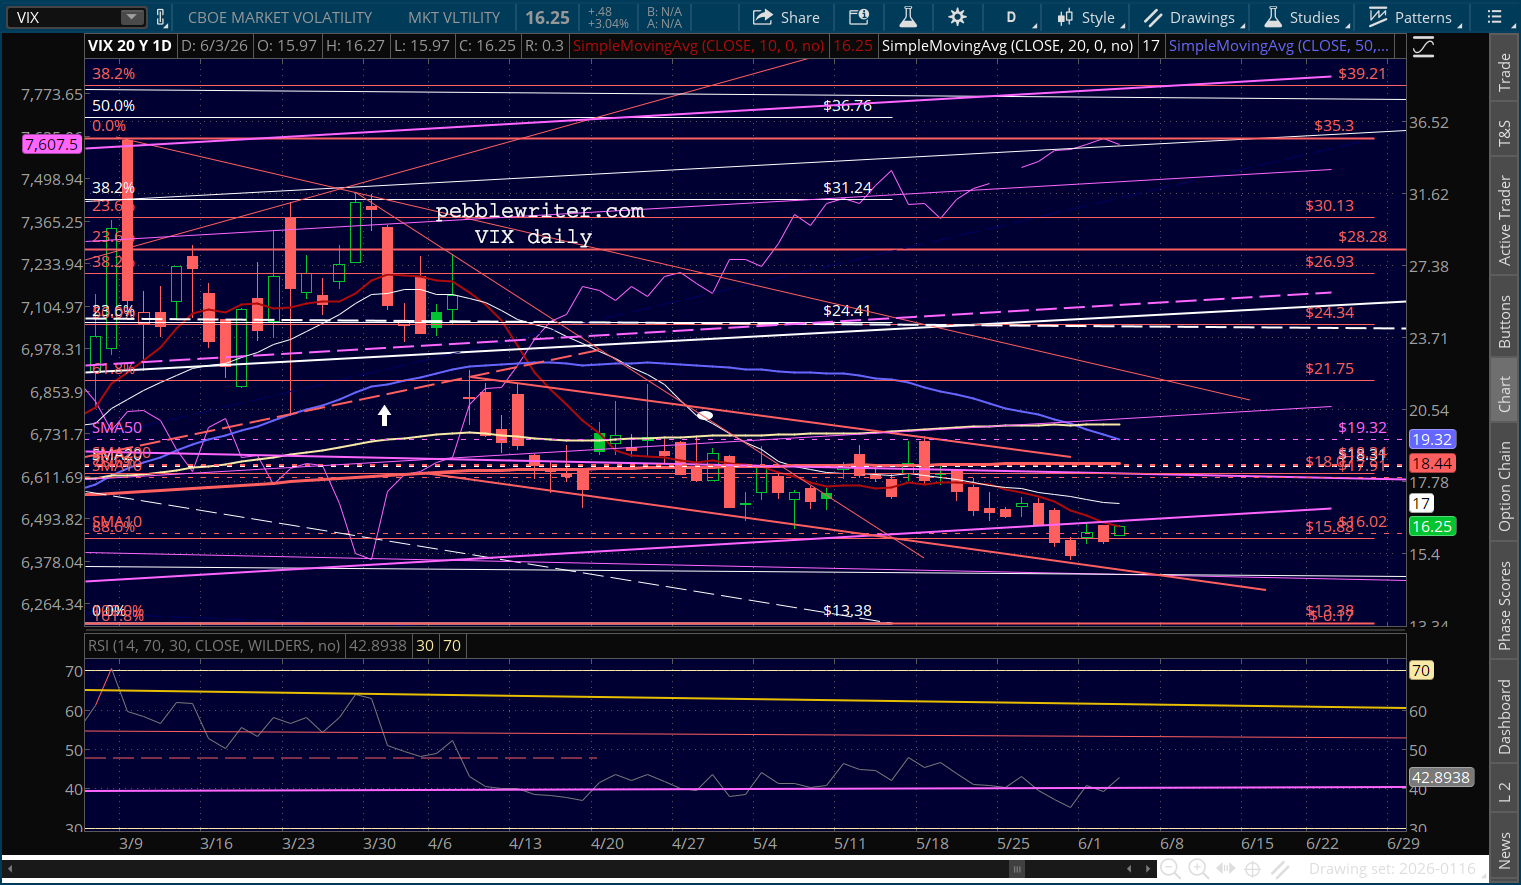
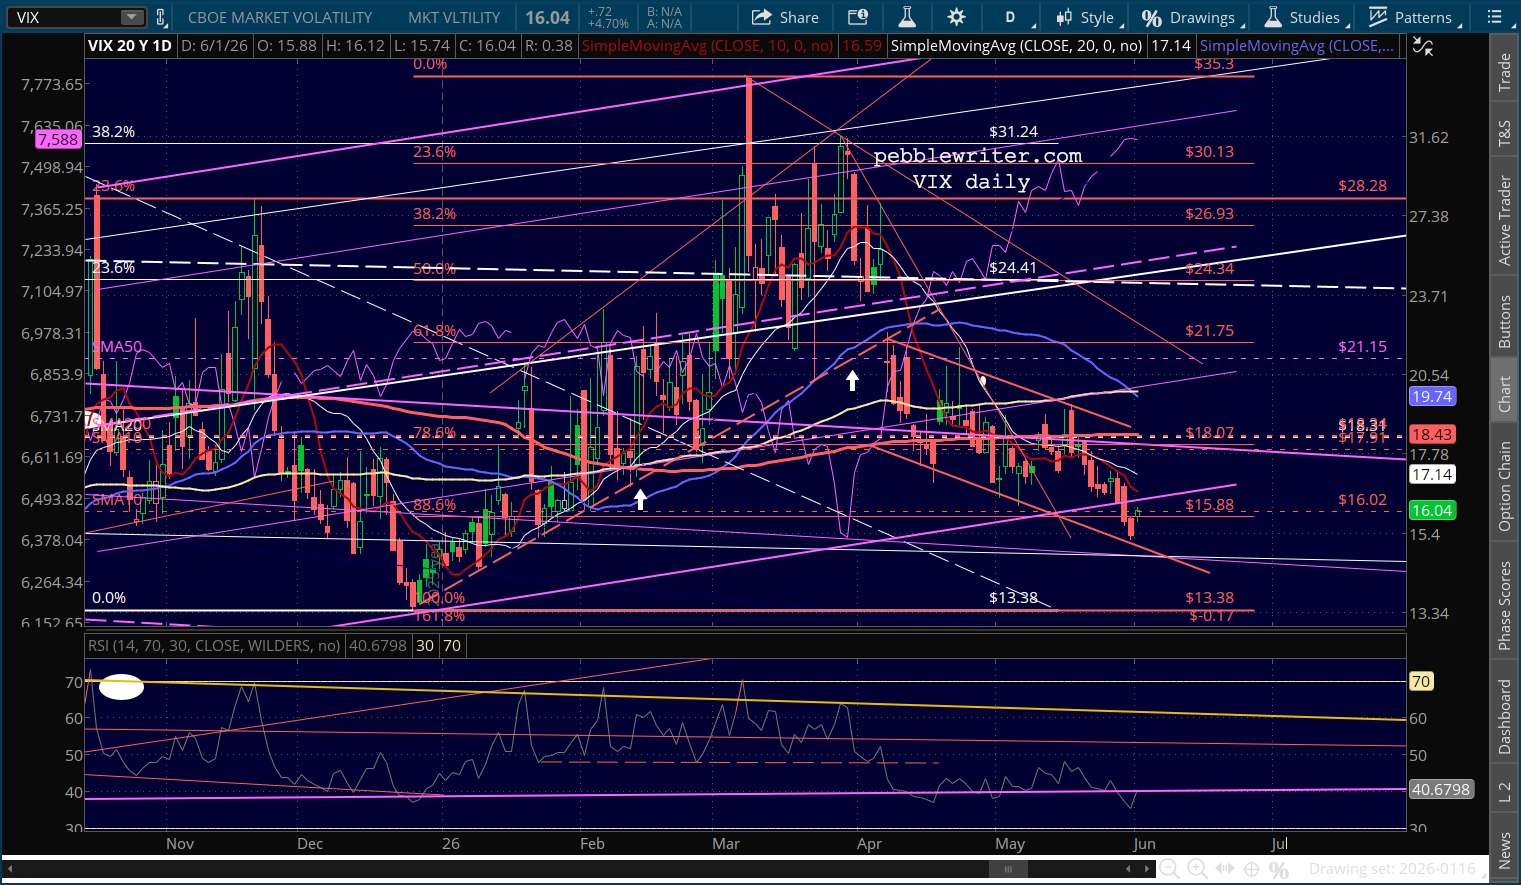
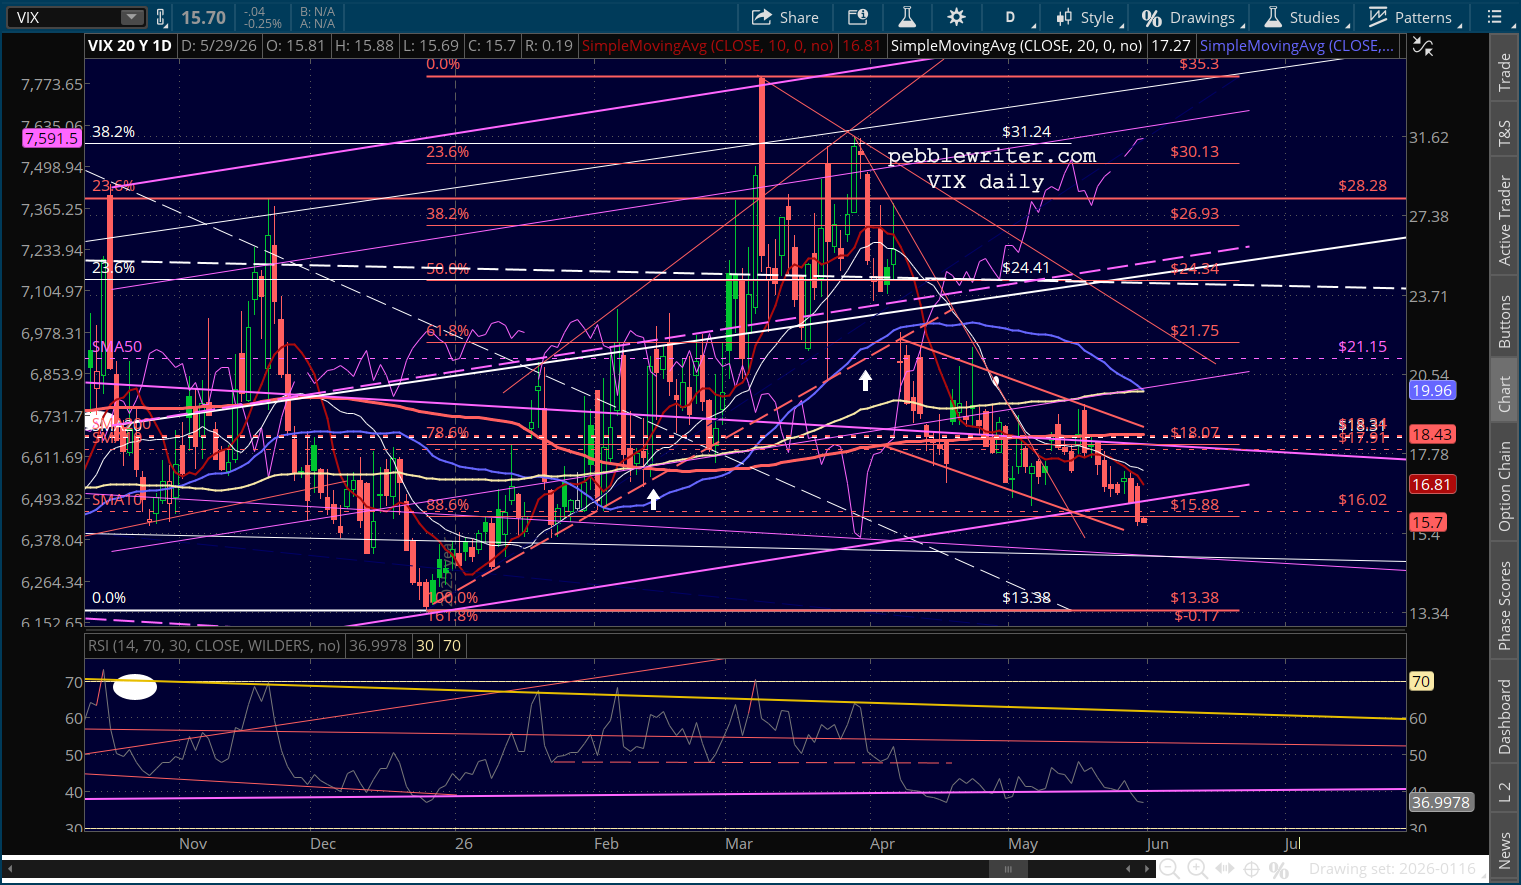
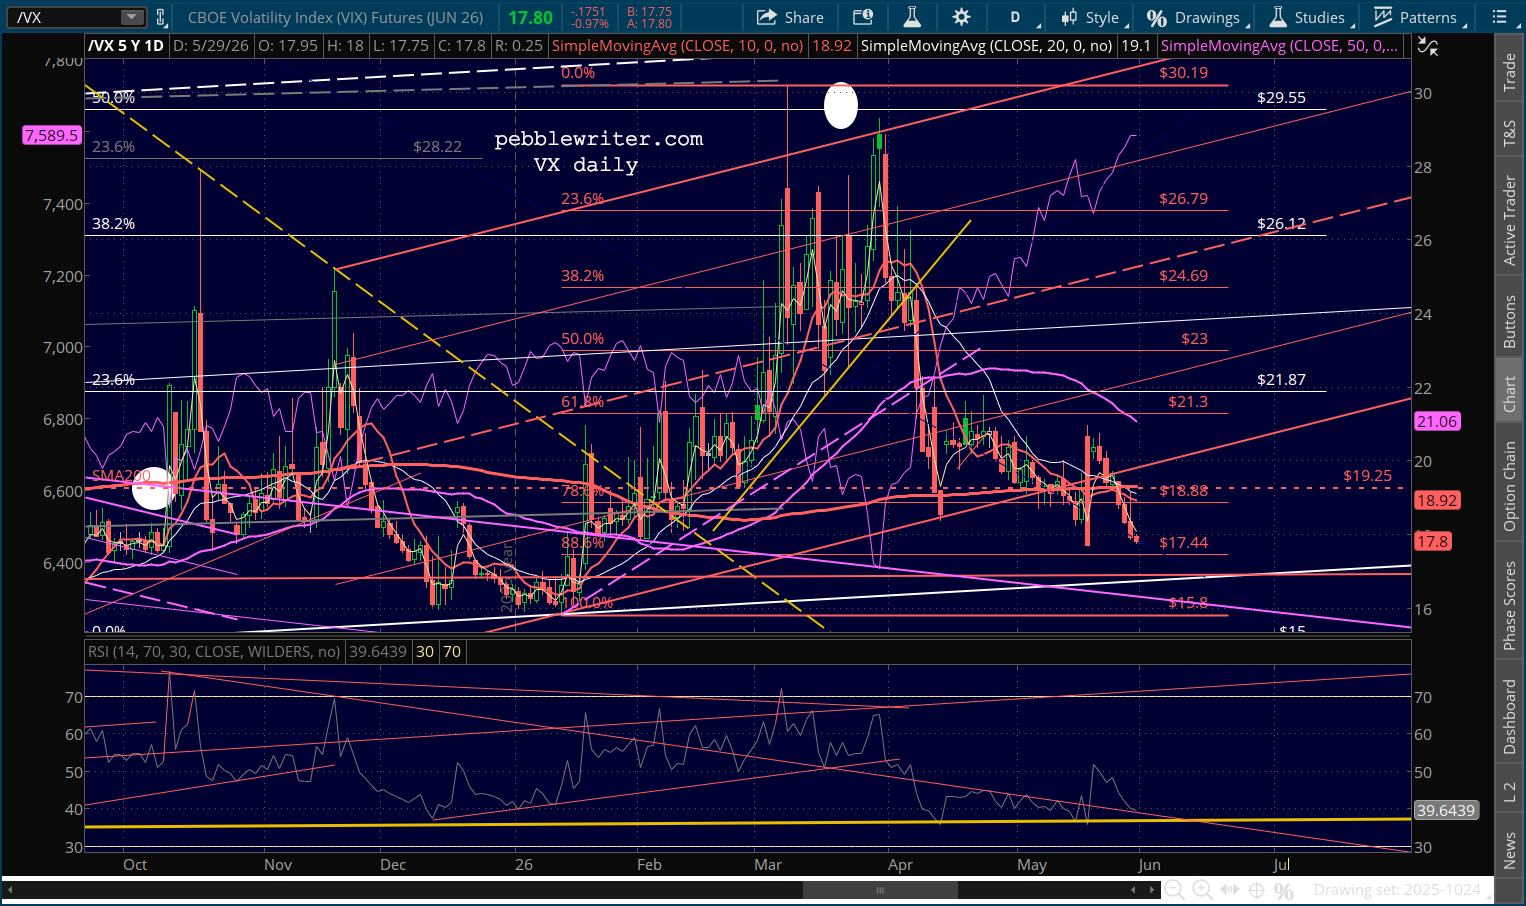
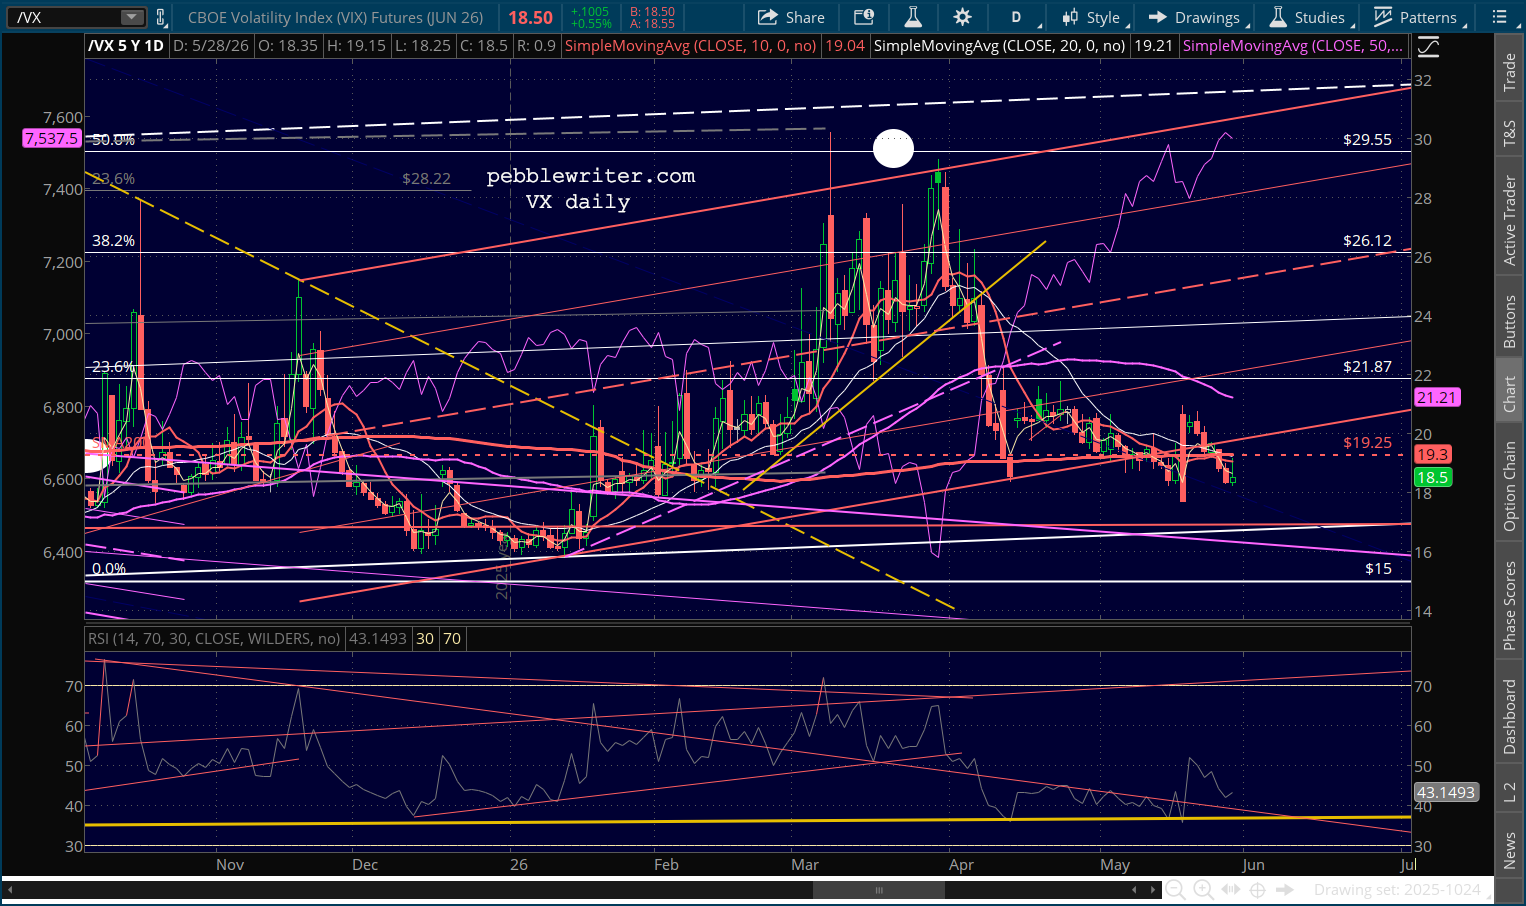
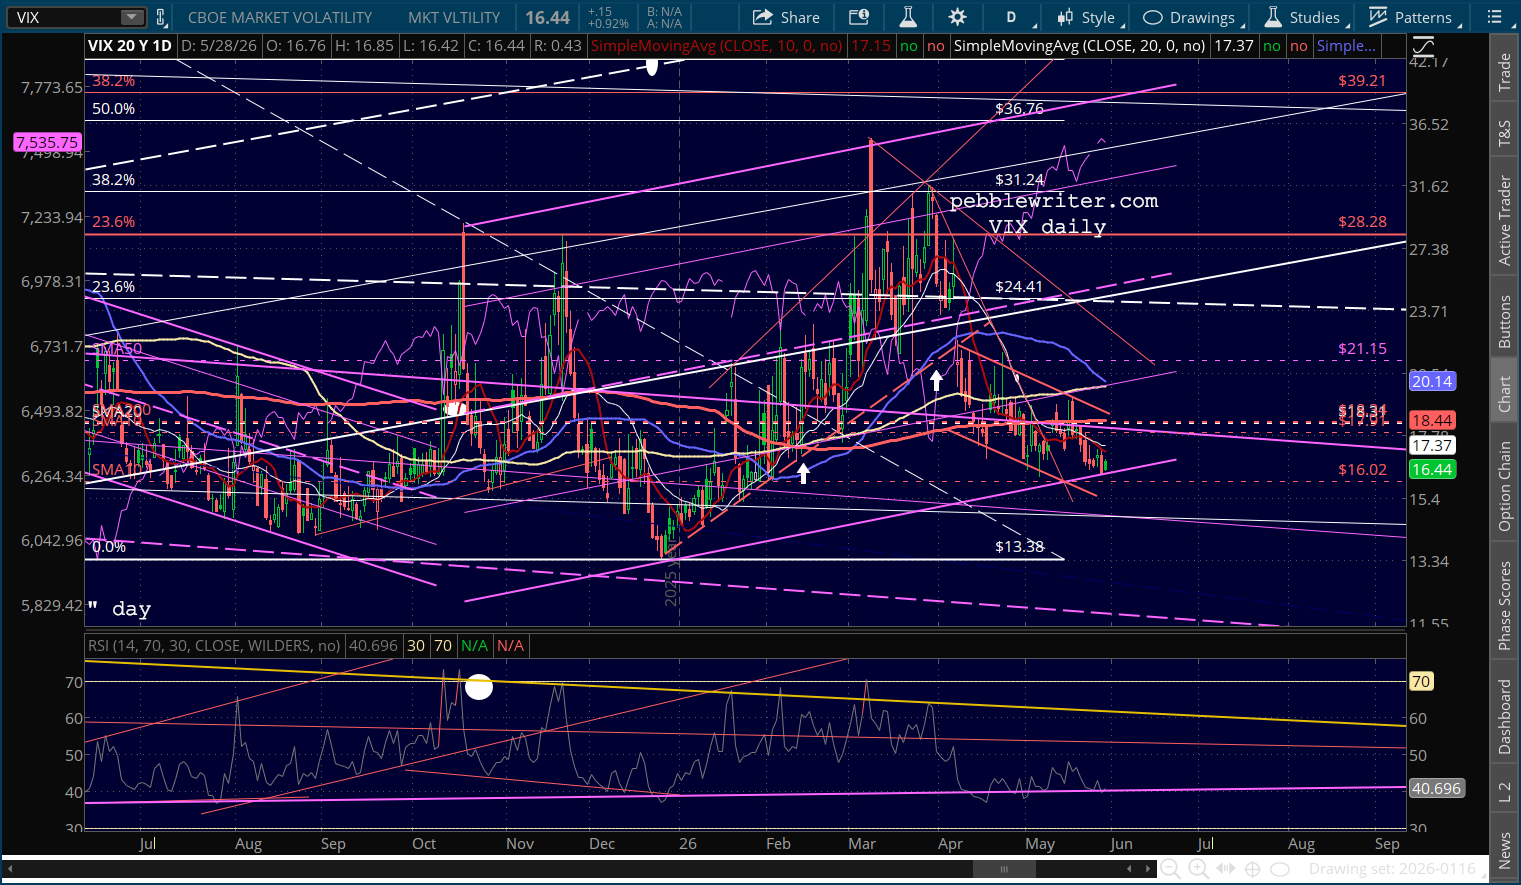
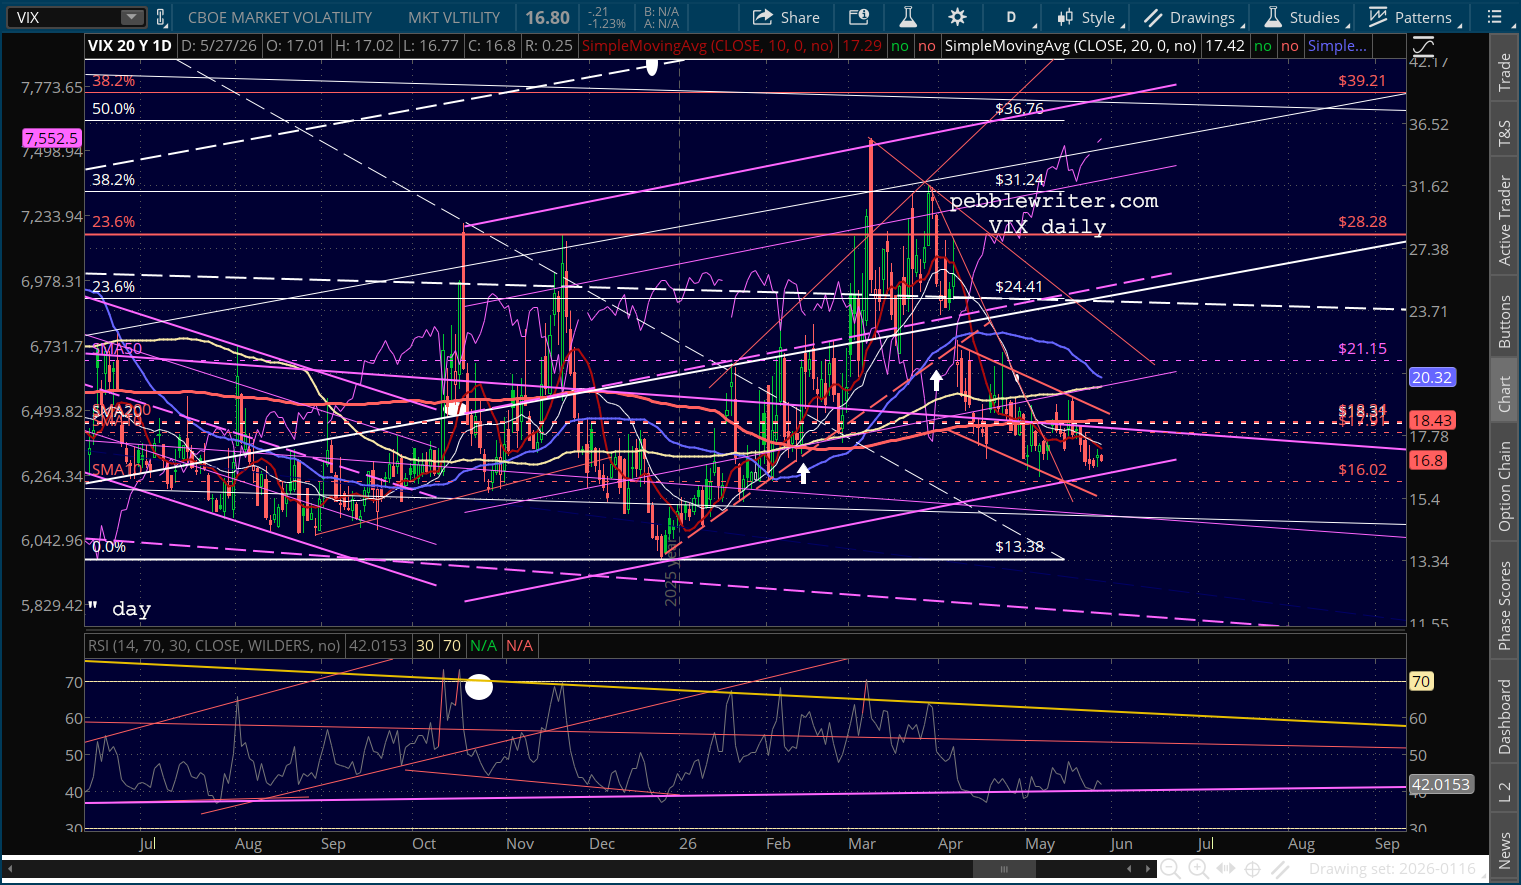
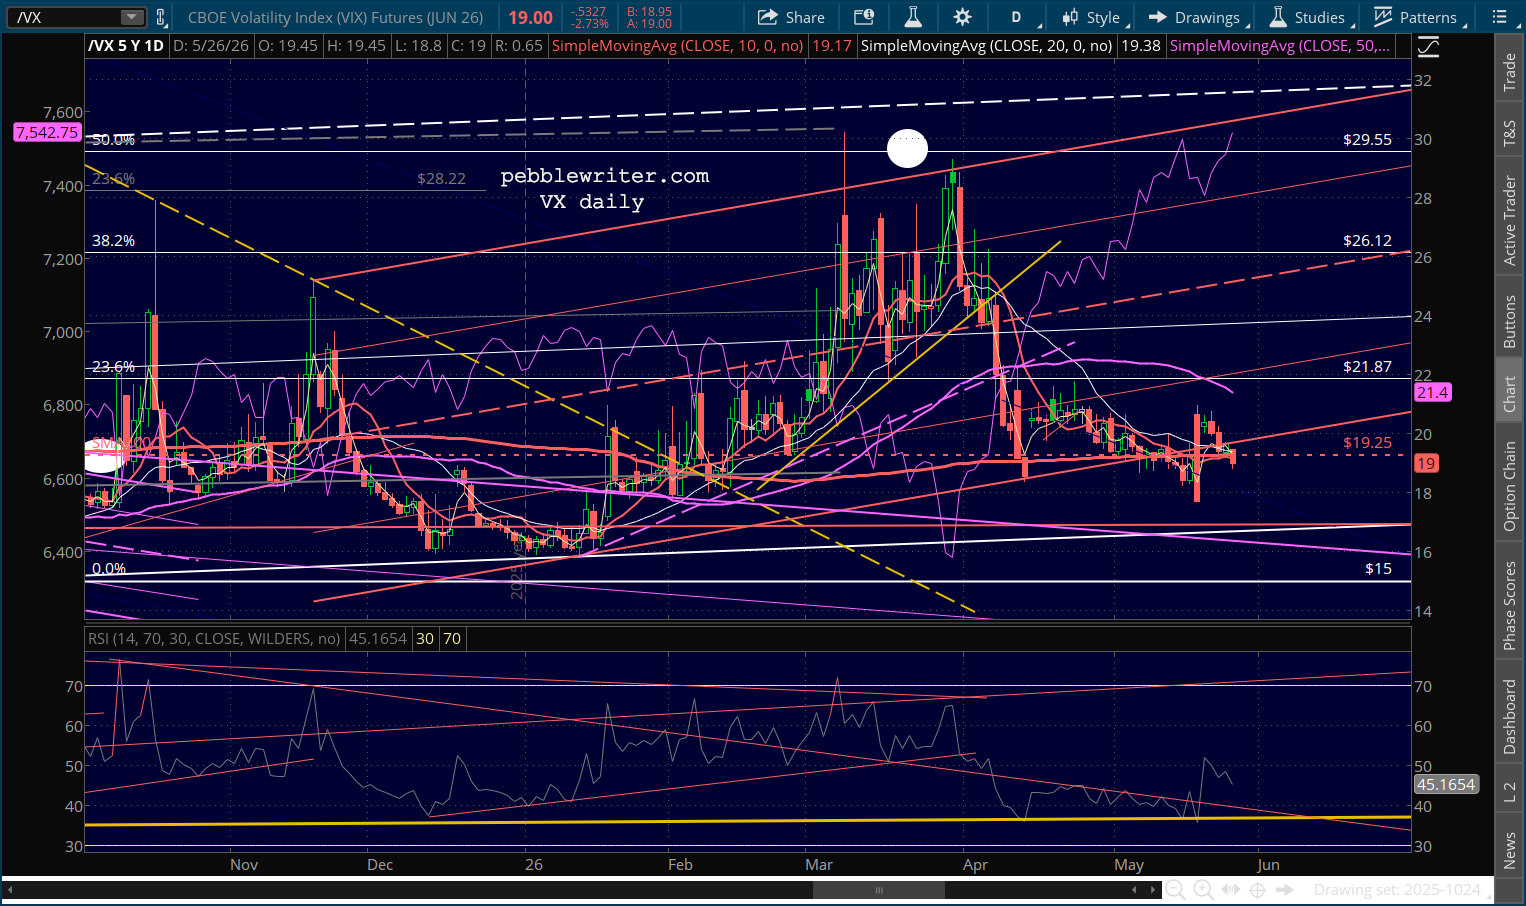
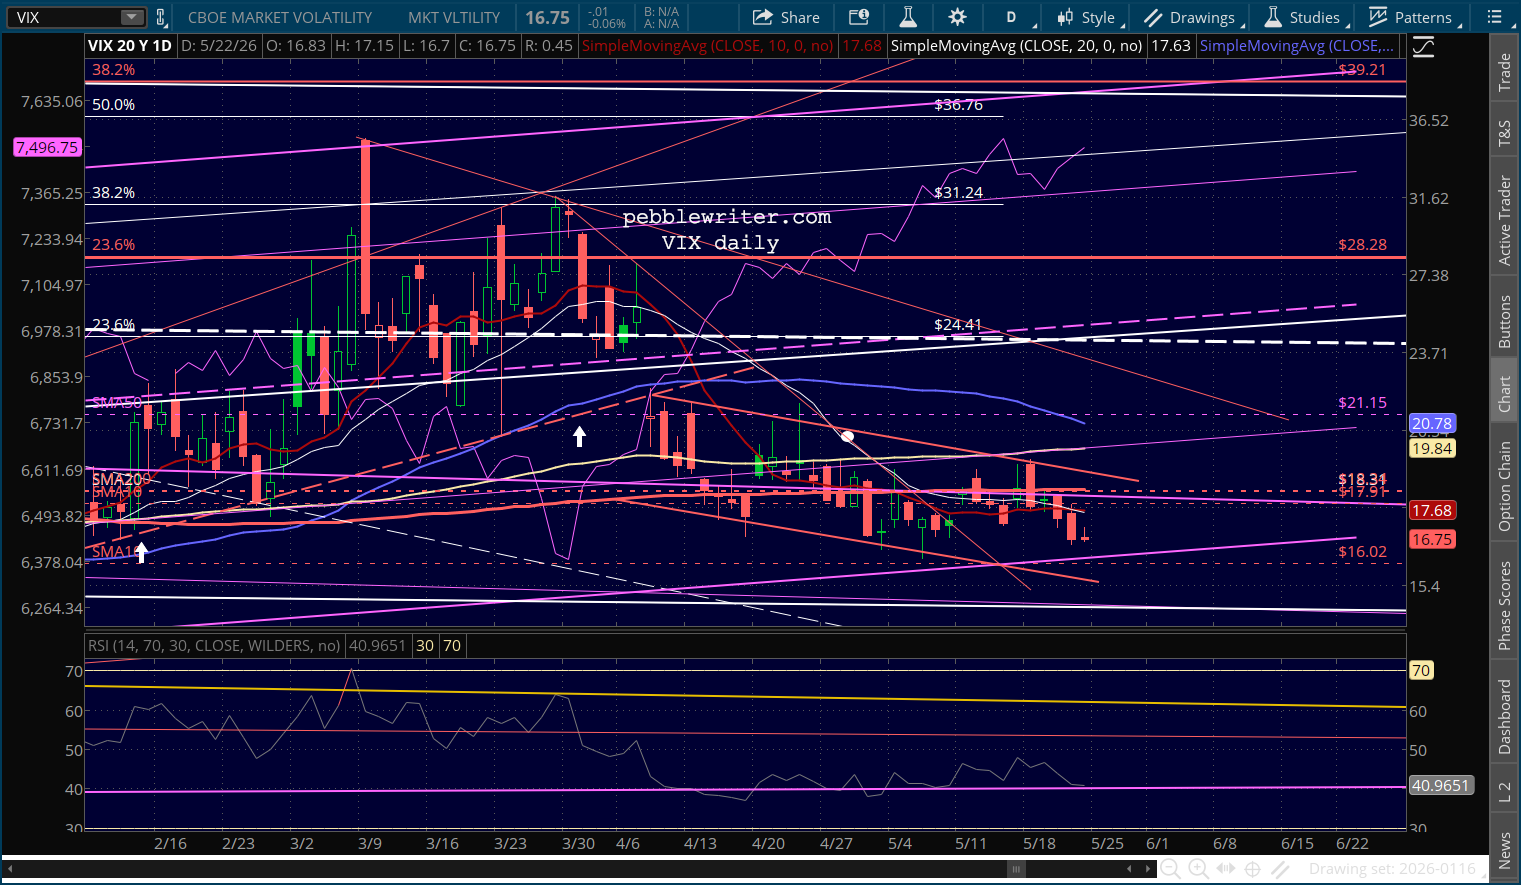
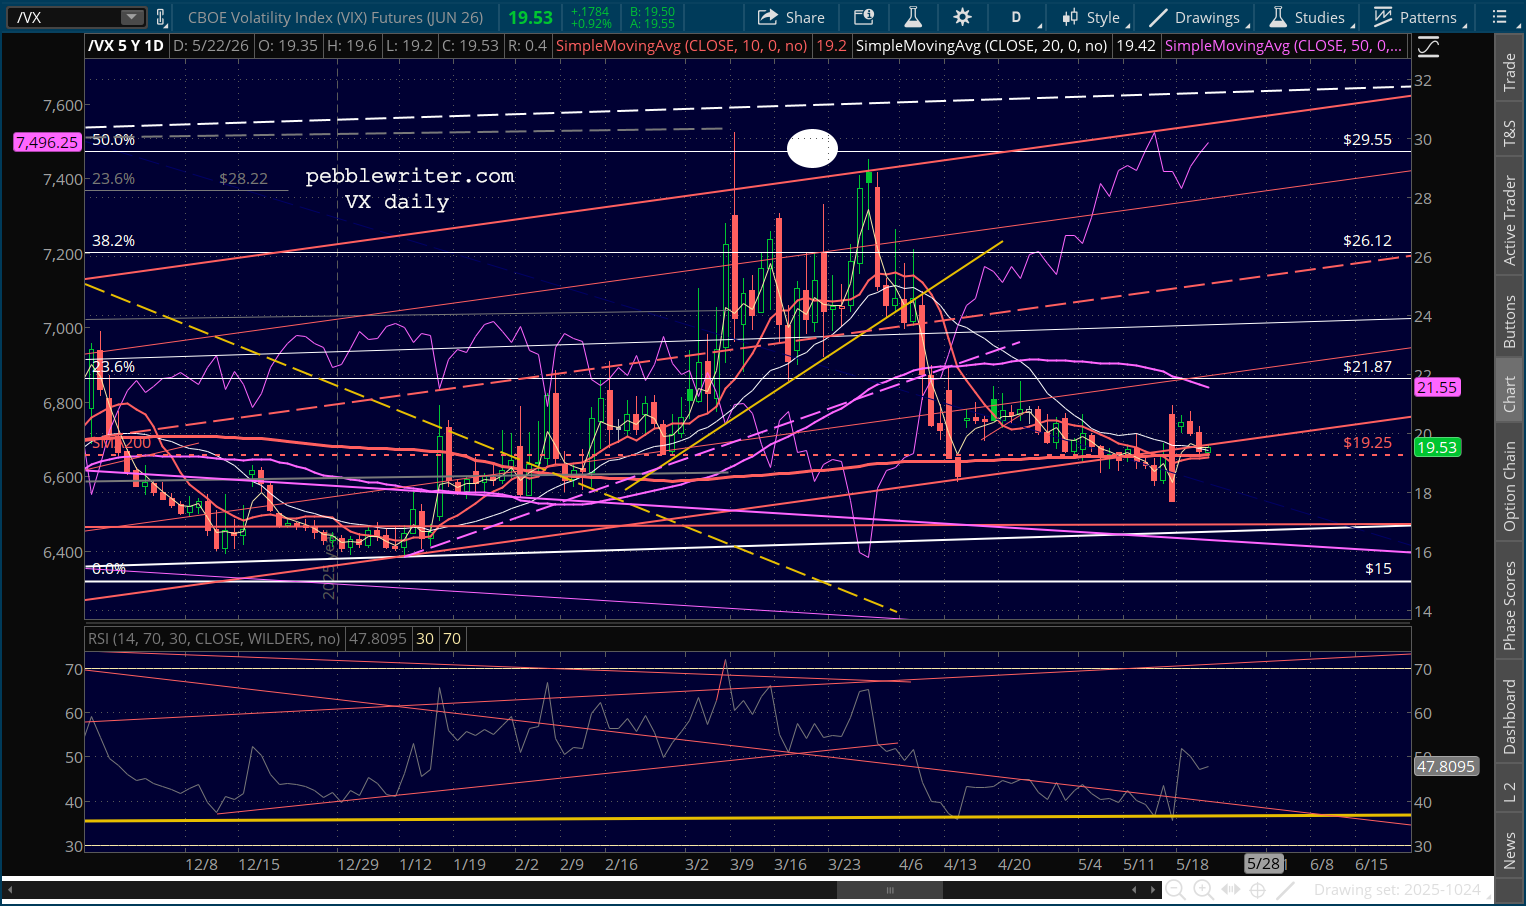
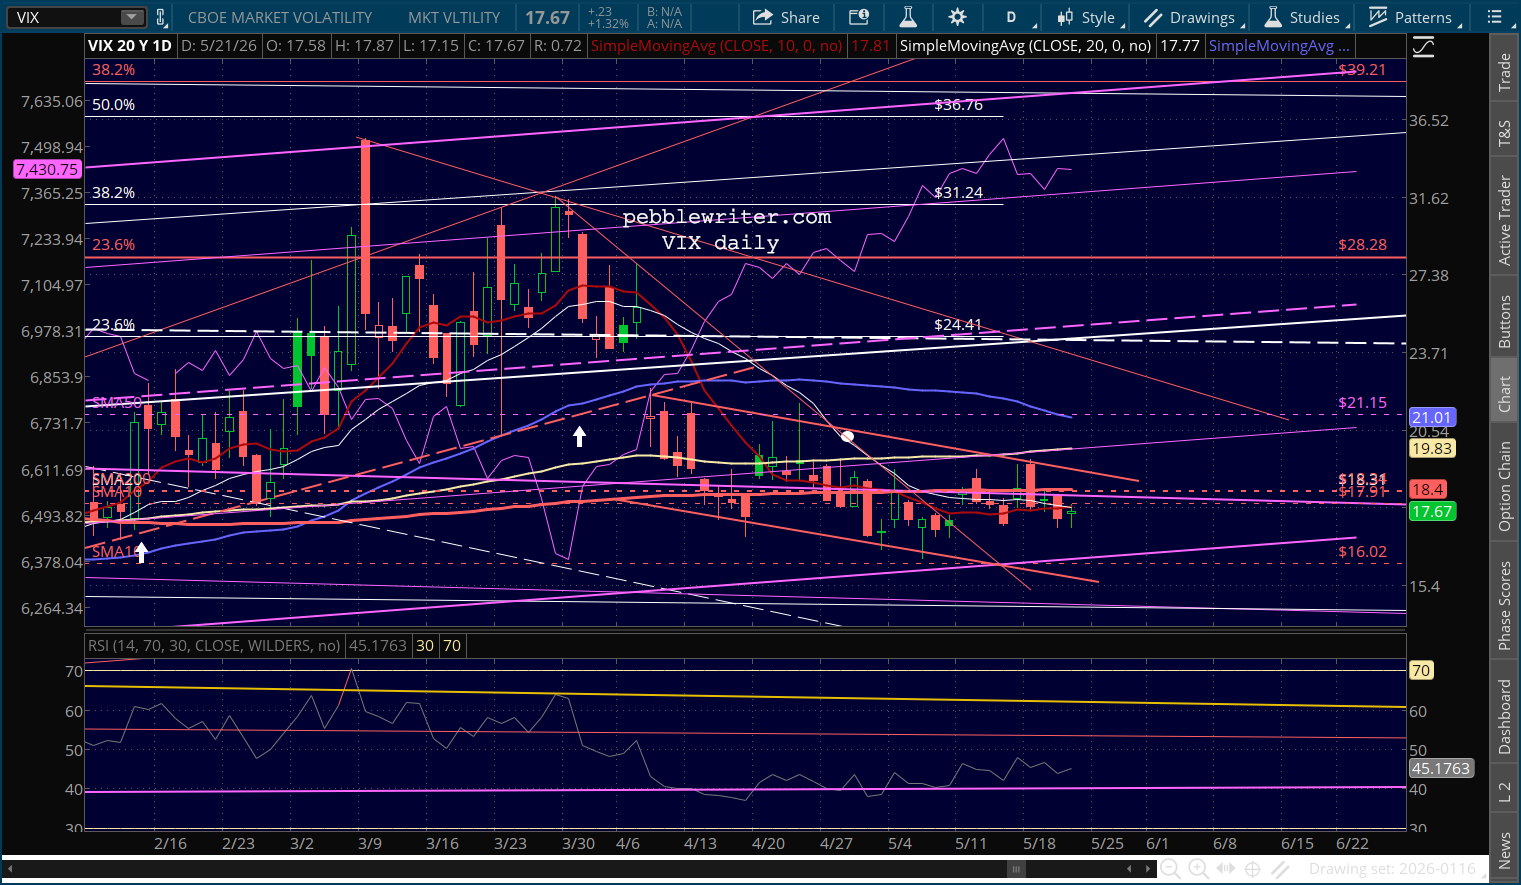
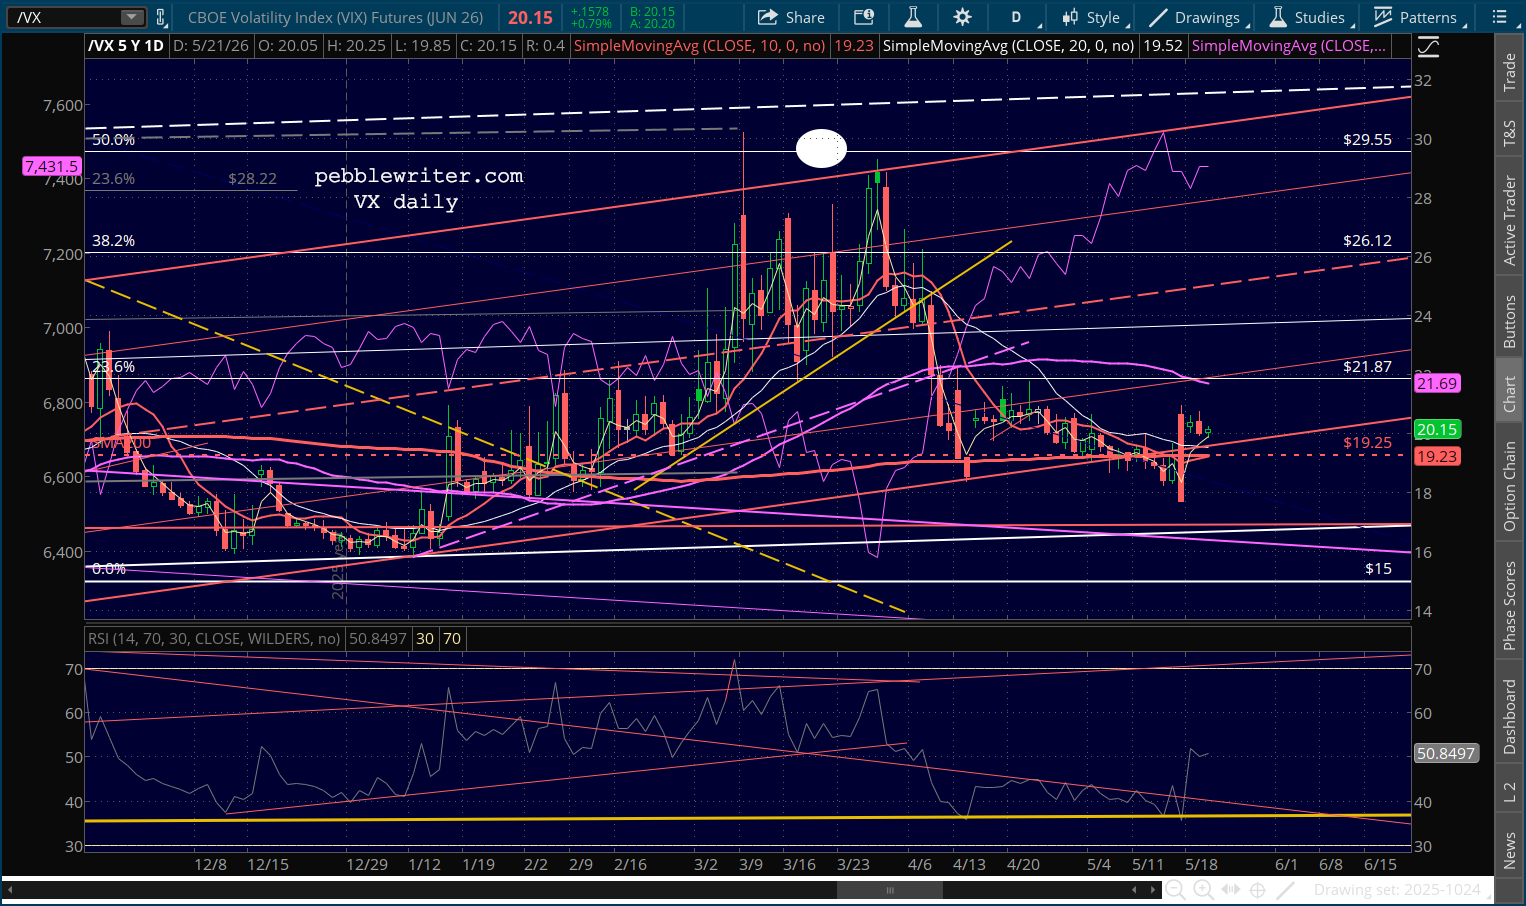
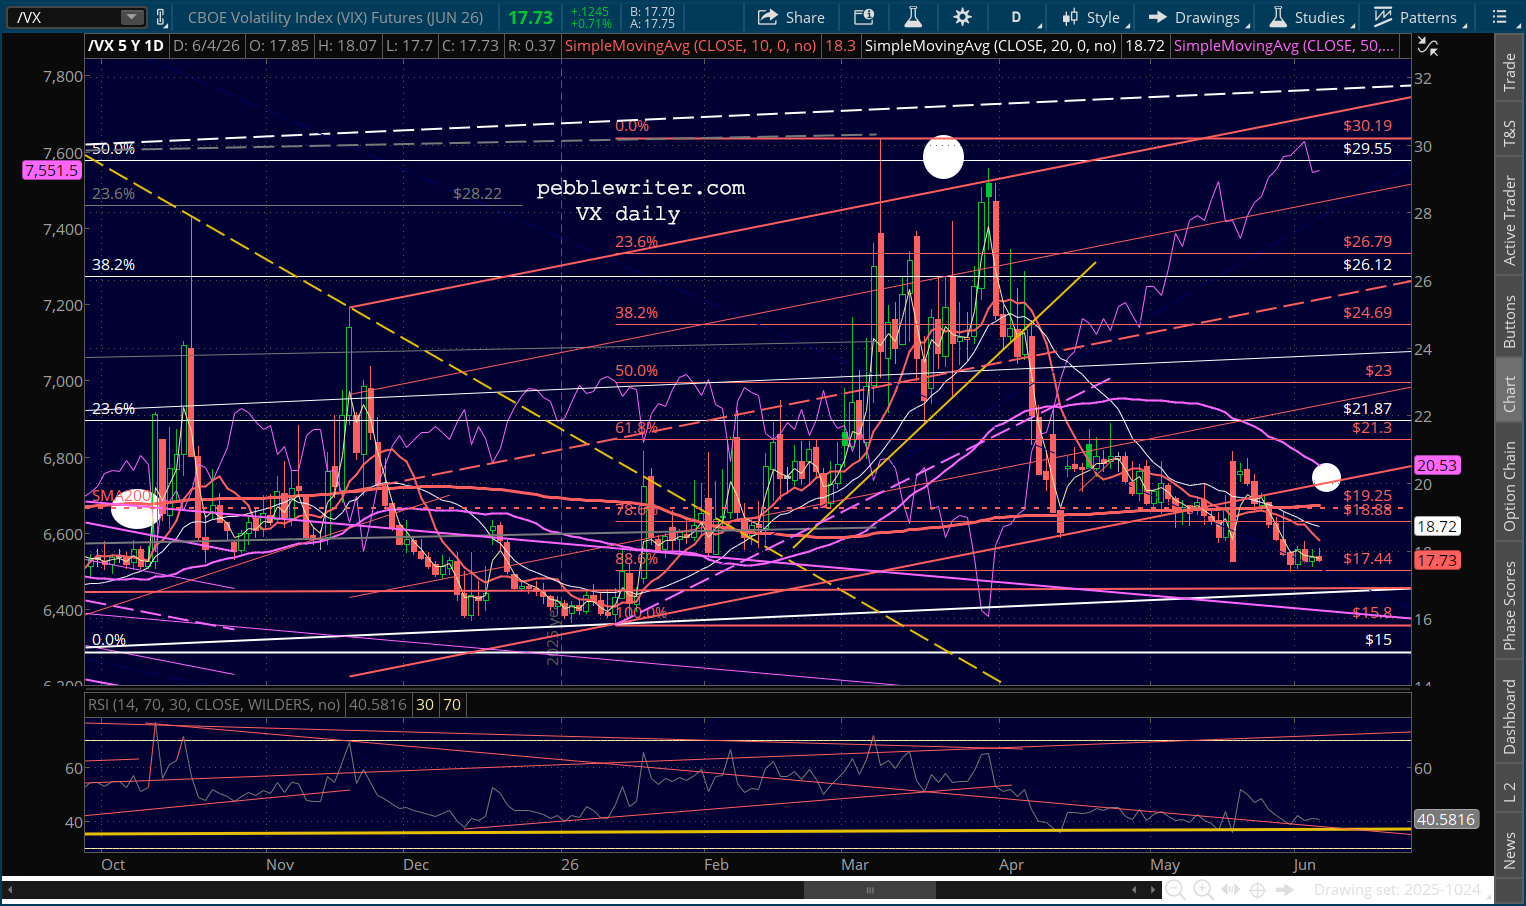
But, VX has spent the past 5 sessions only a whisper from breaking below its .886 retracement. So, the lever is there, ready to be used if things get ugly.
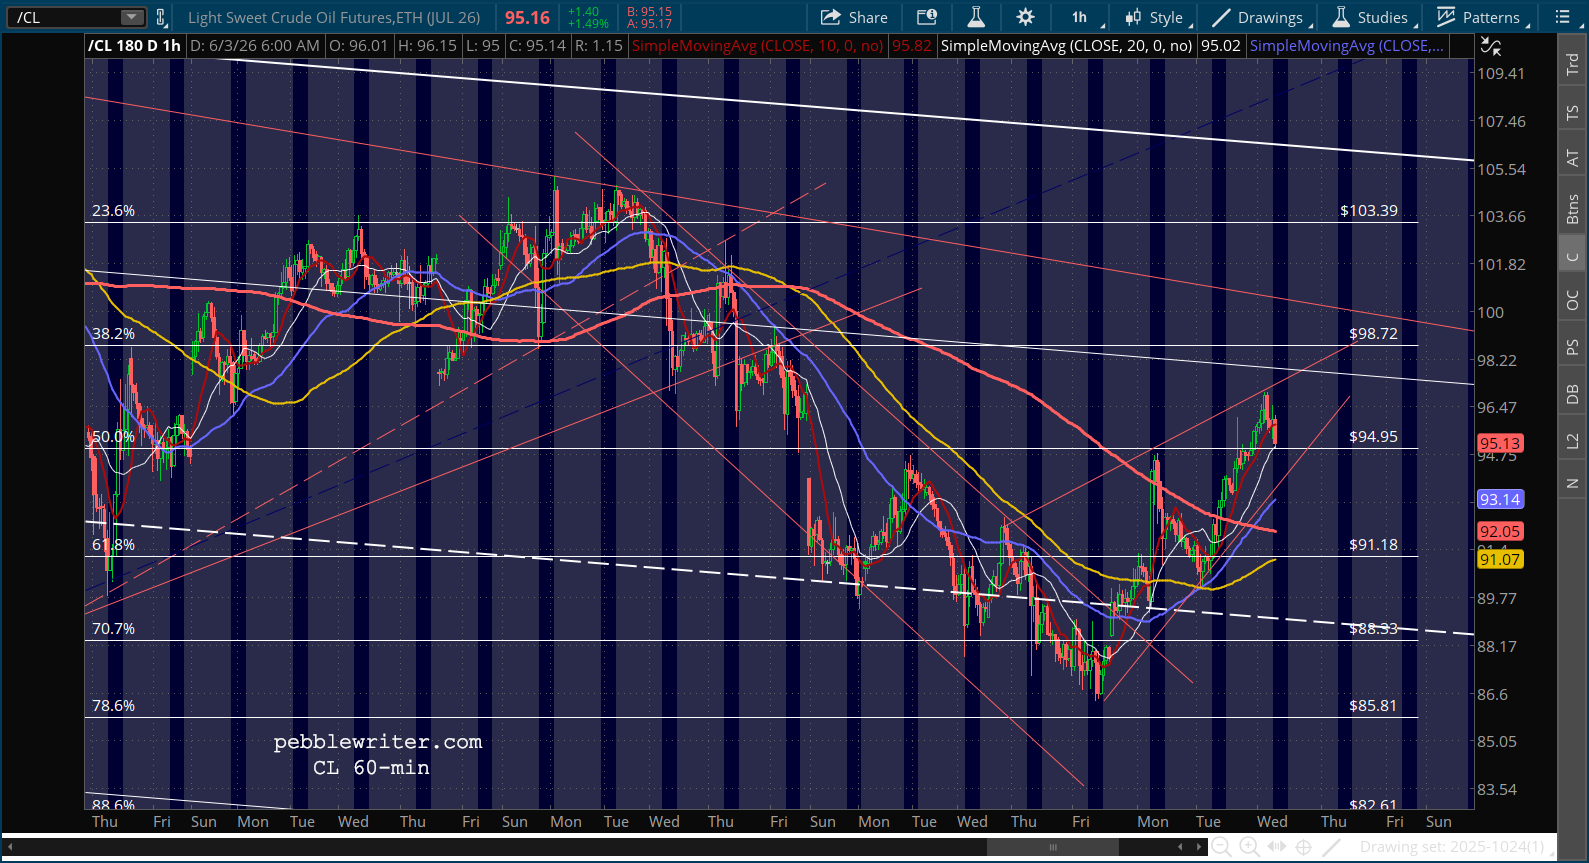
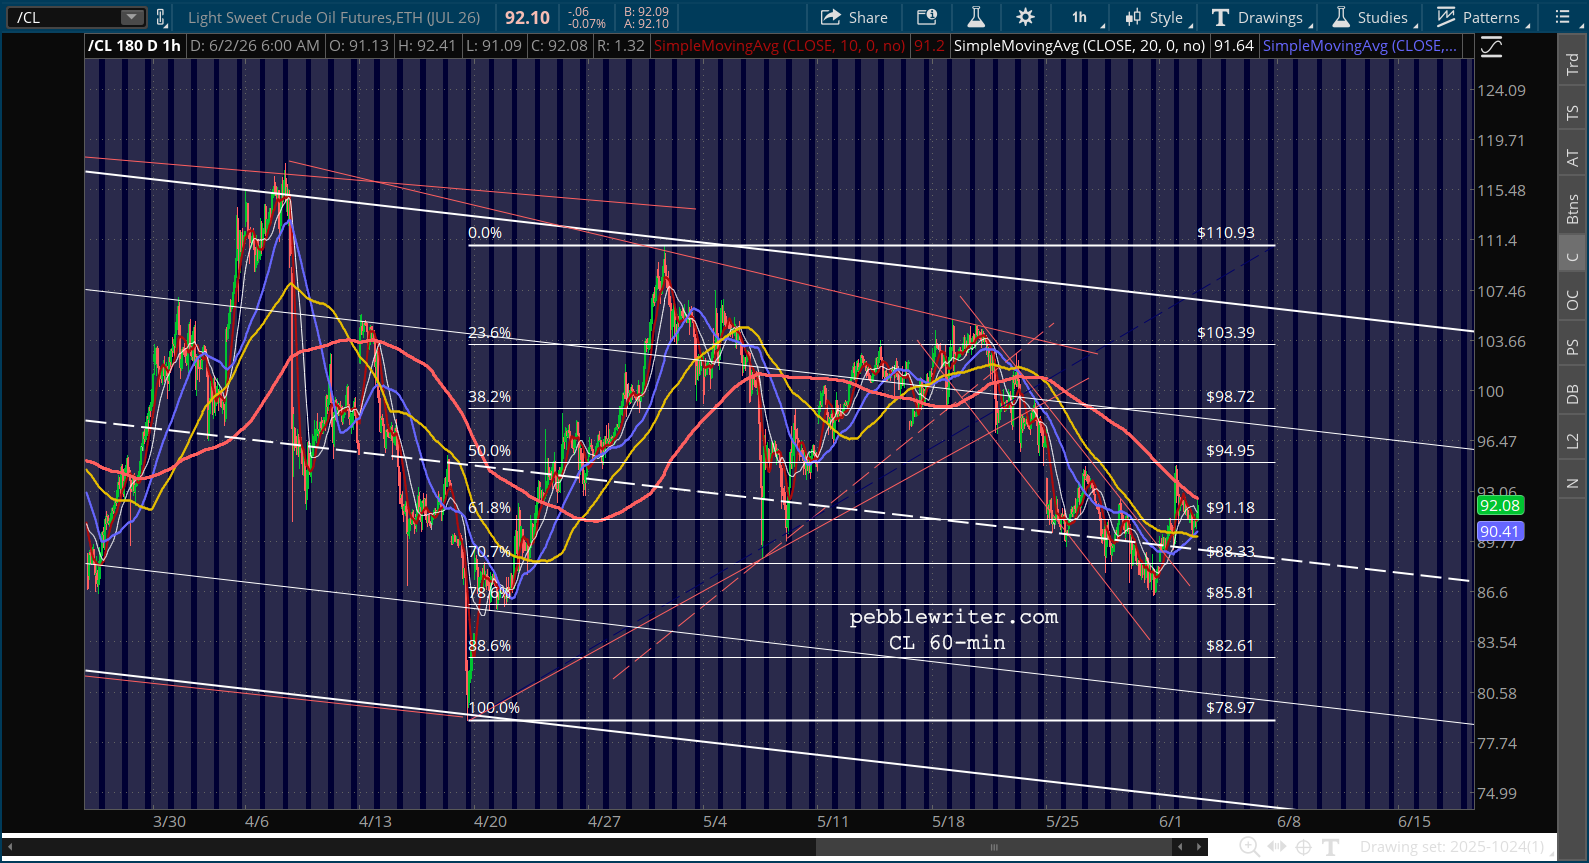
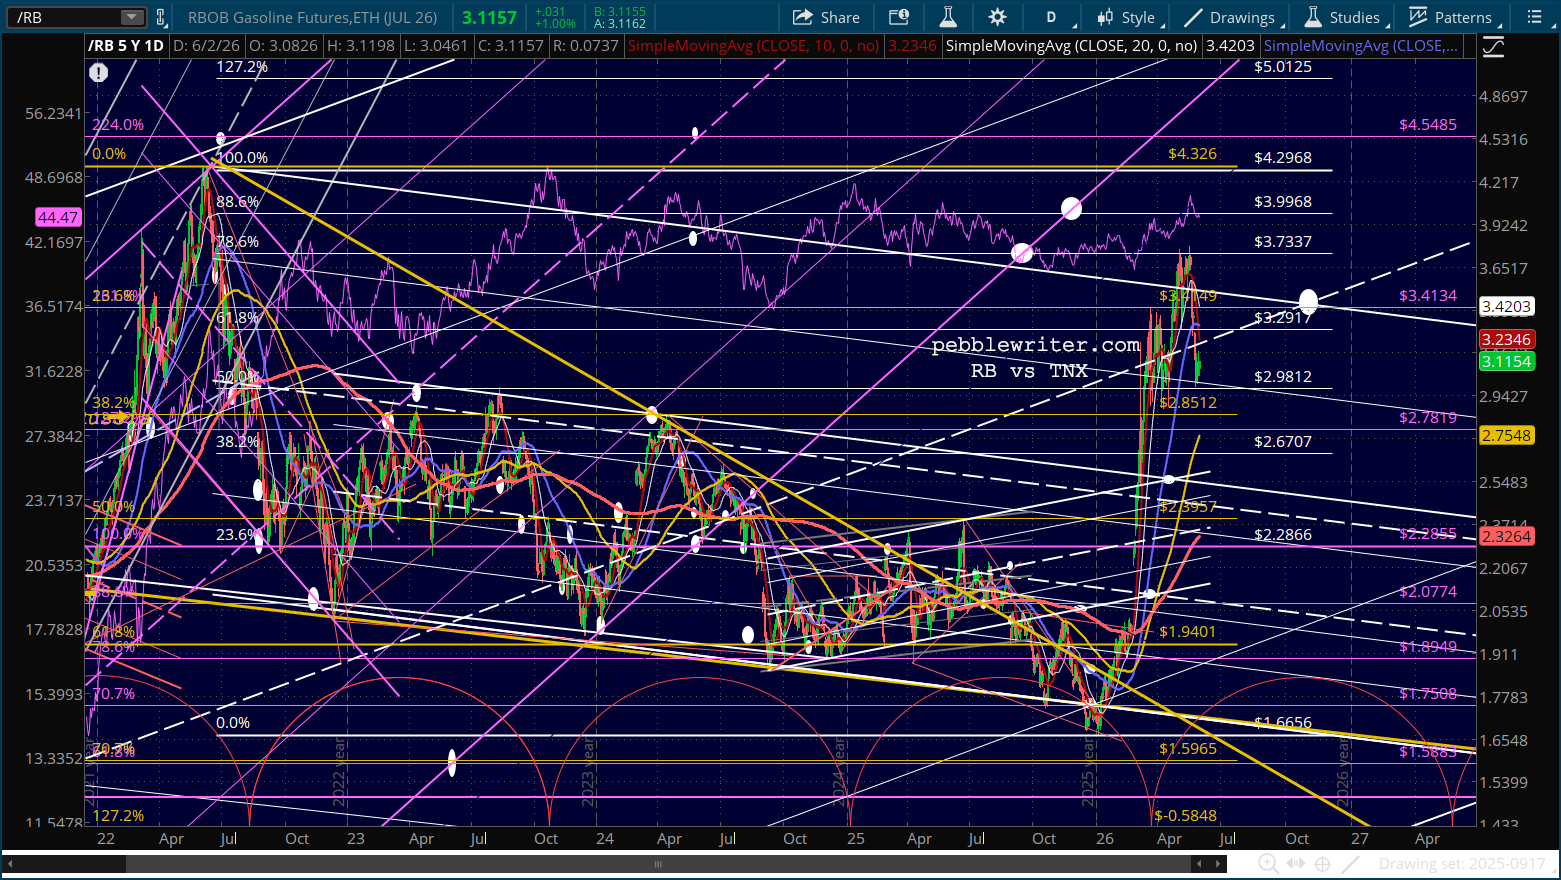
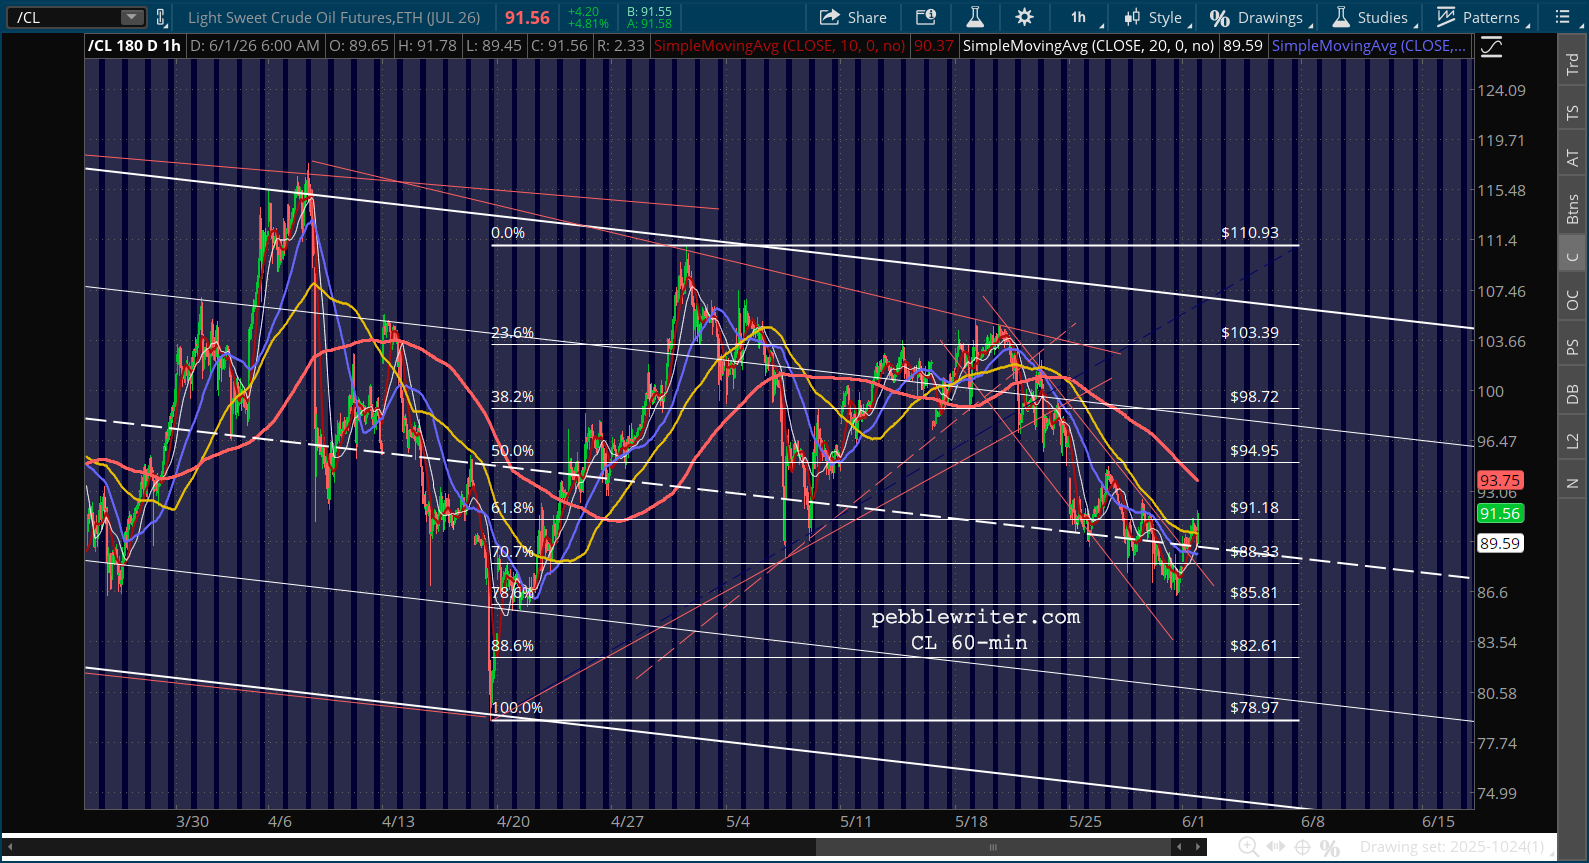
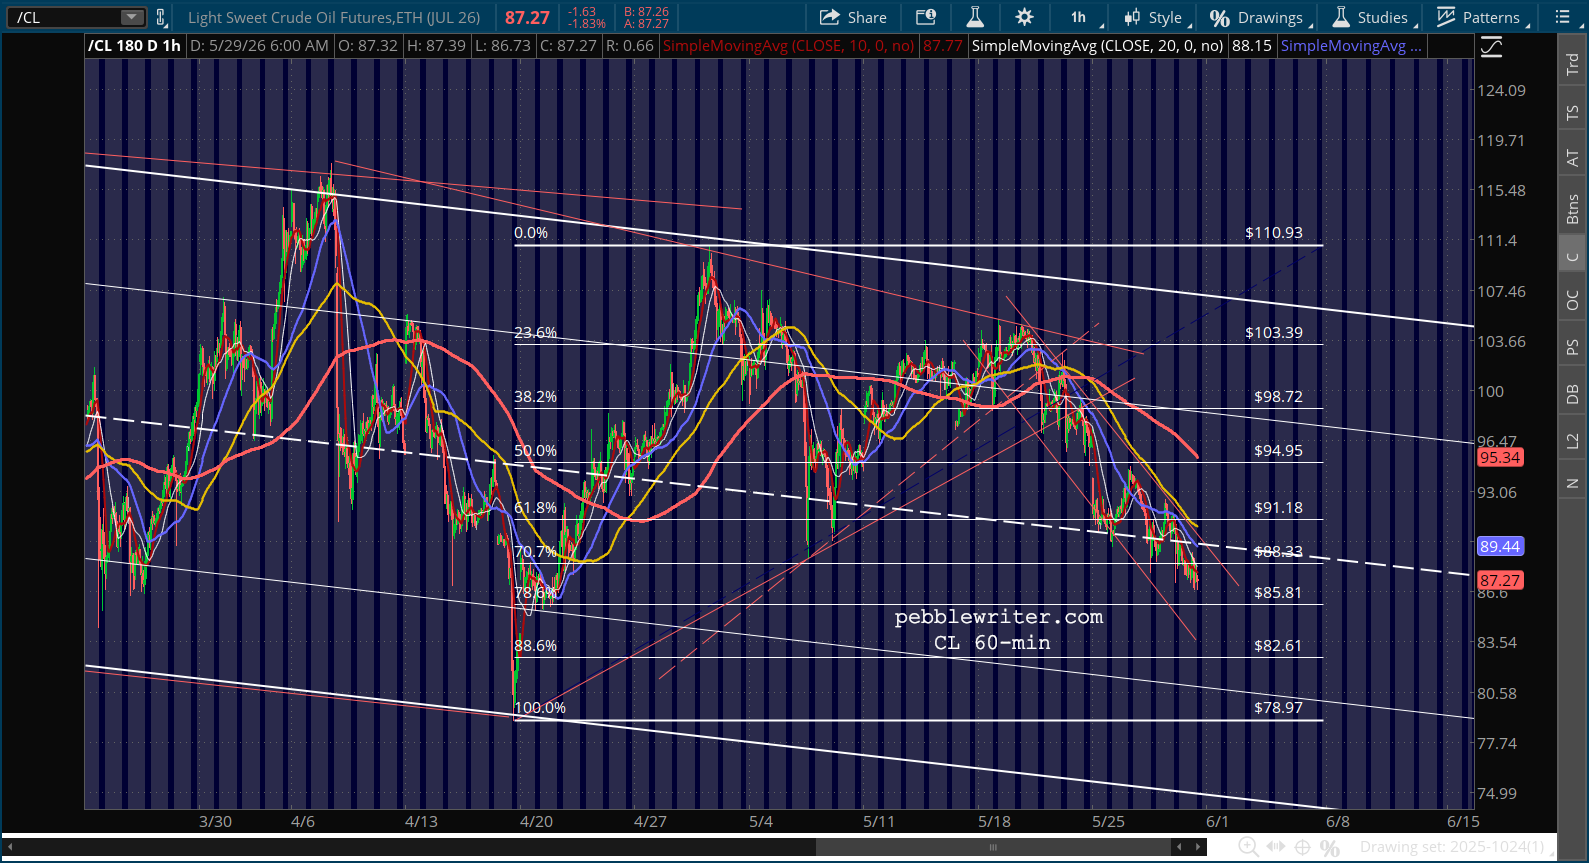
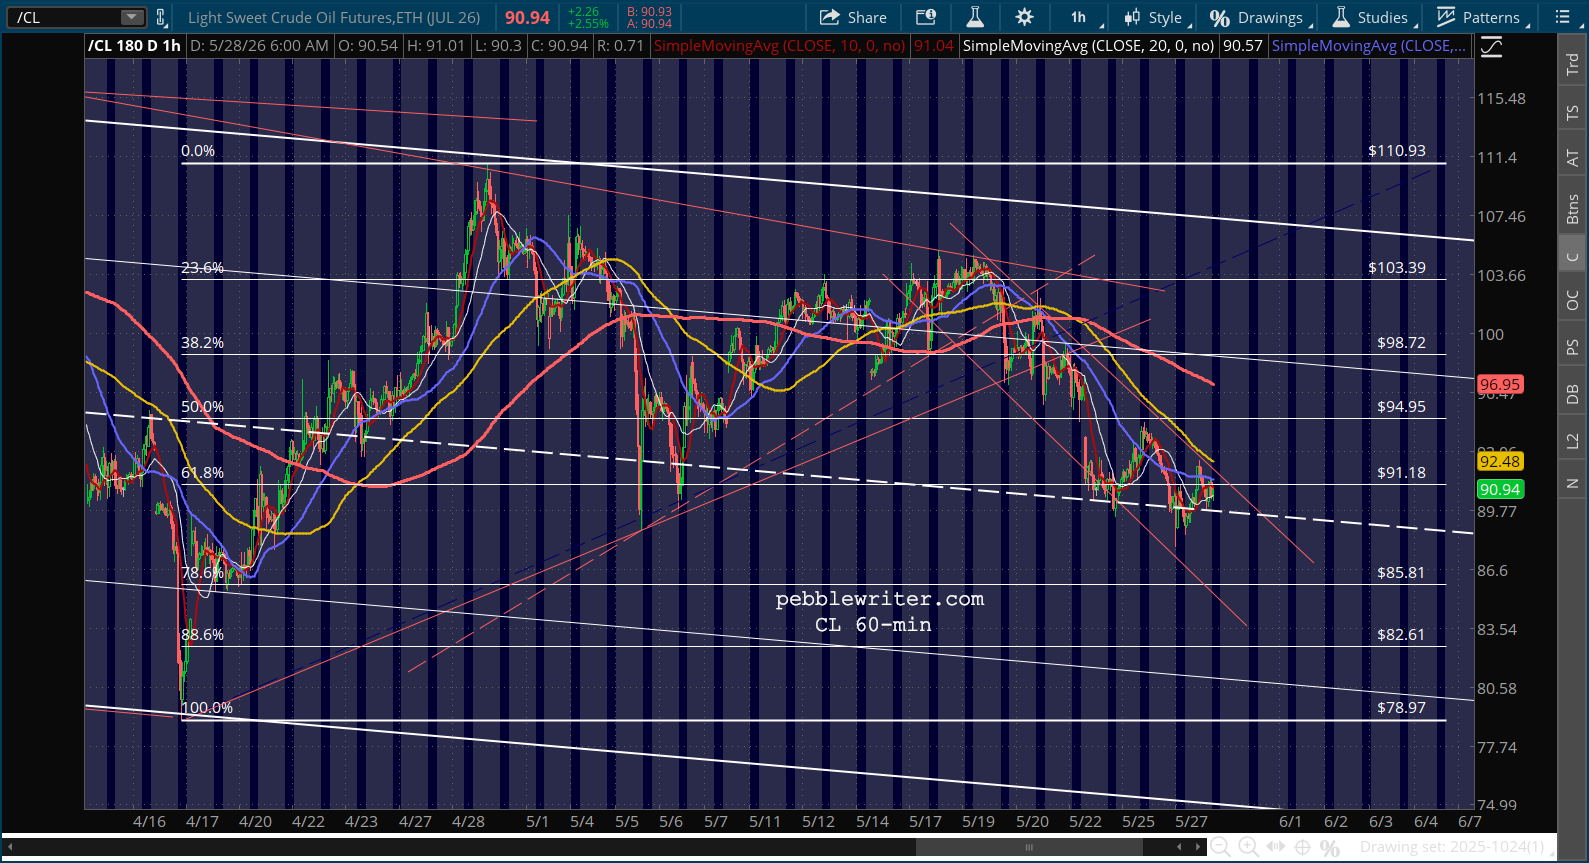
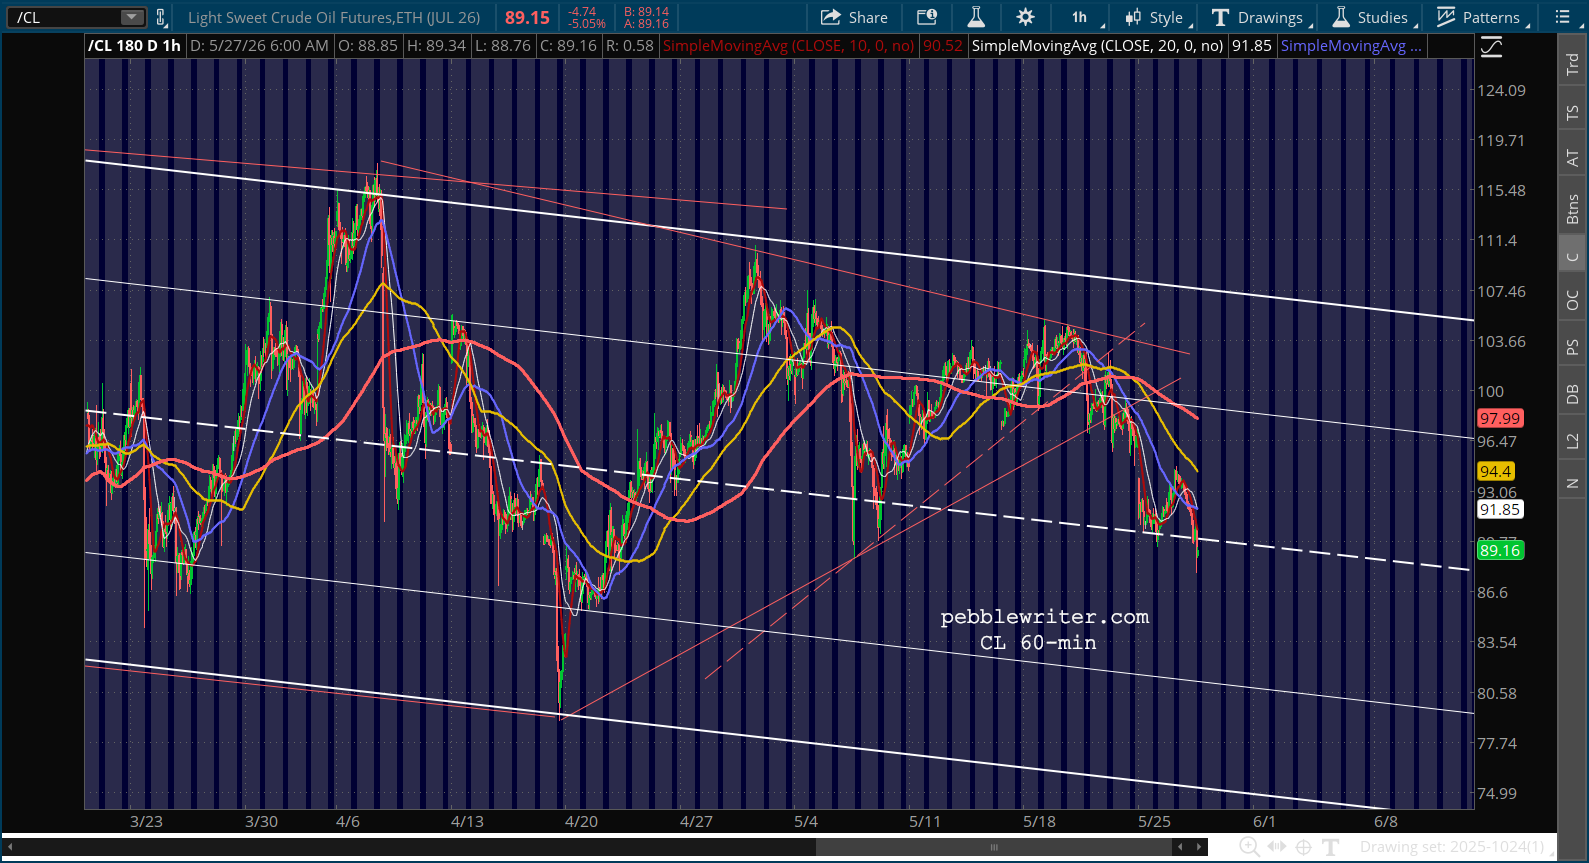
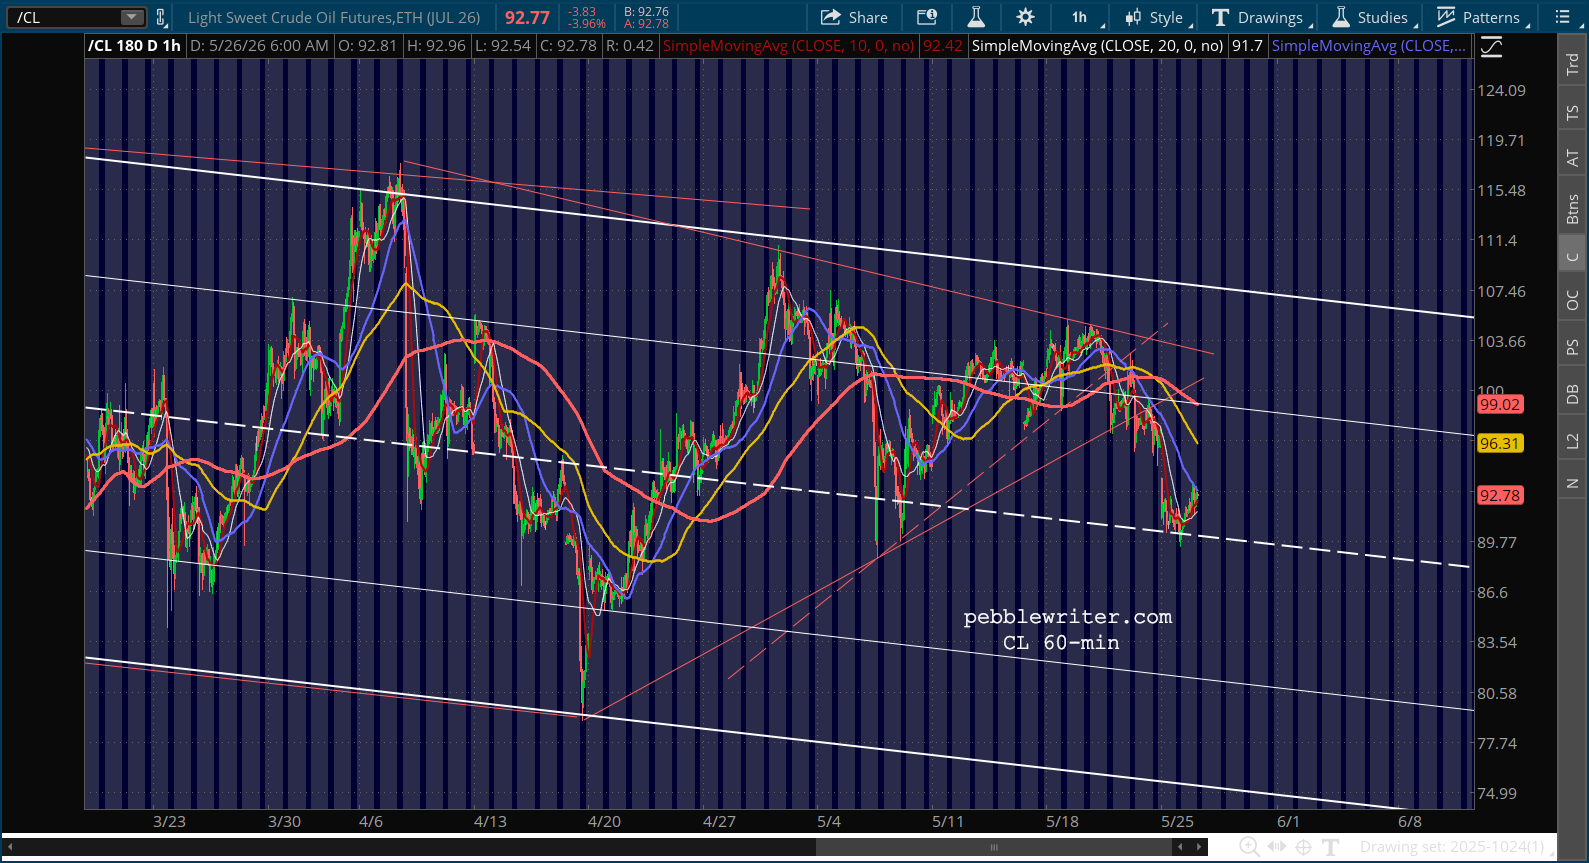
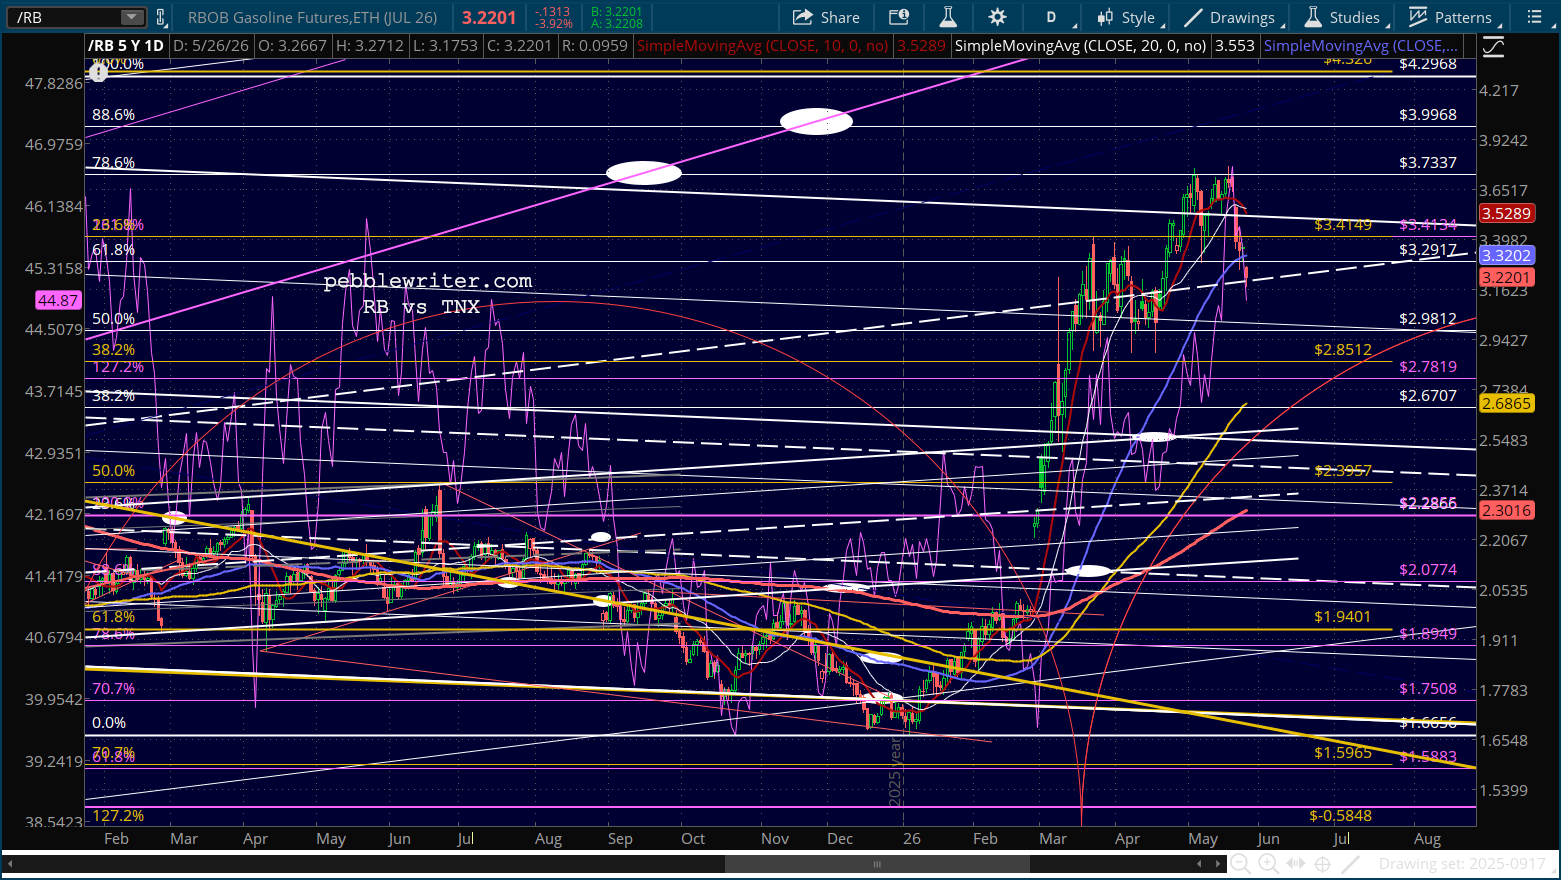
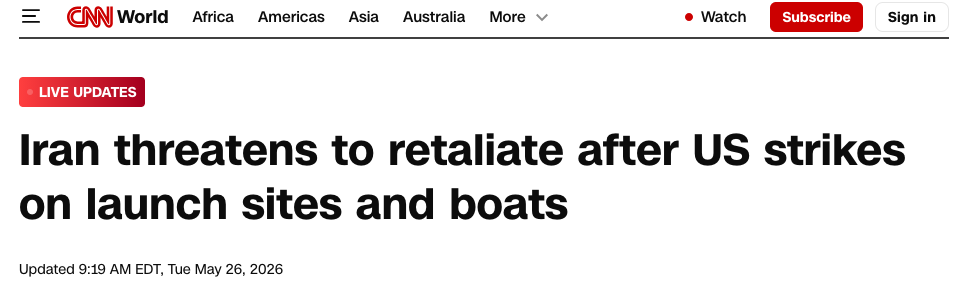
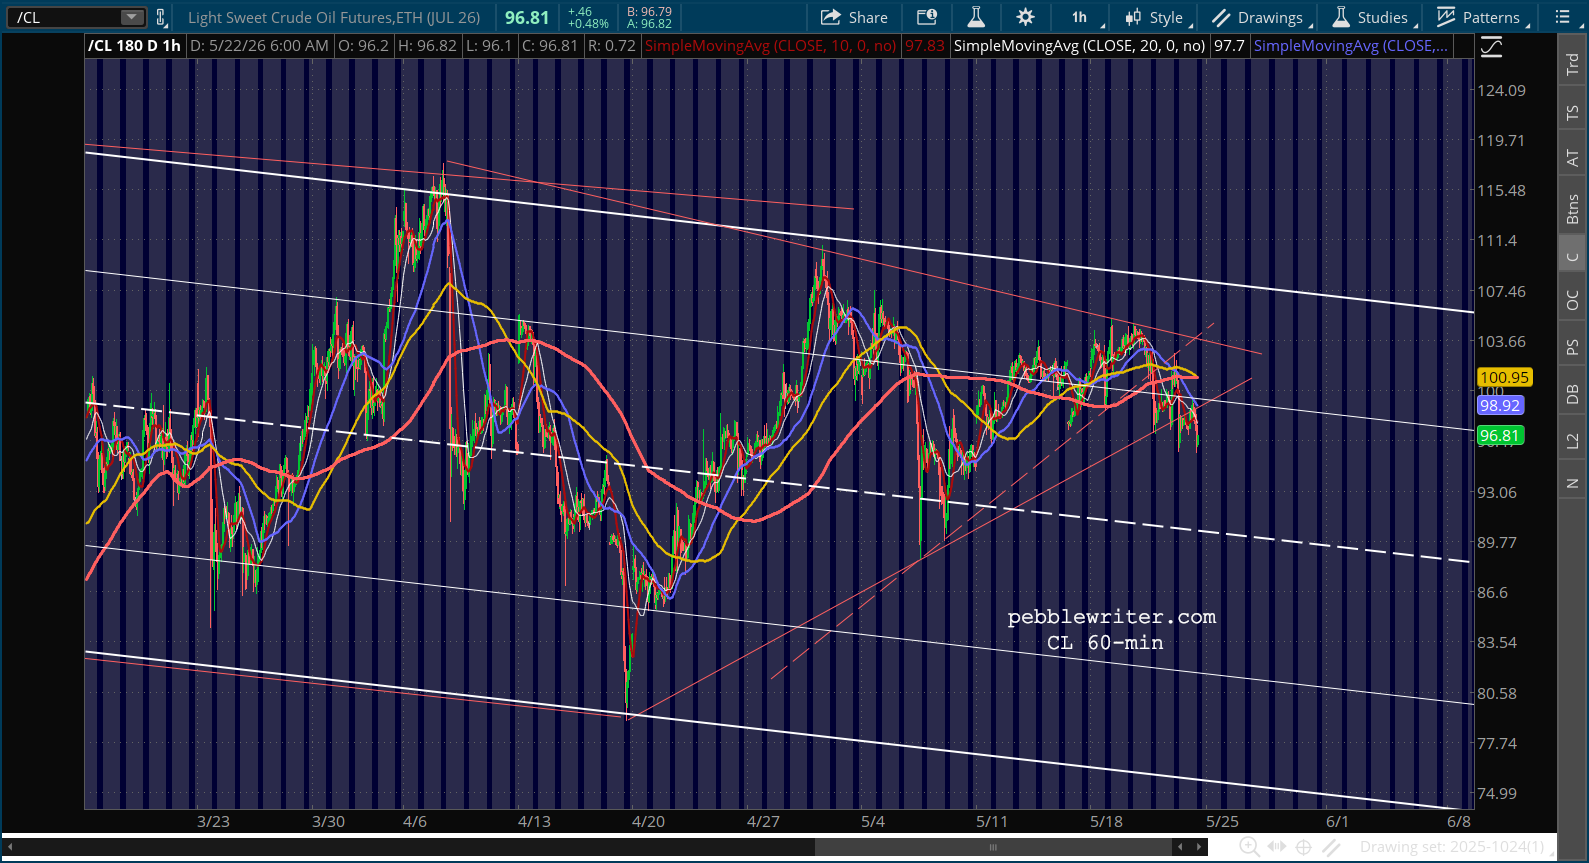
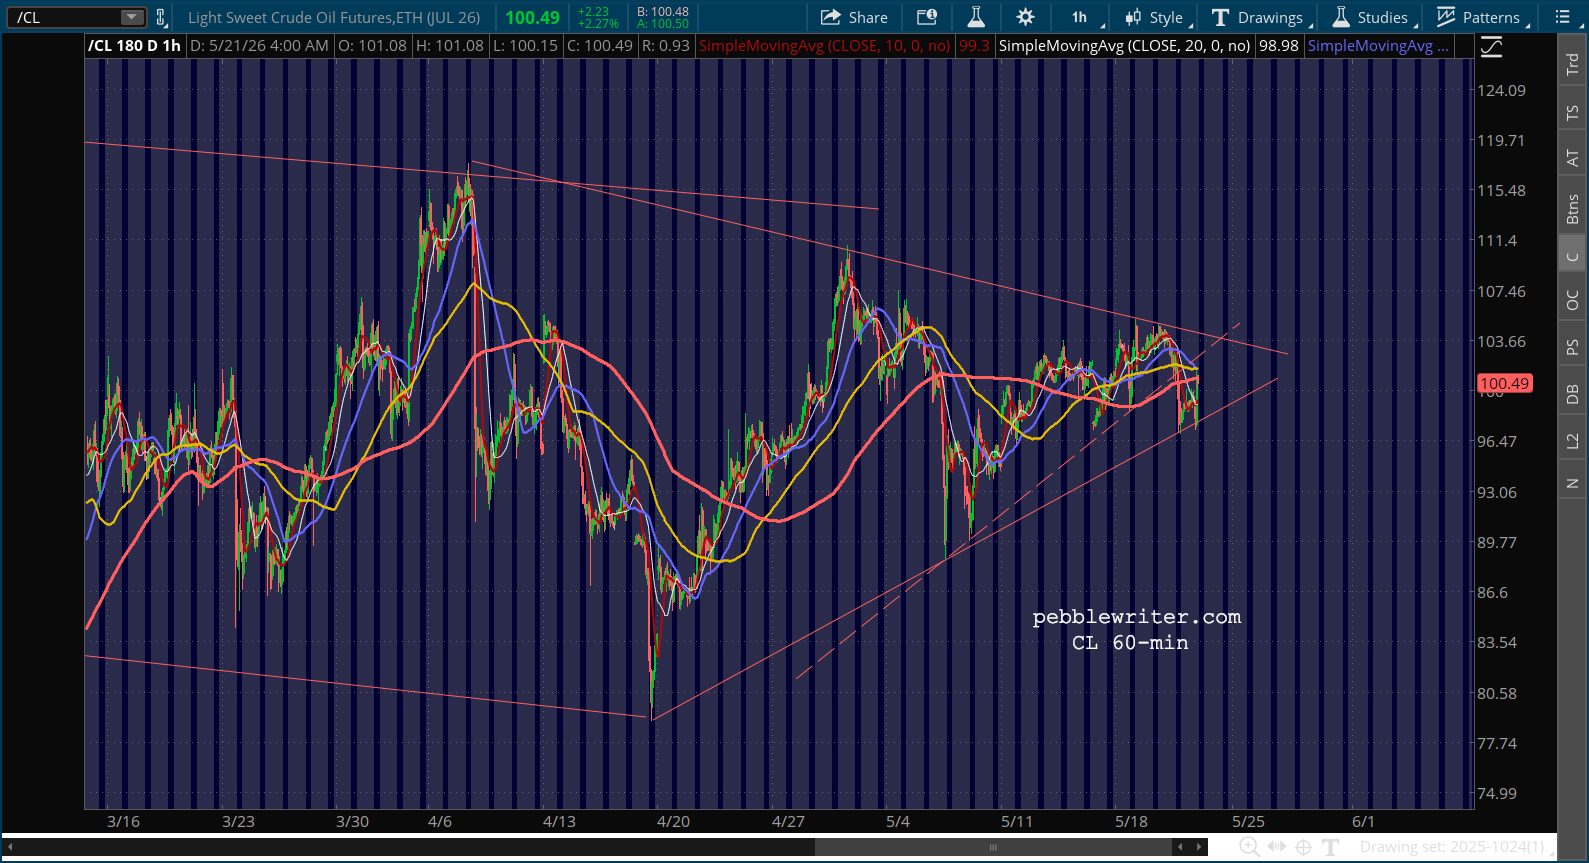
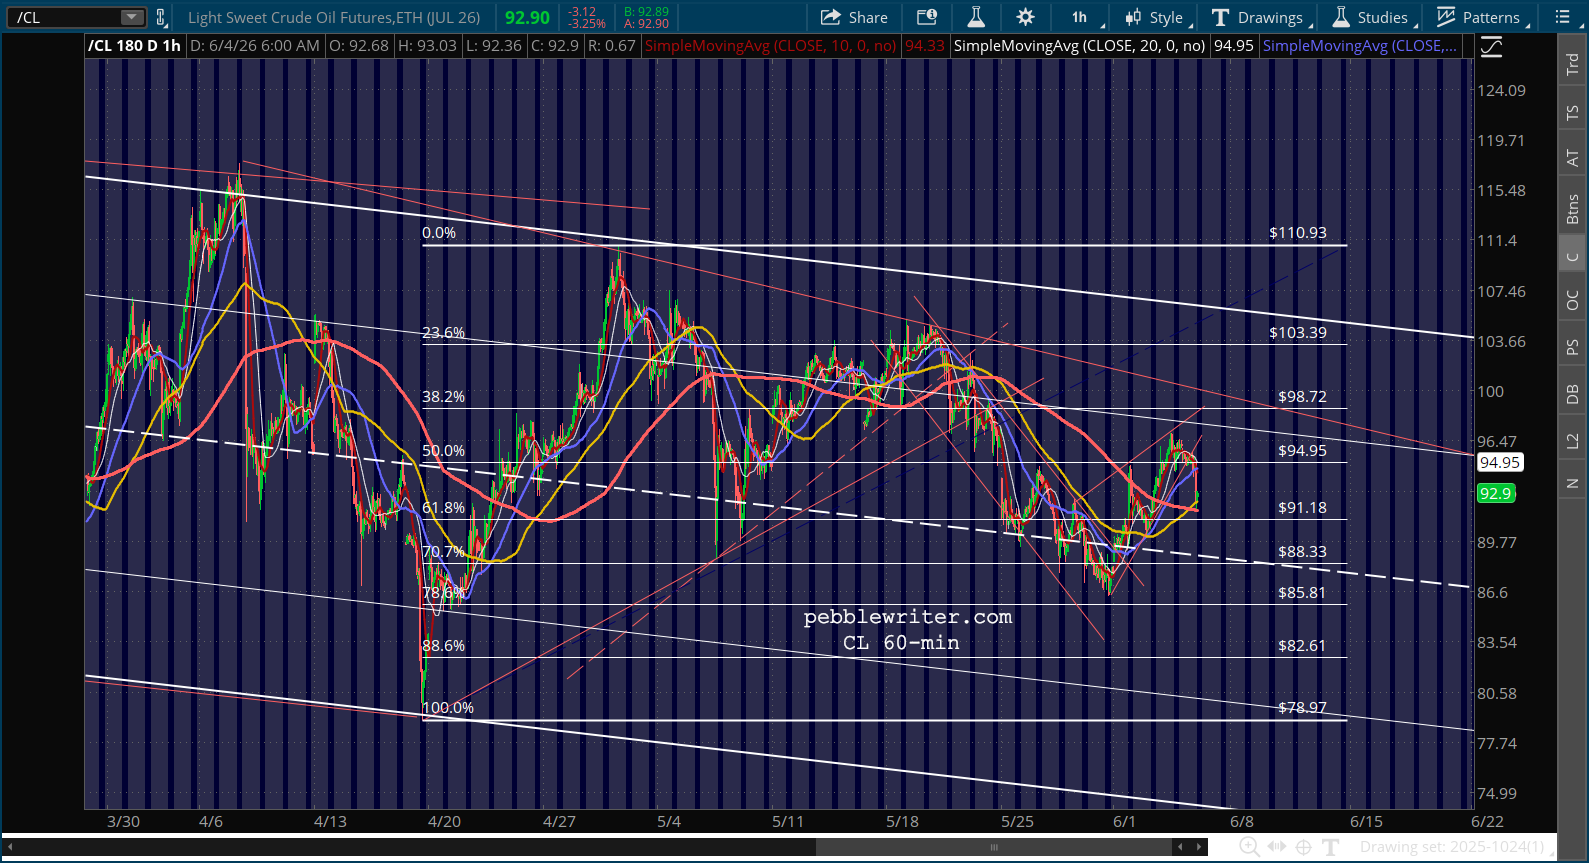
Which, of course, takes us to Iran. The headlines are not great at the moment, but WTI is selling off anyway.
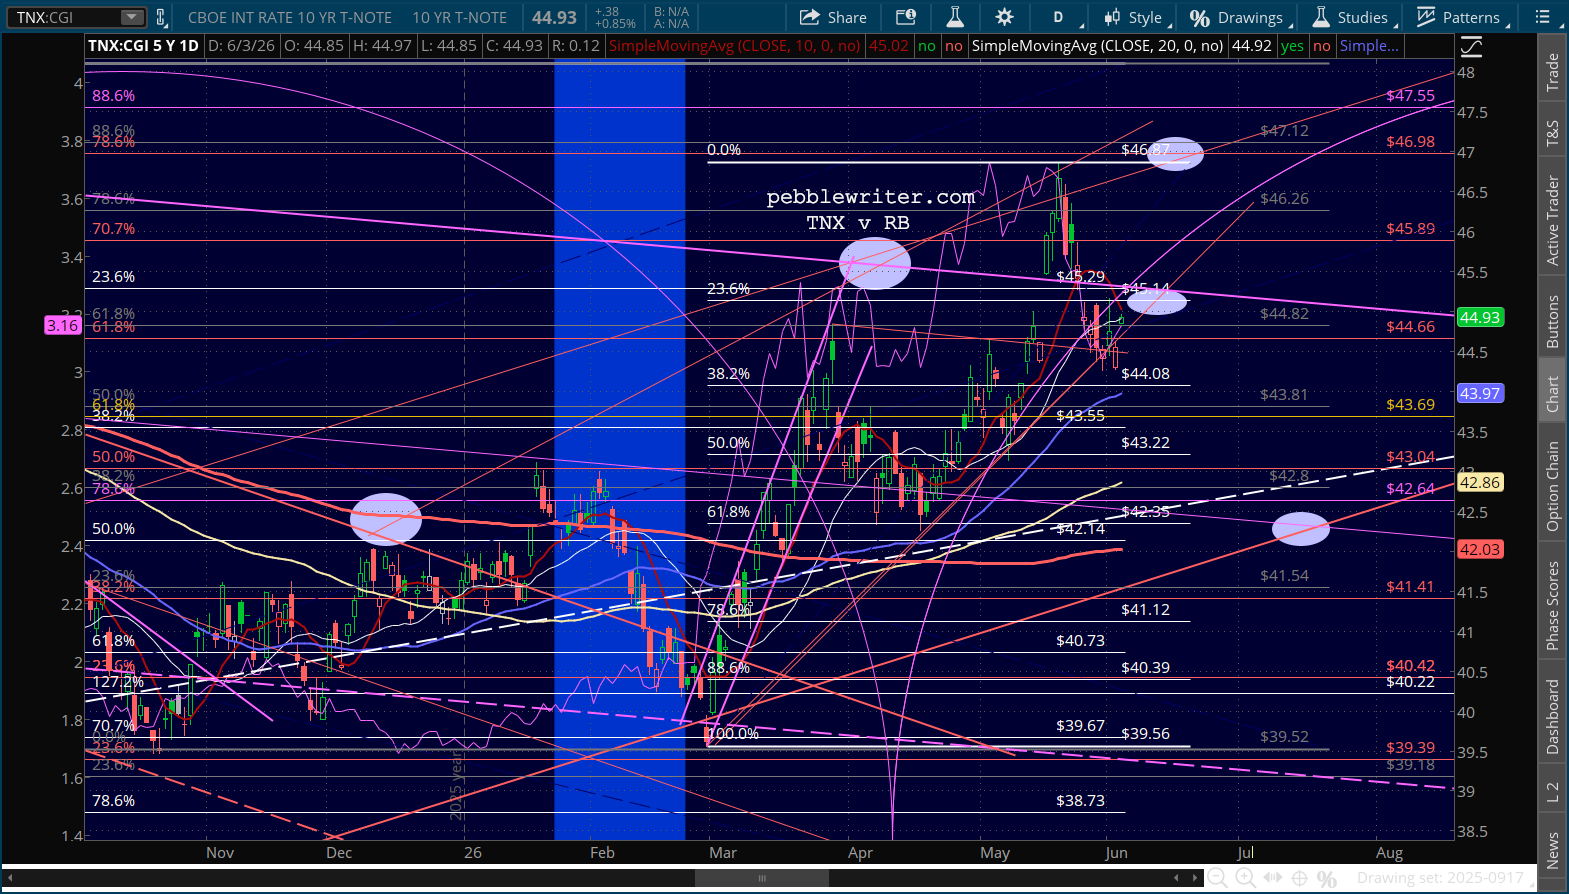
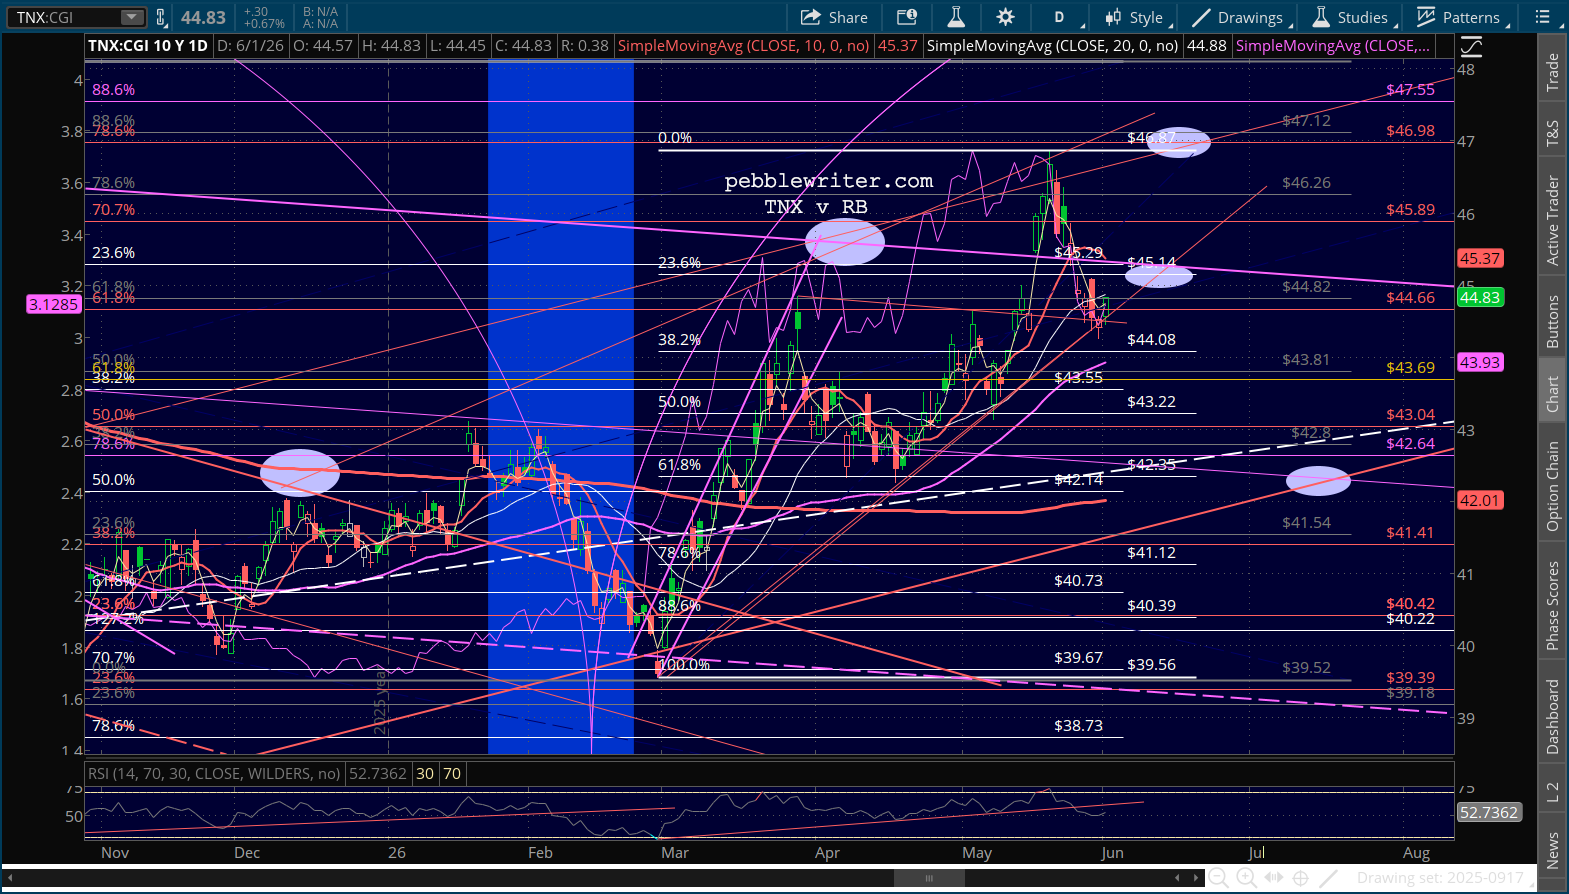
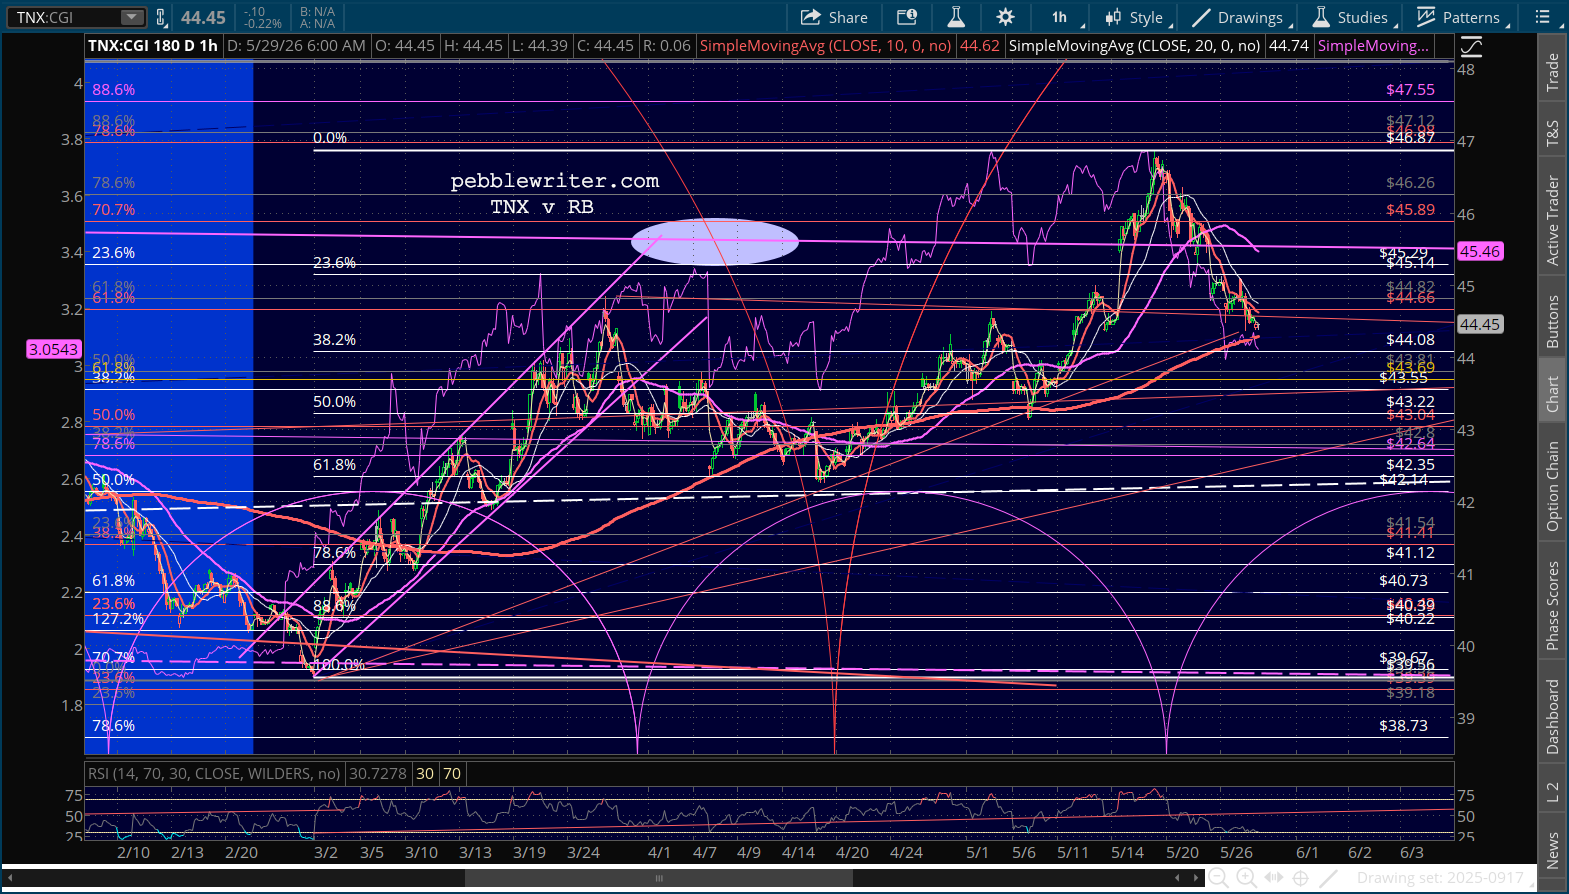
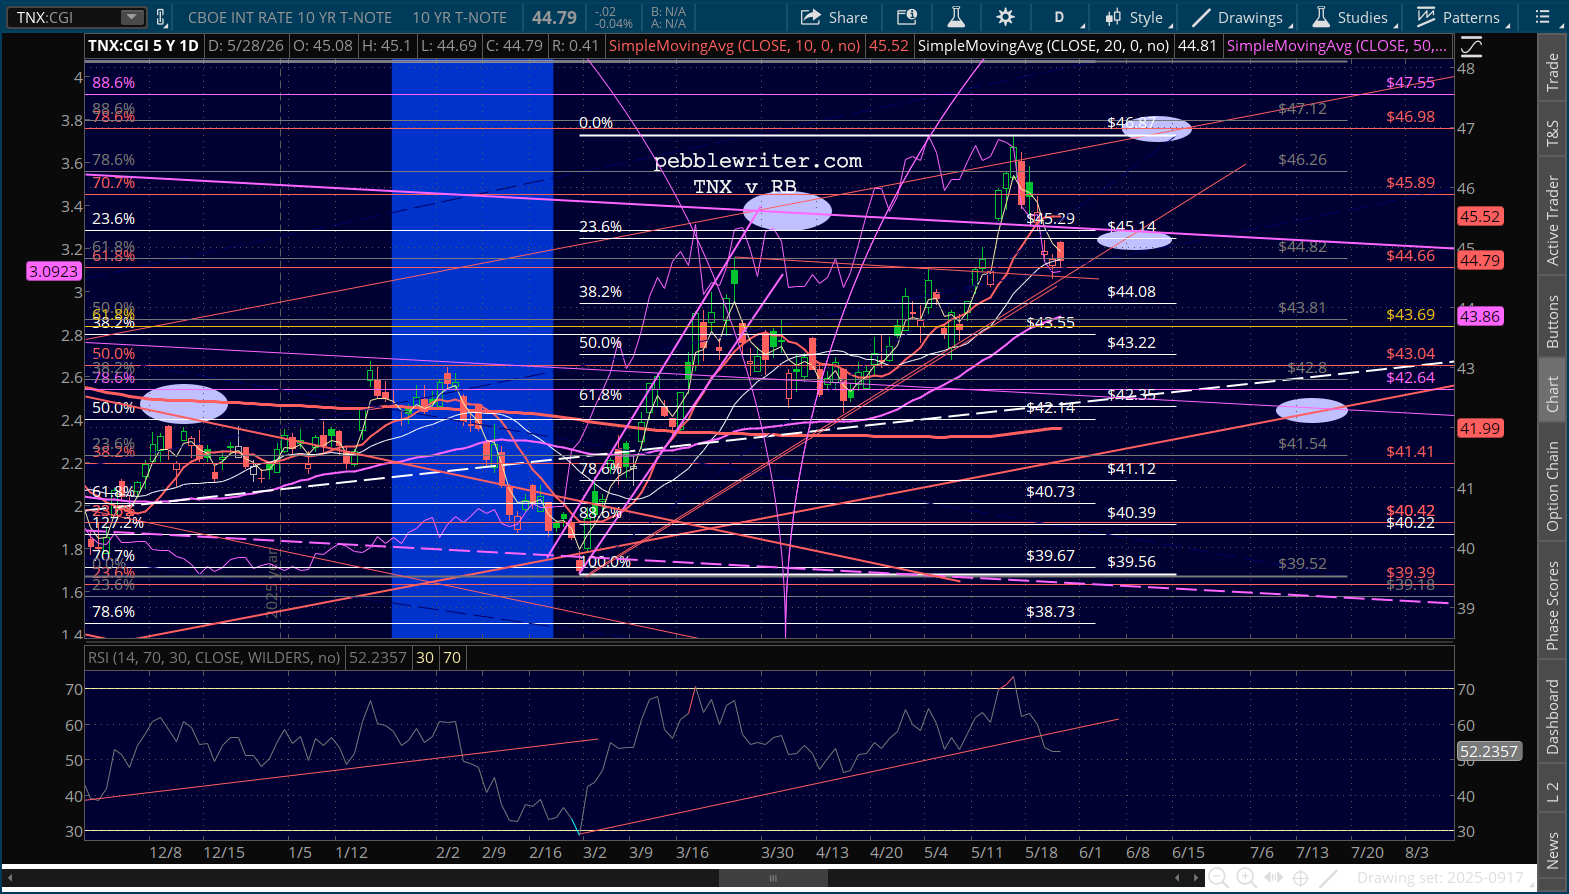
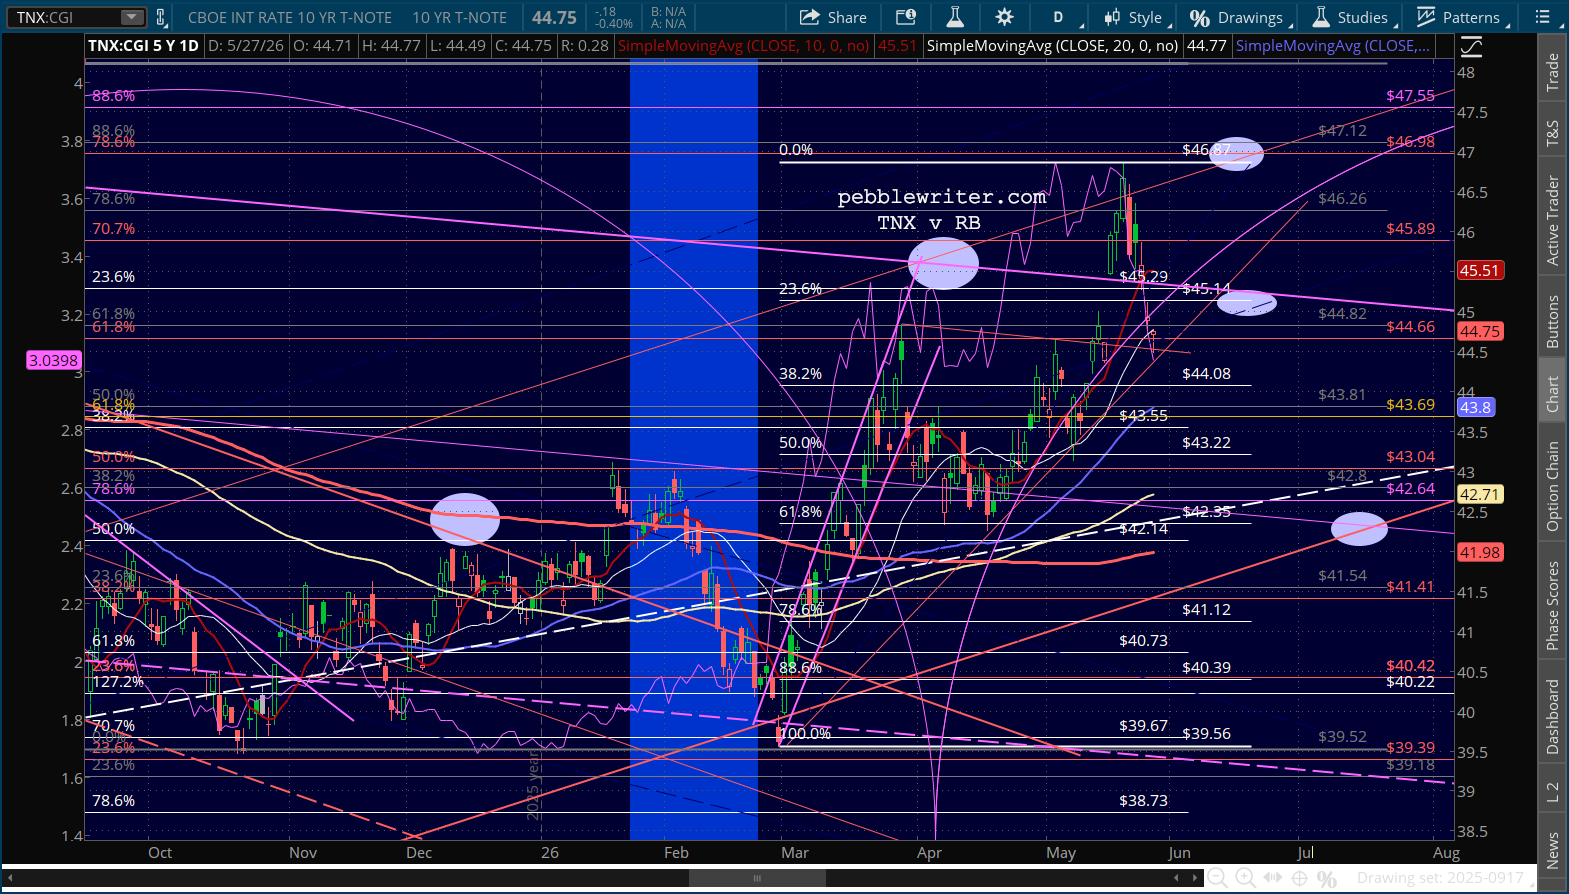
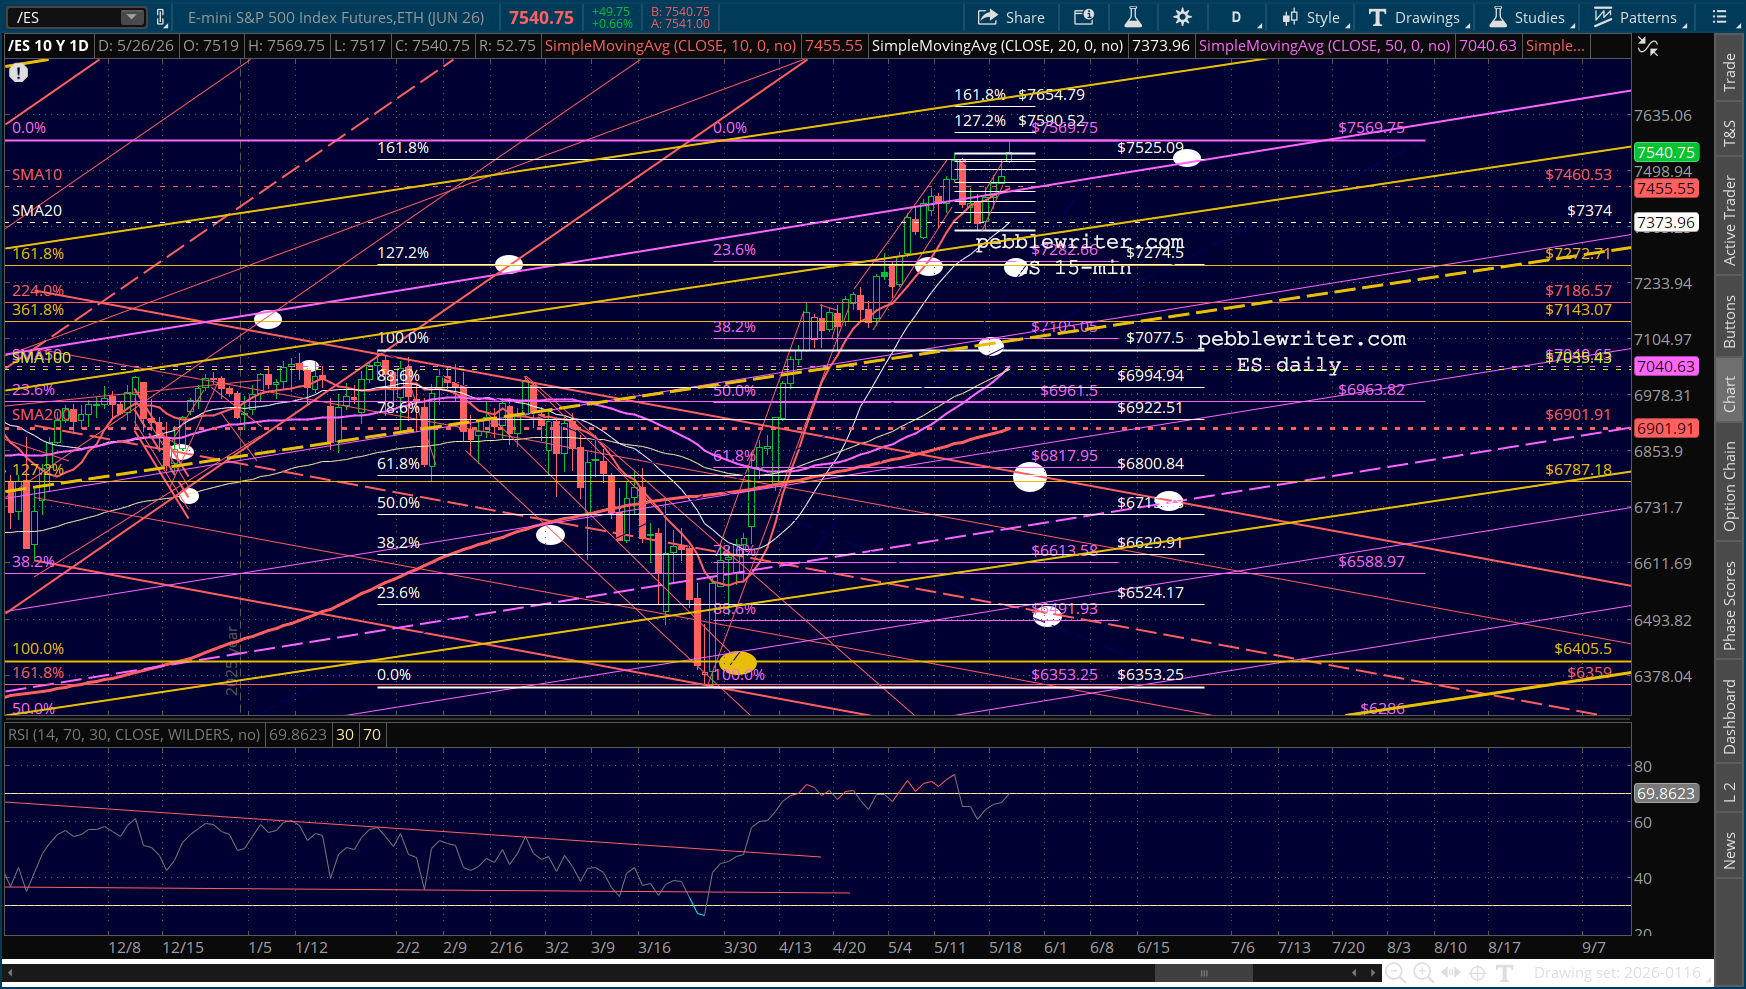
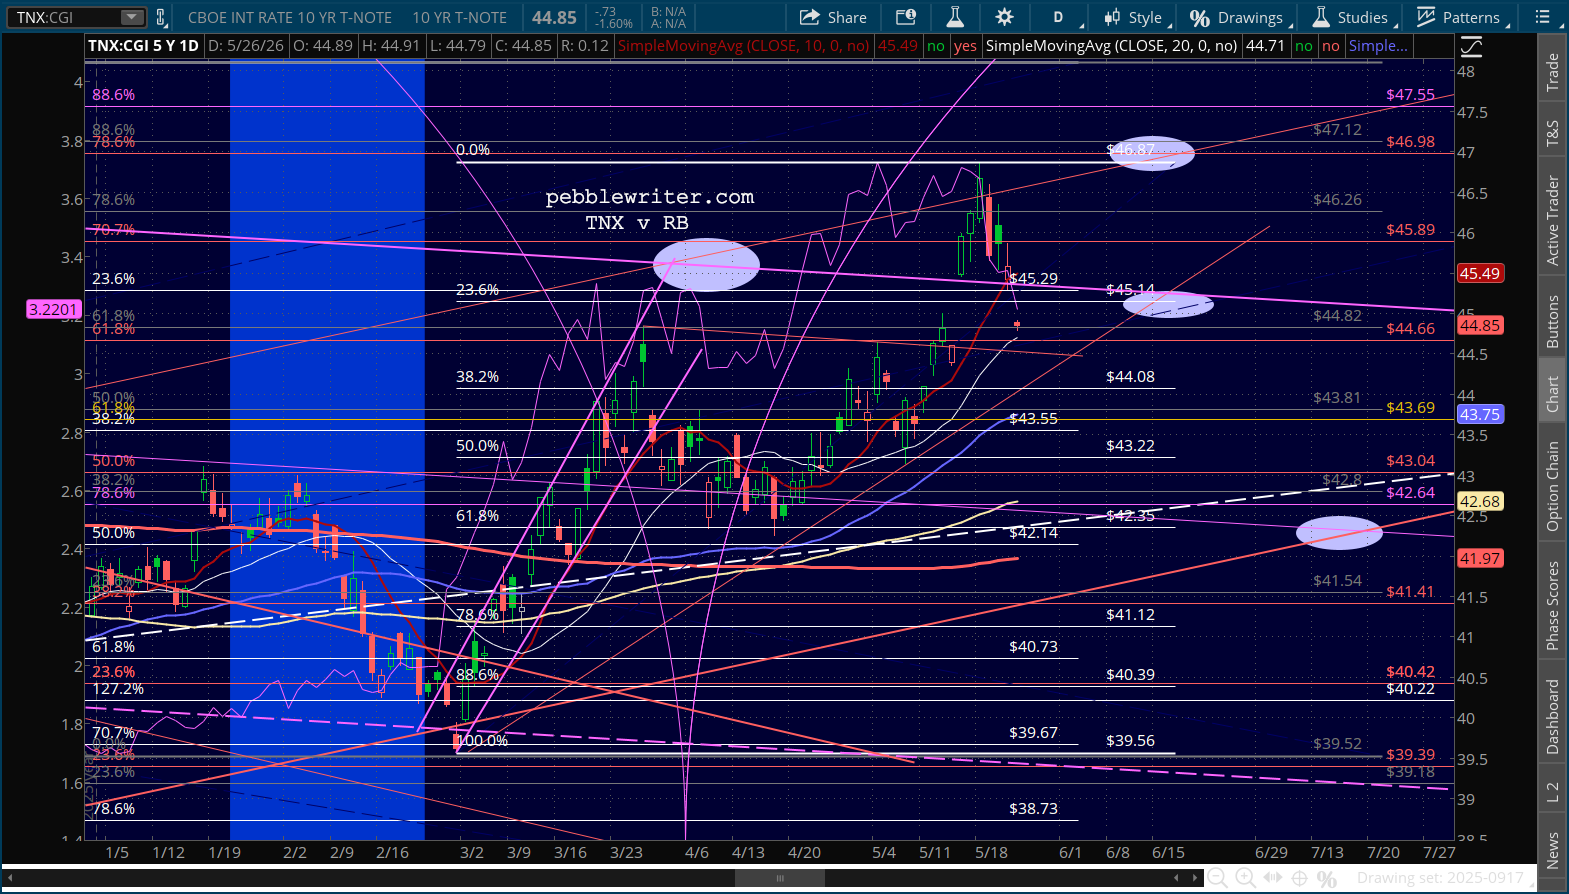
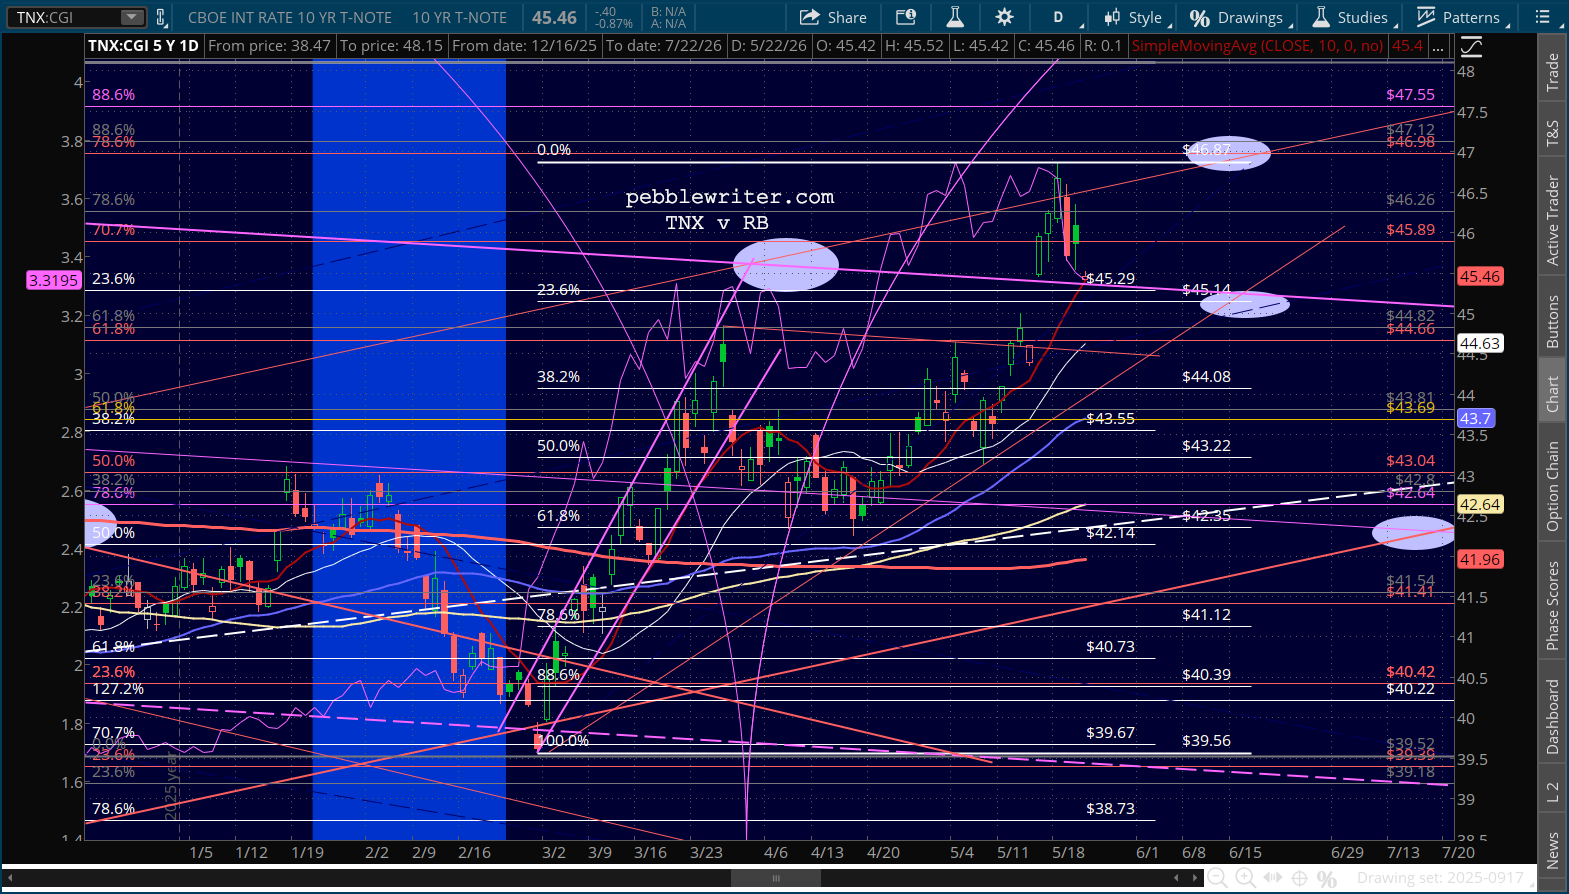
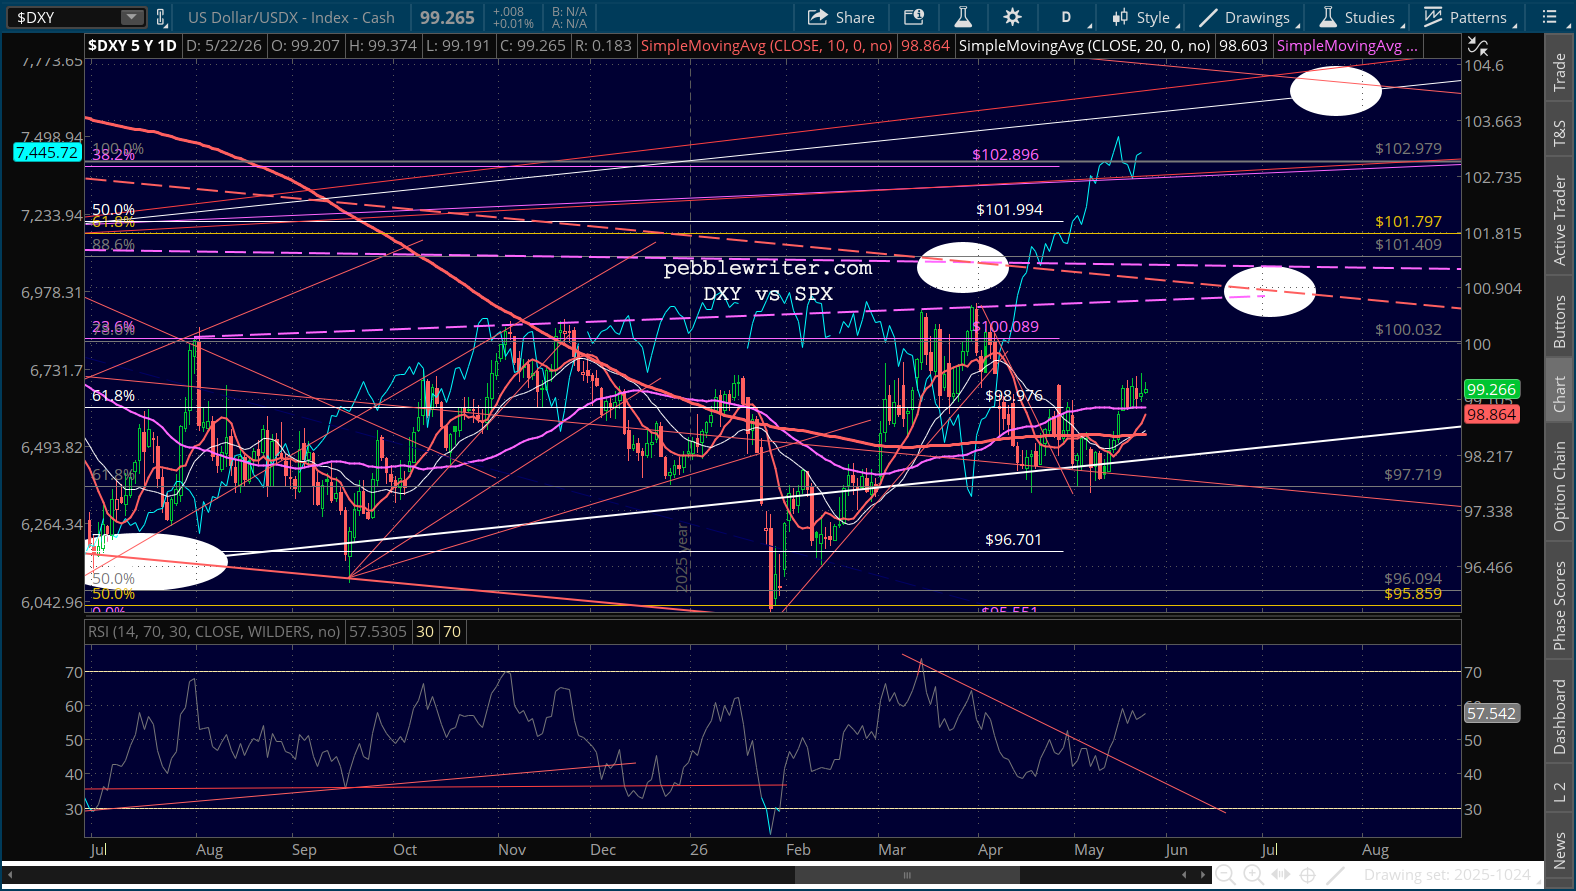
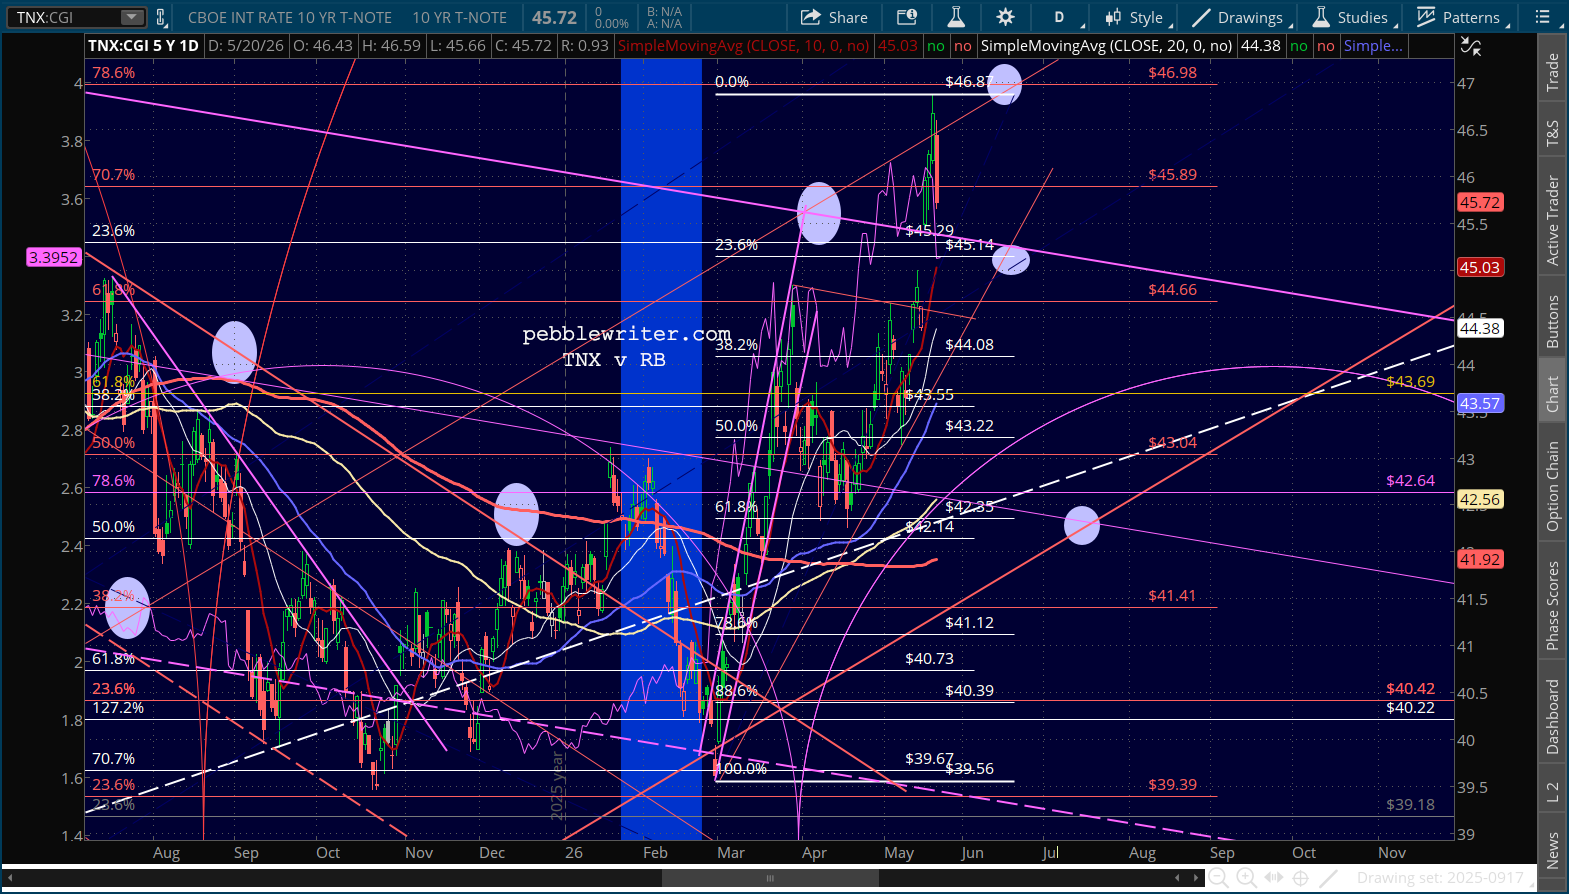
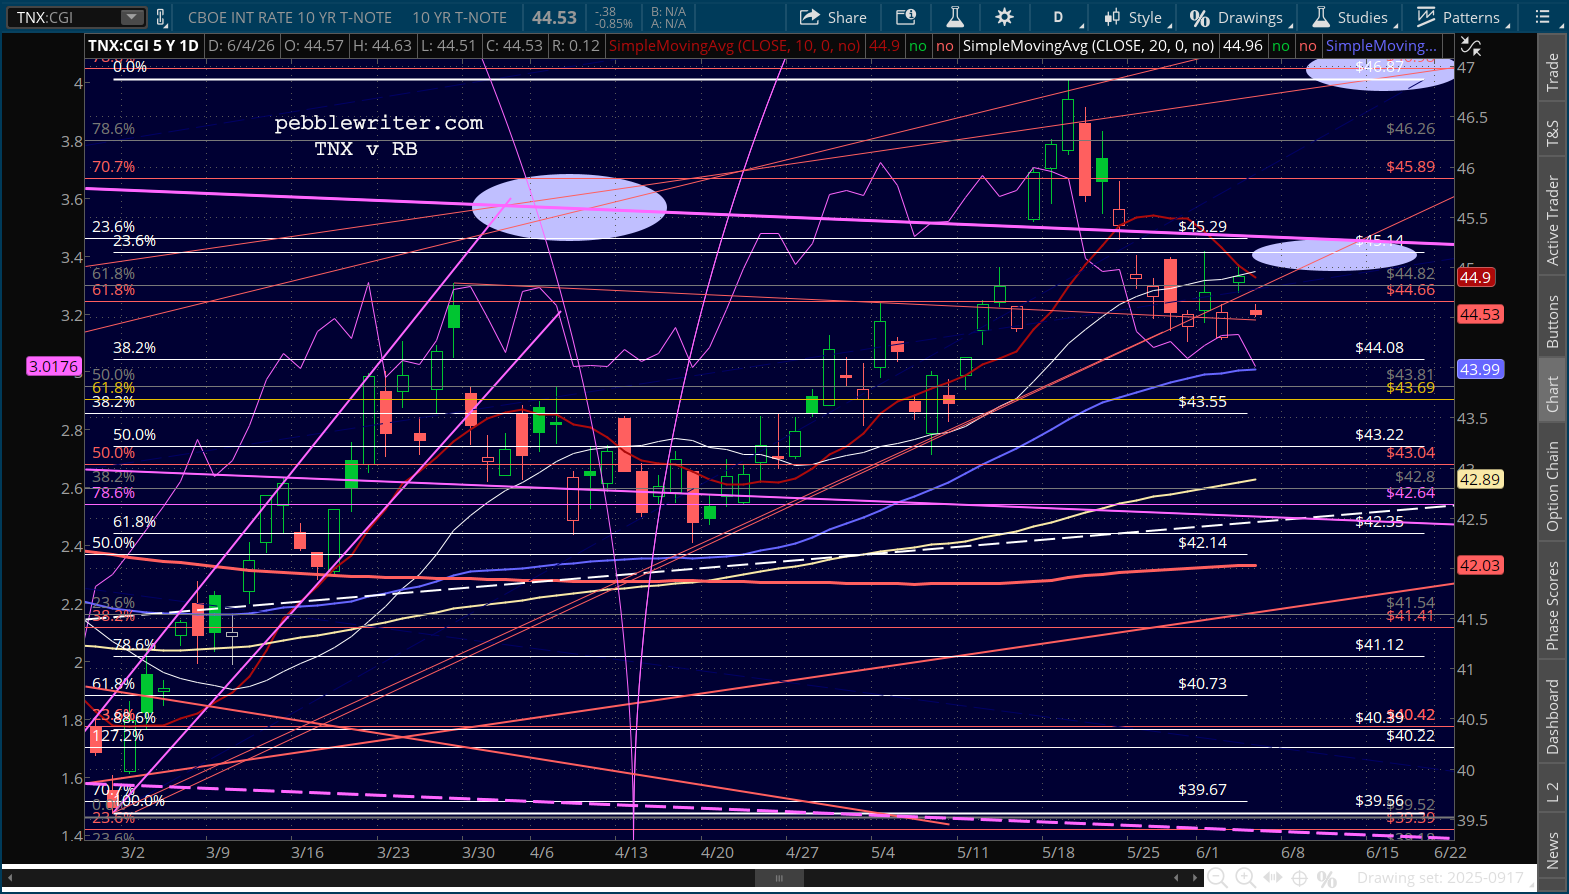
This allows the 10Y to retreat from yesterday’s pop above TL resistance to test the SMA10 and SMA20.
One of my favorite analysts, Jim Paulsen, wrote an interesting piece the other day in his substack PaulsenPerspectives about the positive correlation between oil price spikes and market tops. Spoiler alert: there is one. Check it out HERE.
Stay tuned…