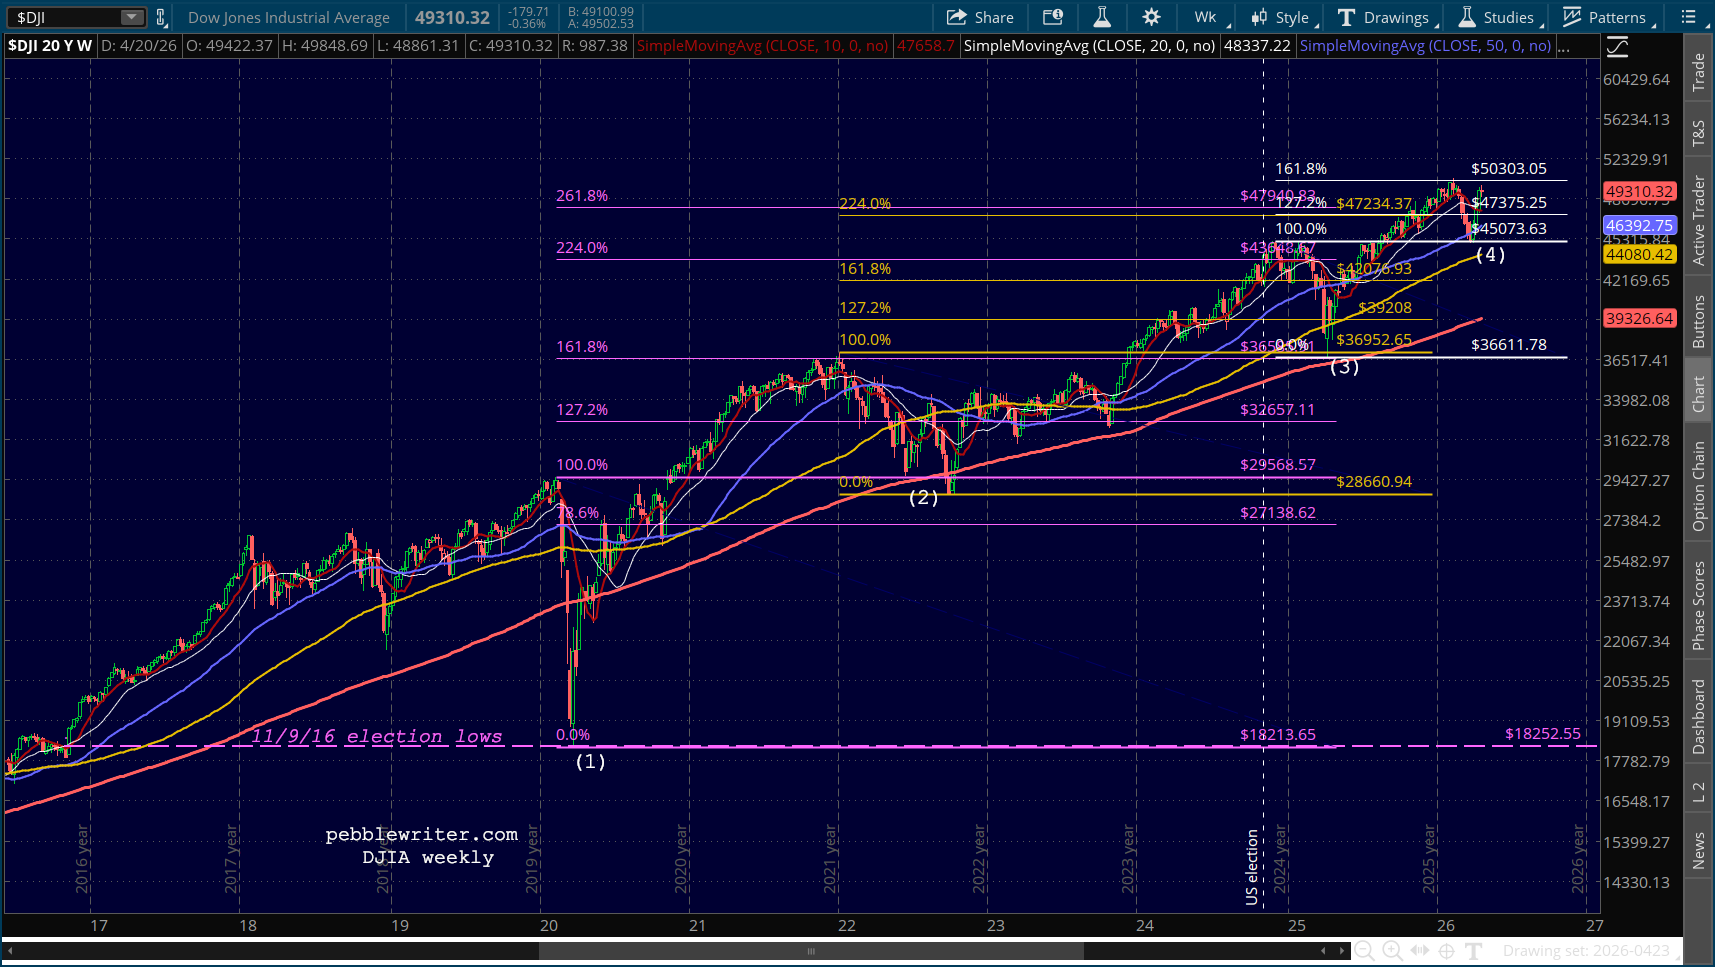
Since November 2016, the Dow Jones Industrial Average has exhibited a distinctive and repeatable structural behavior: every significant correction has terminated at or within a few percent of a prior structural high, with the sole exception of the 2020 COVID low (which instead halted precisely at the November 9, 2016 election night low — itself a politically significant price point). Across four separate episodes spanning a decade of wildly varying macroeconomic conditions, the same geometry keeps appearing.
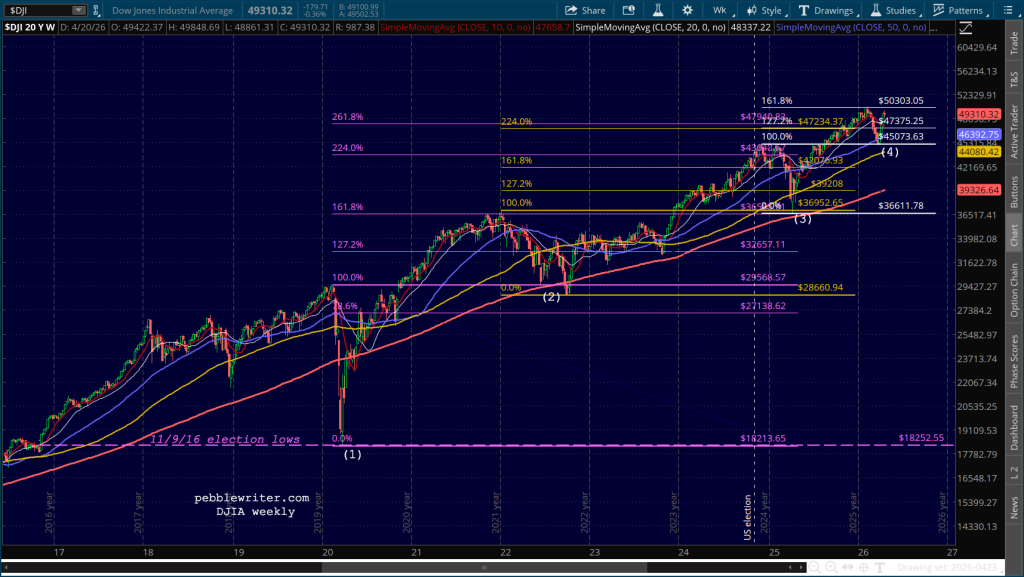
The record is remarkably consistent: Four corrections, four prior-high reversals, precision that grows tighter over time.
- The March 2020 COVID crash bottomed at 18,214, within 0.2% of the 18,253 election night lows.
- The October 2022 bear market bottomed at 28,661, reversing within 3% of the February 2020 pre-pandemic peak of 29,569. If the June lows had held, that would have been within 0.2%.
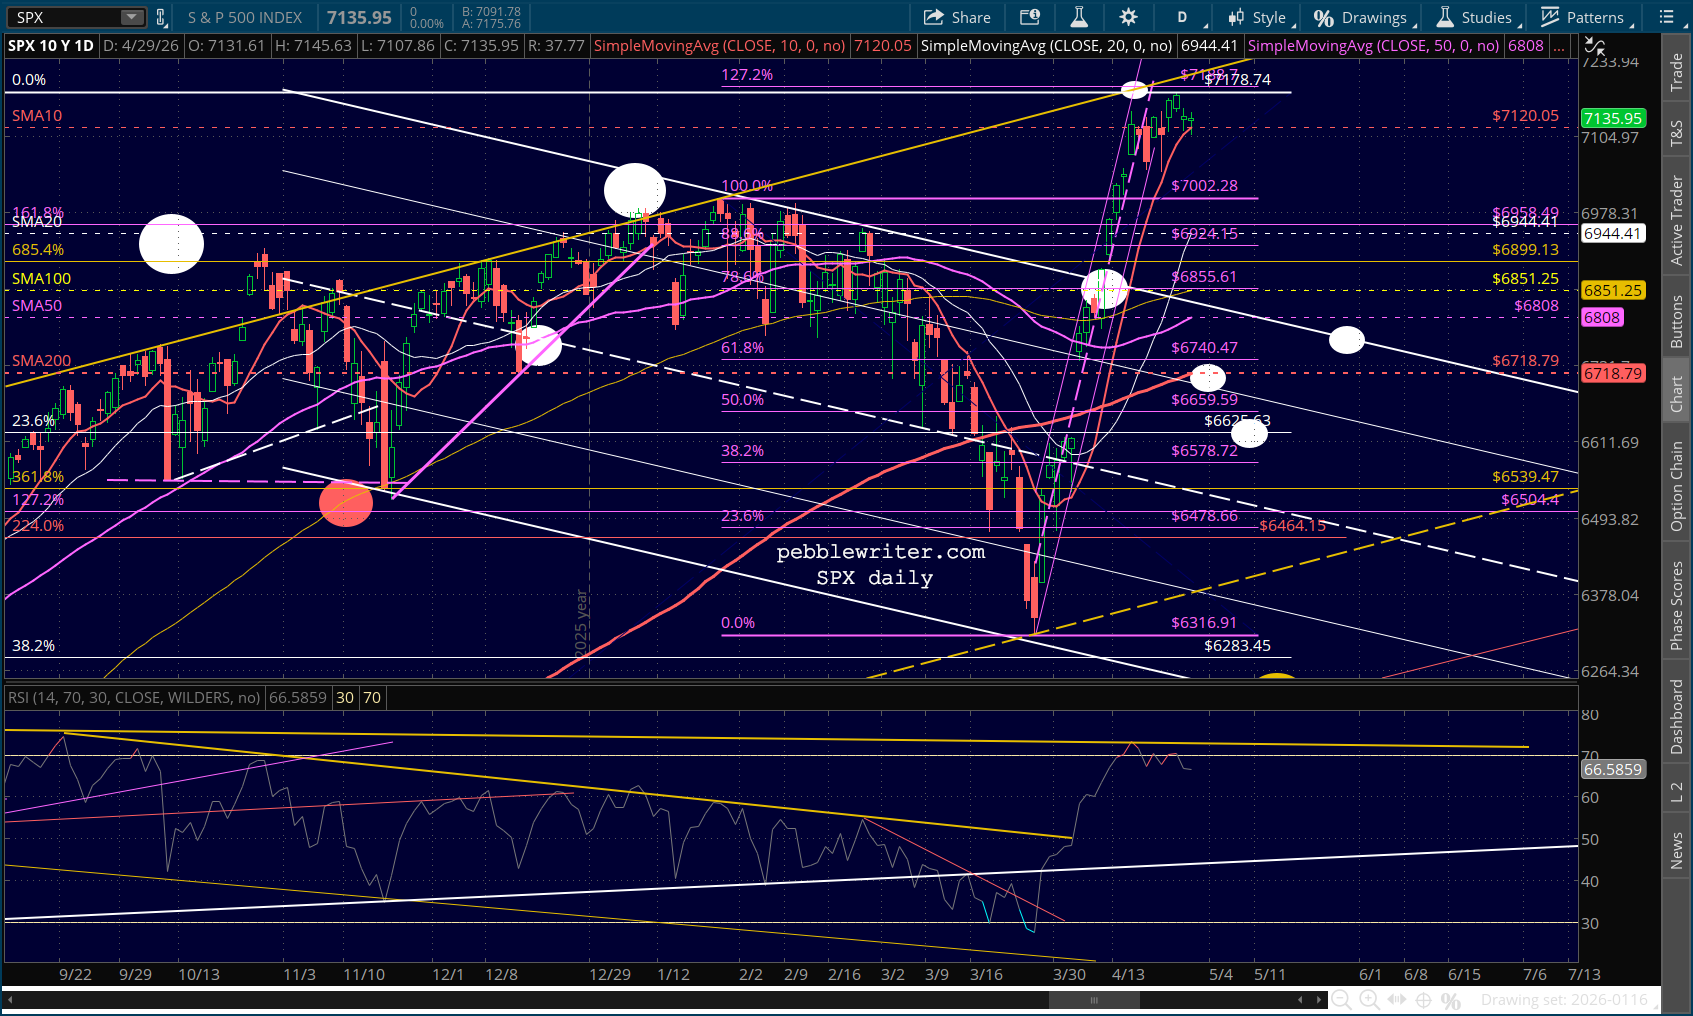
- The April 2025 tariff-shock correction ended at 36,612, within 0.9% of the January 2022 prior all-time high of 36,953.
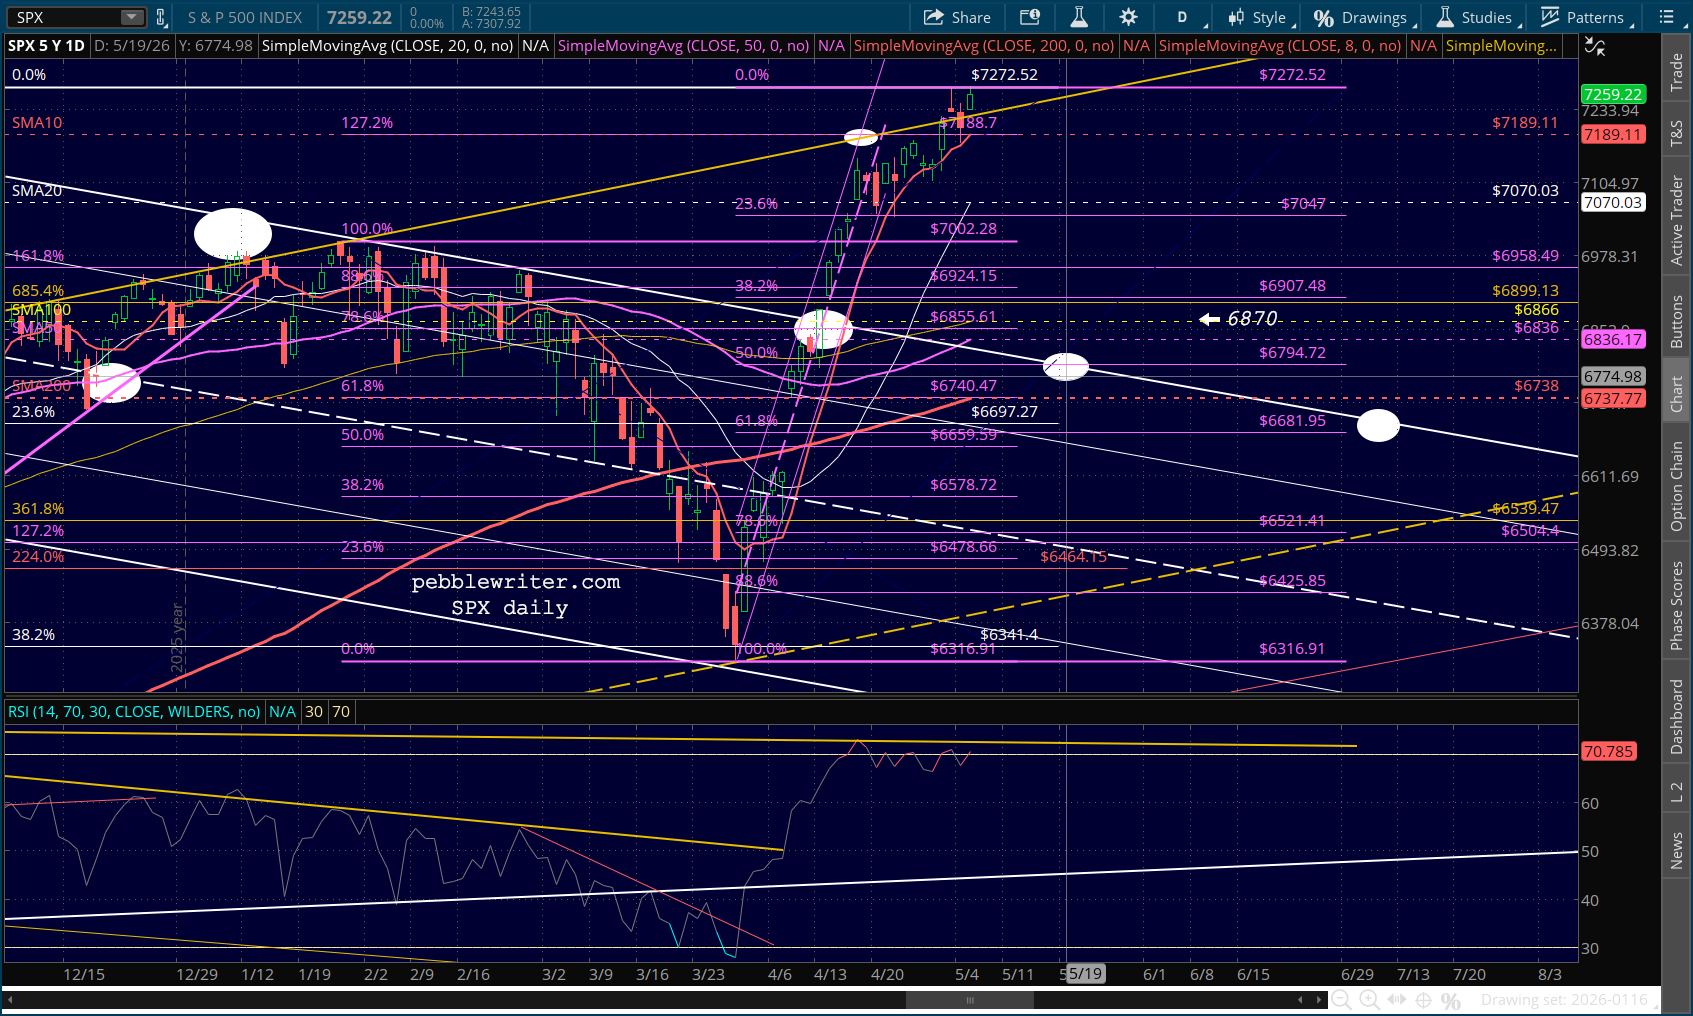
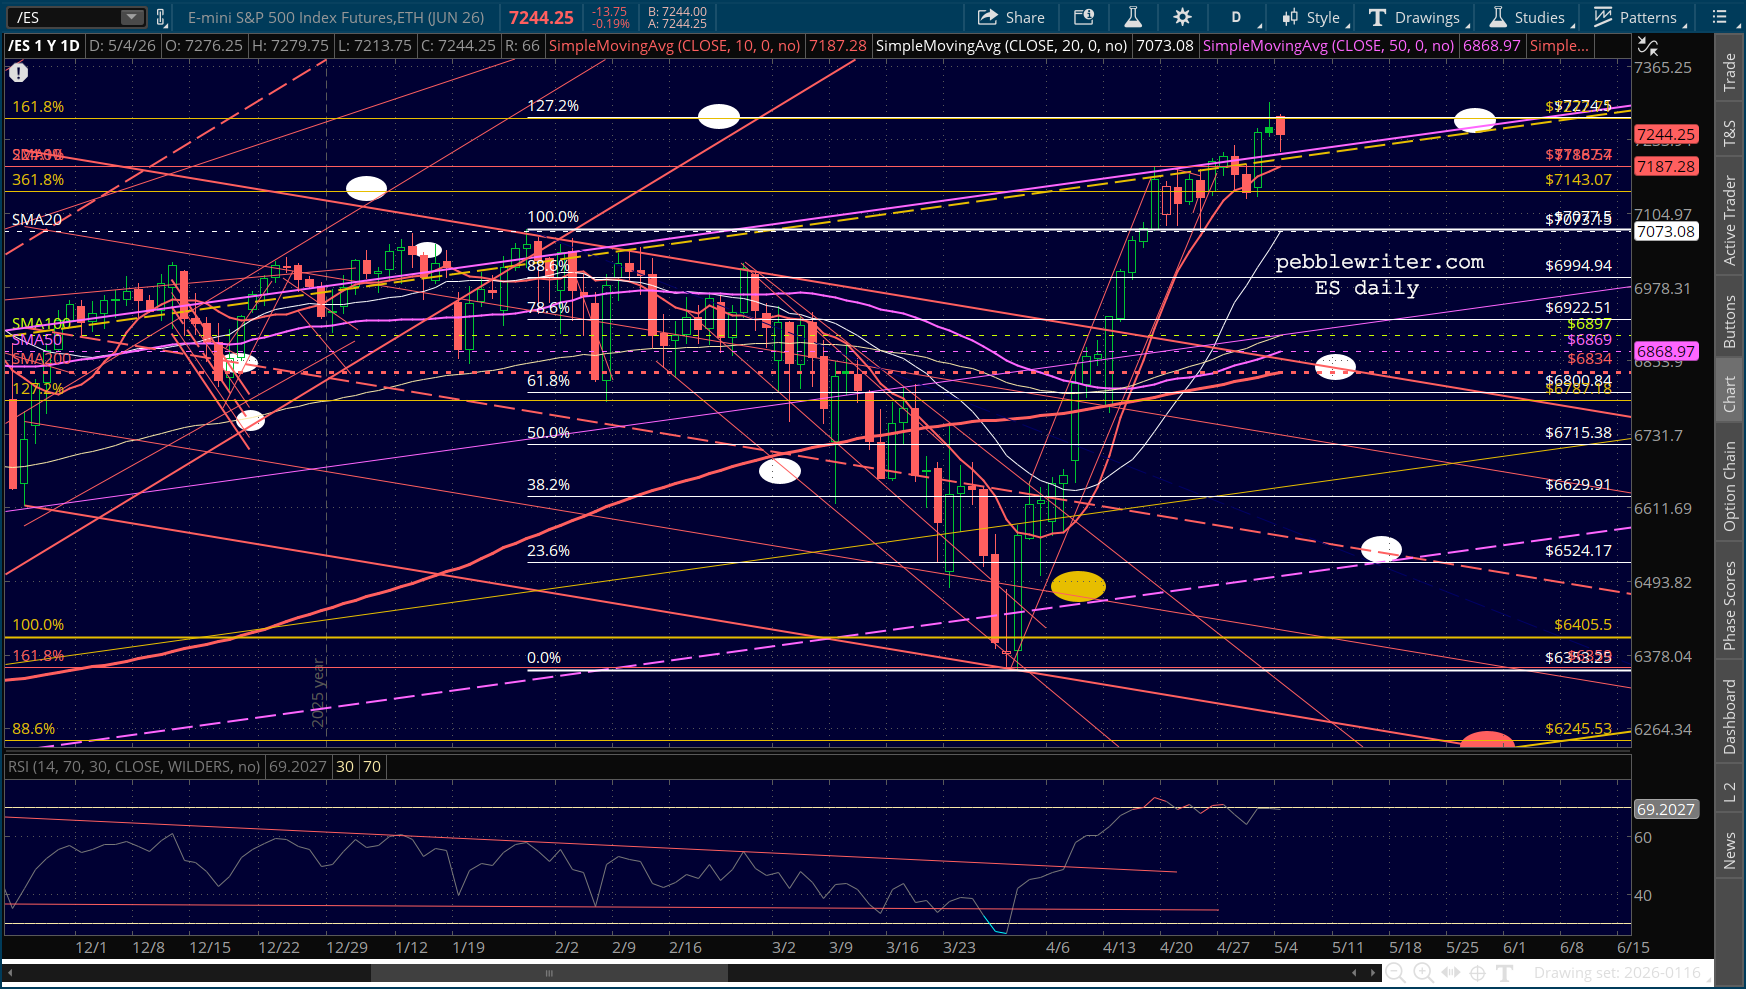
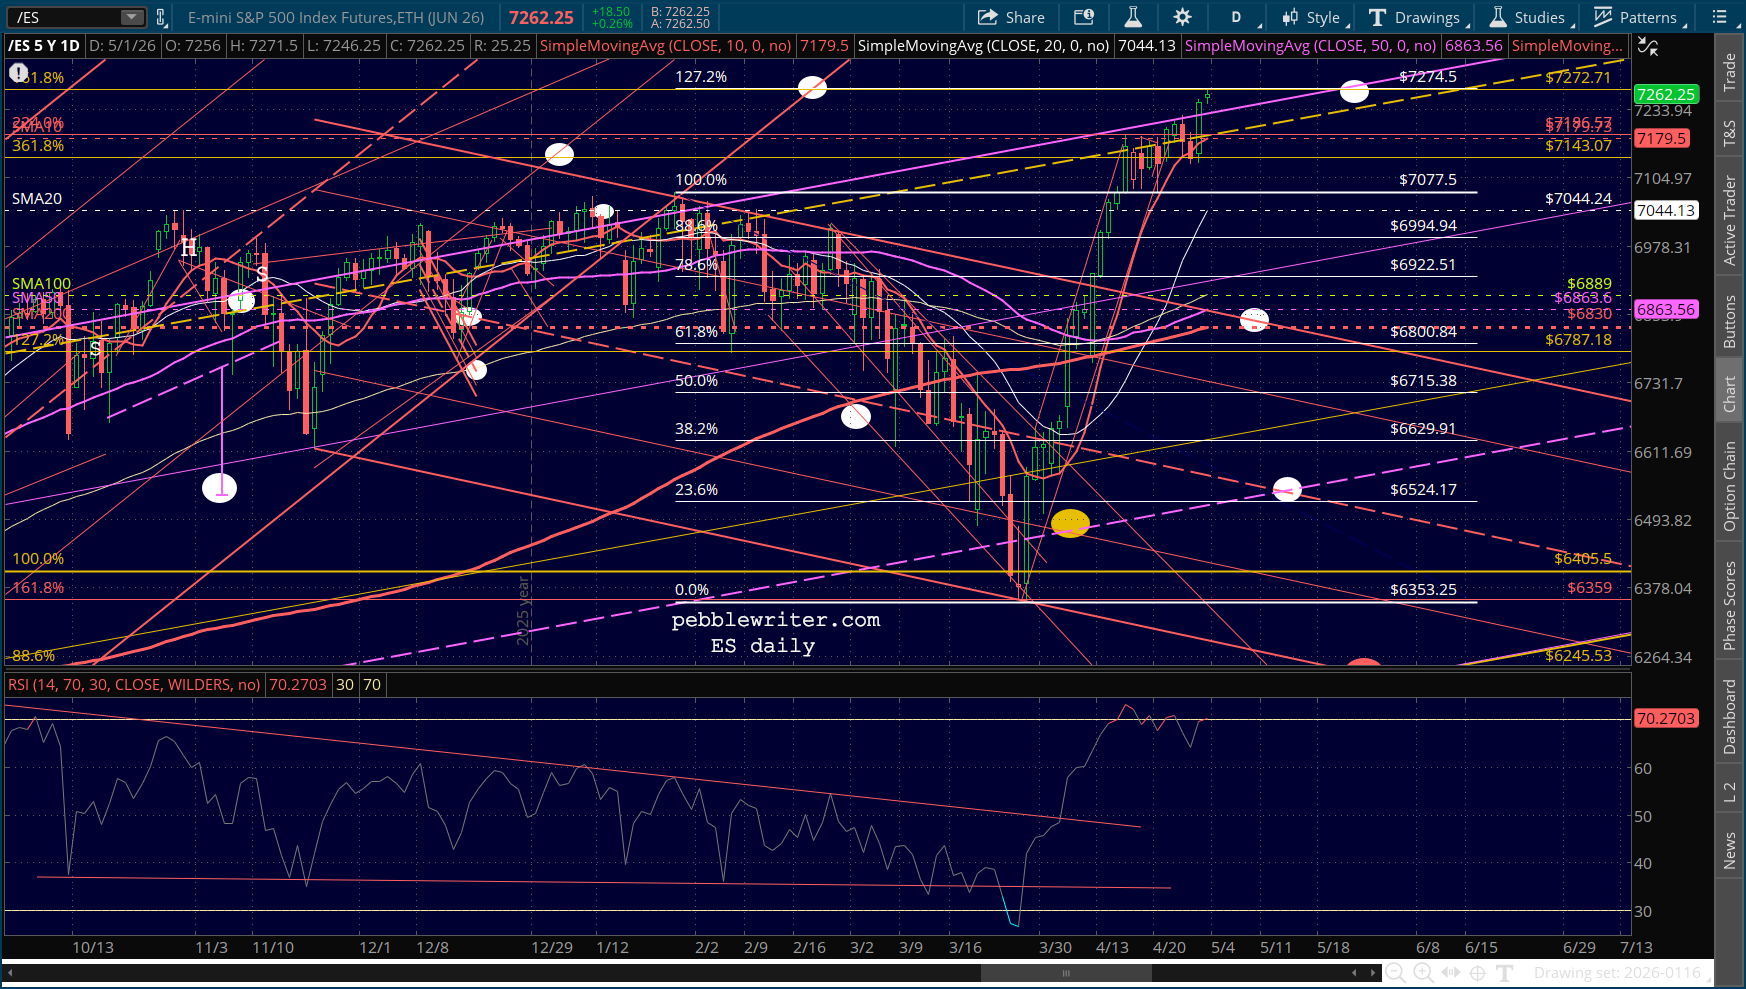
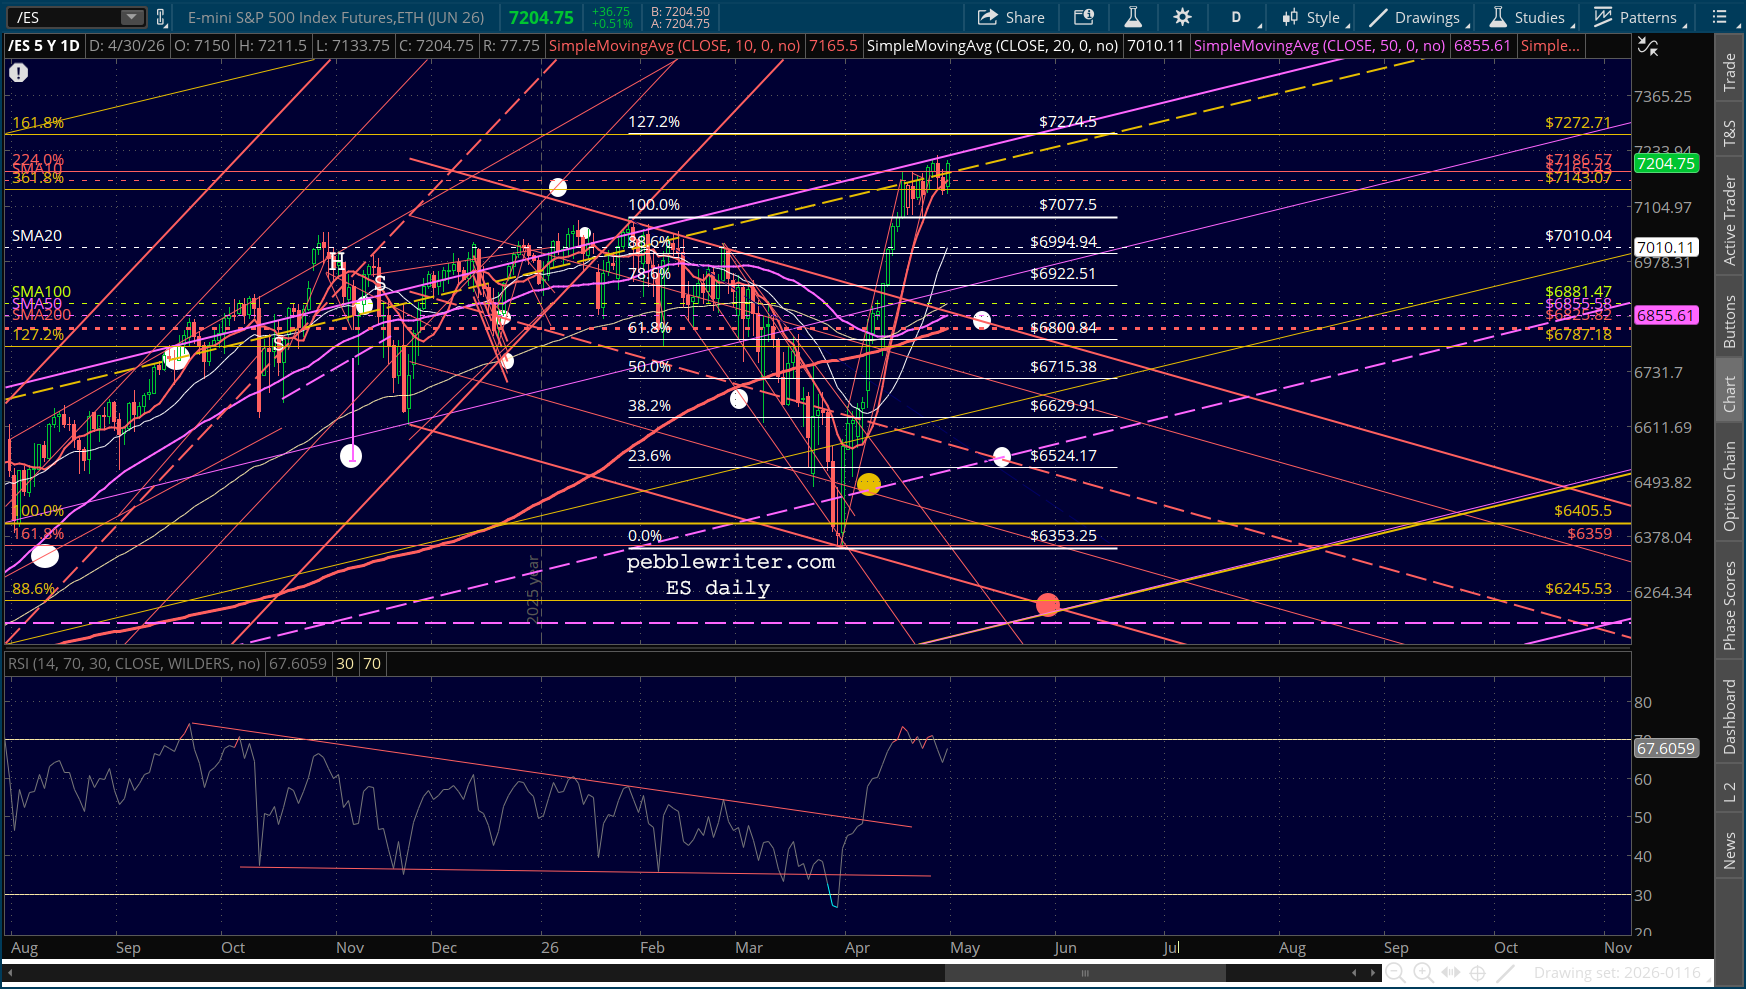
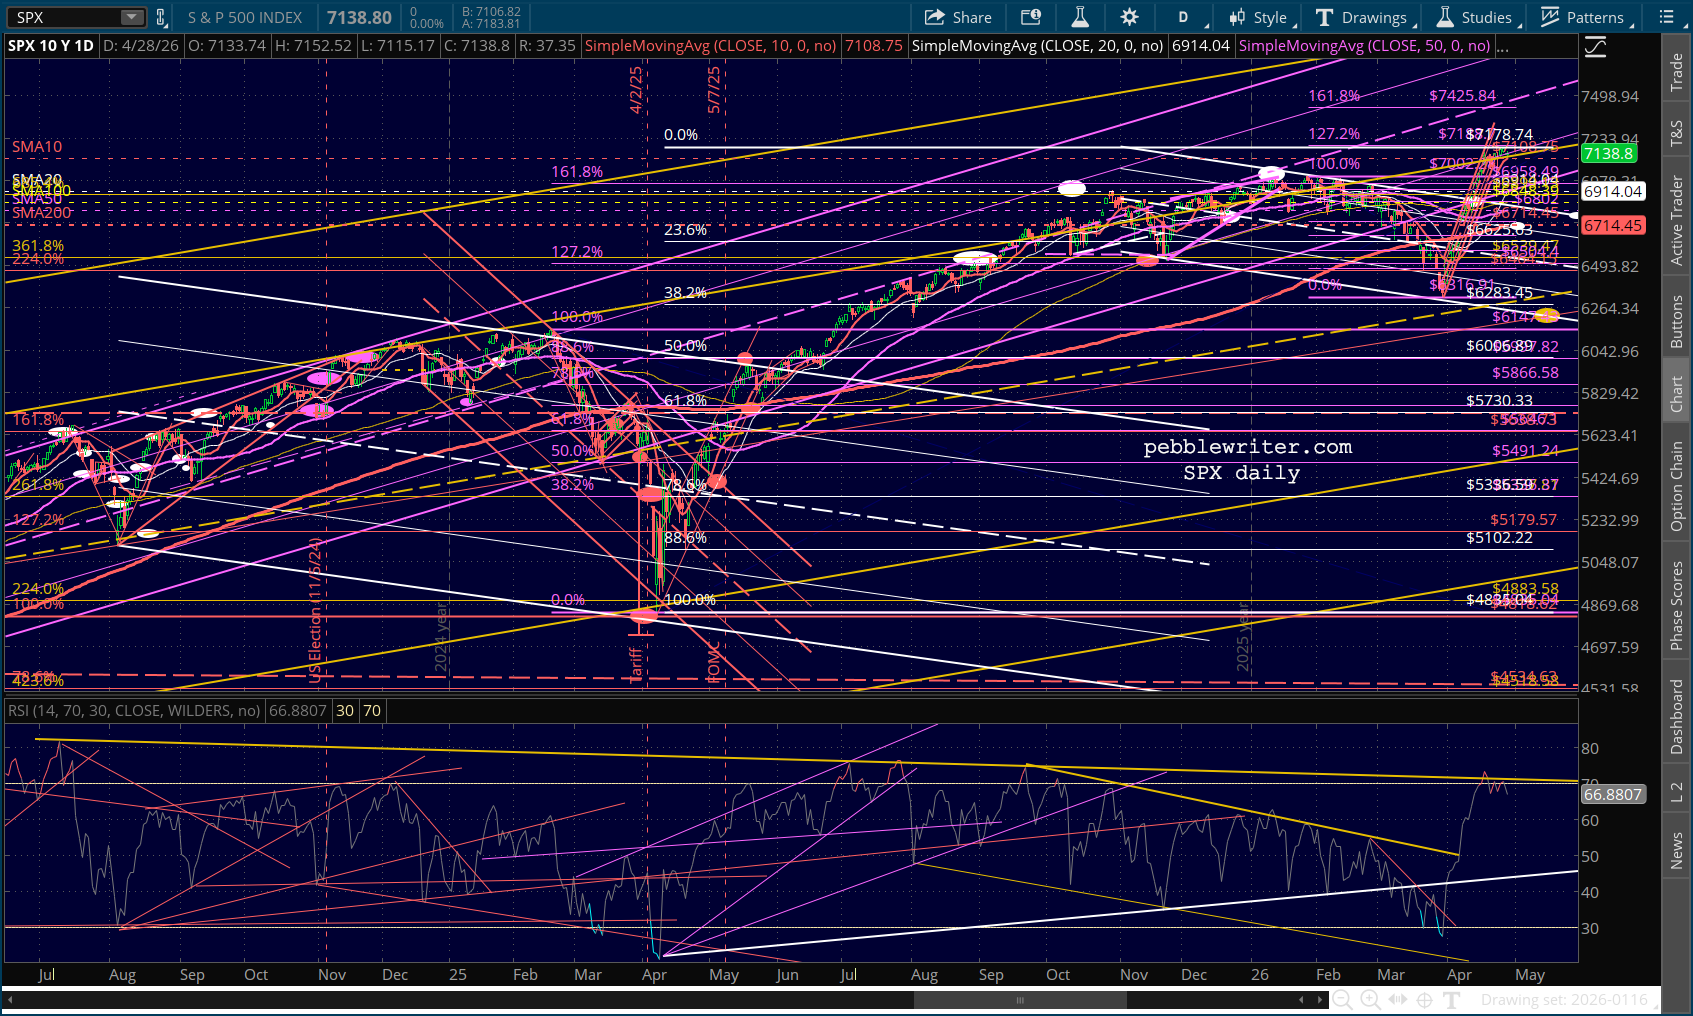
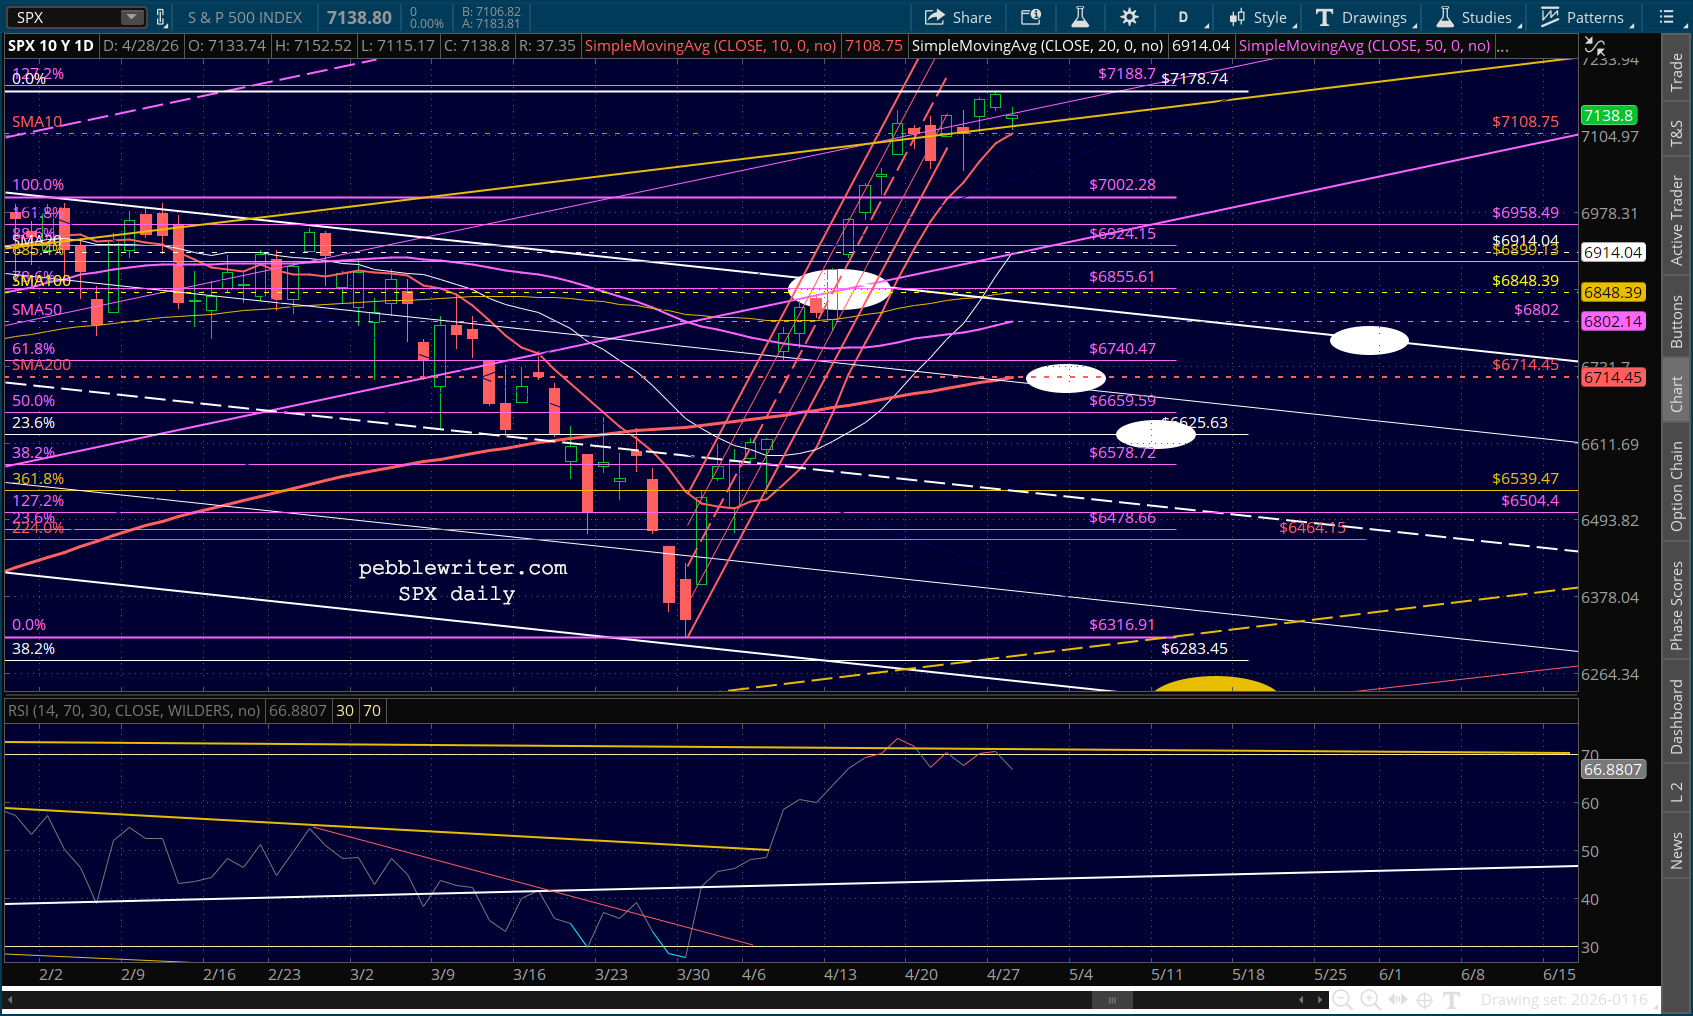
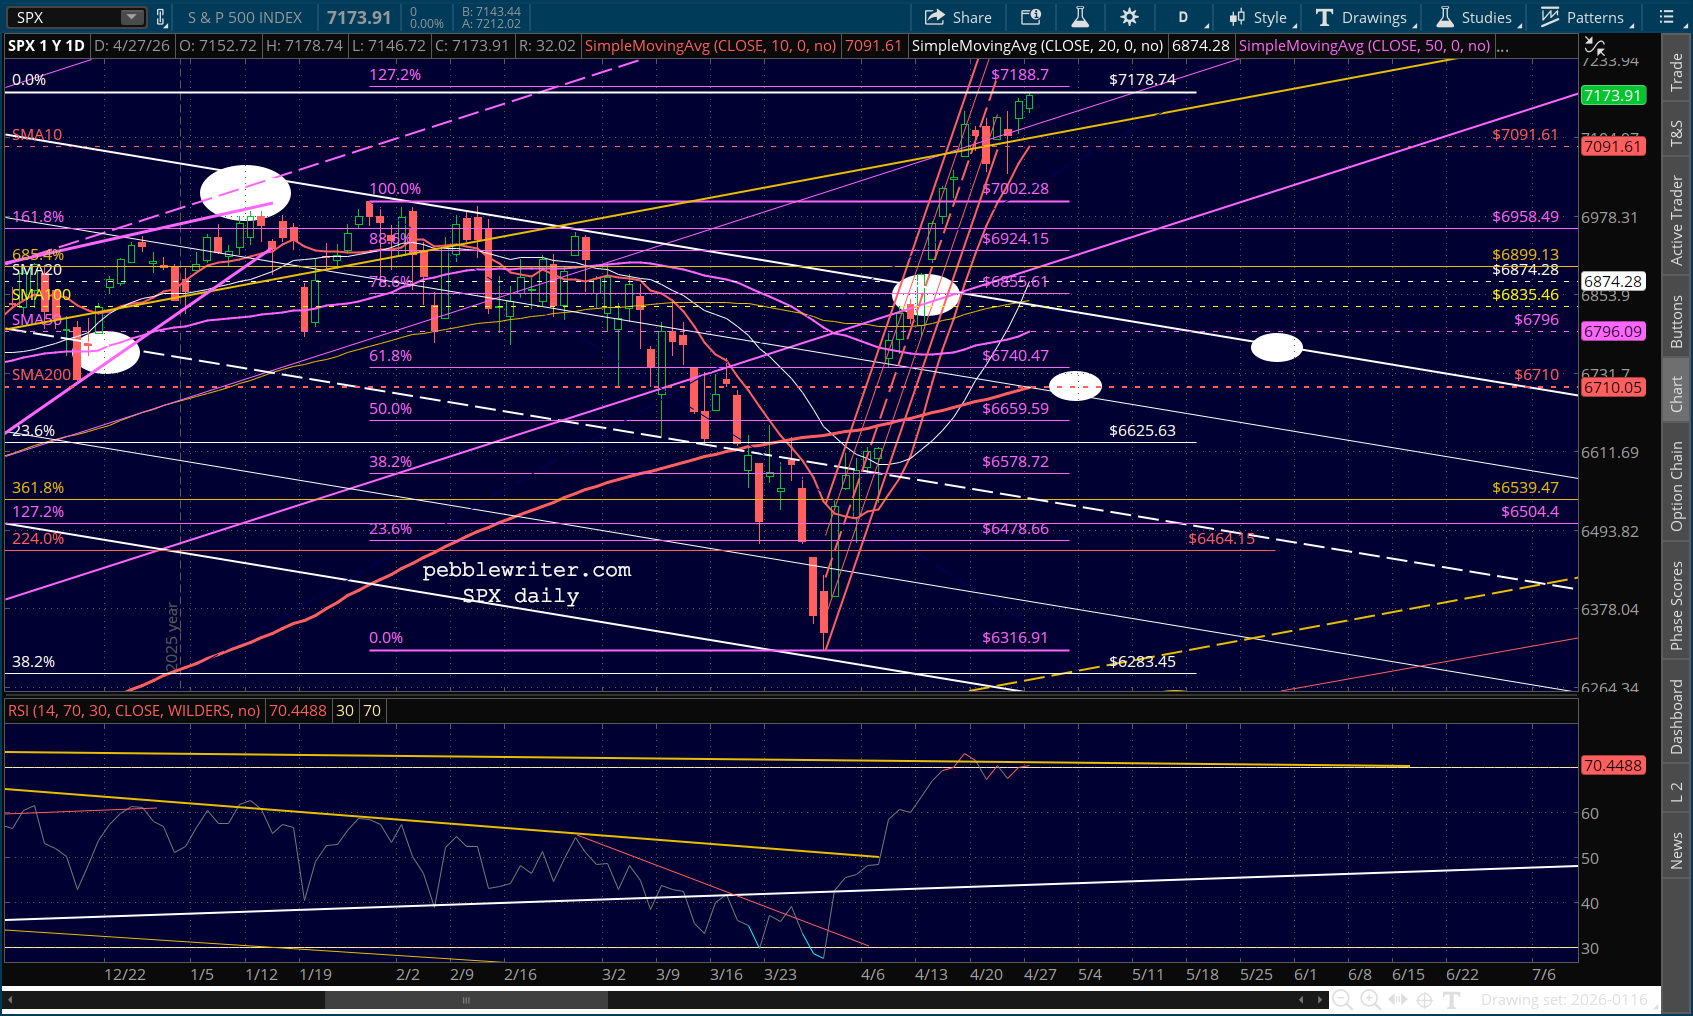
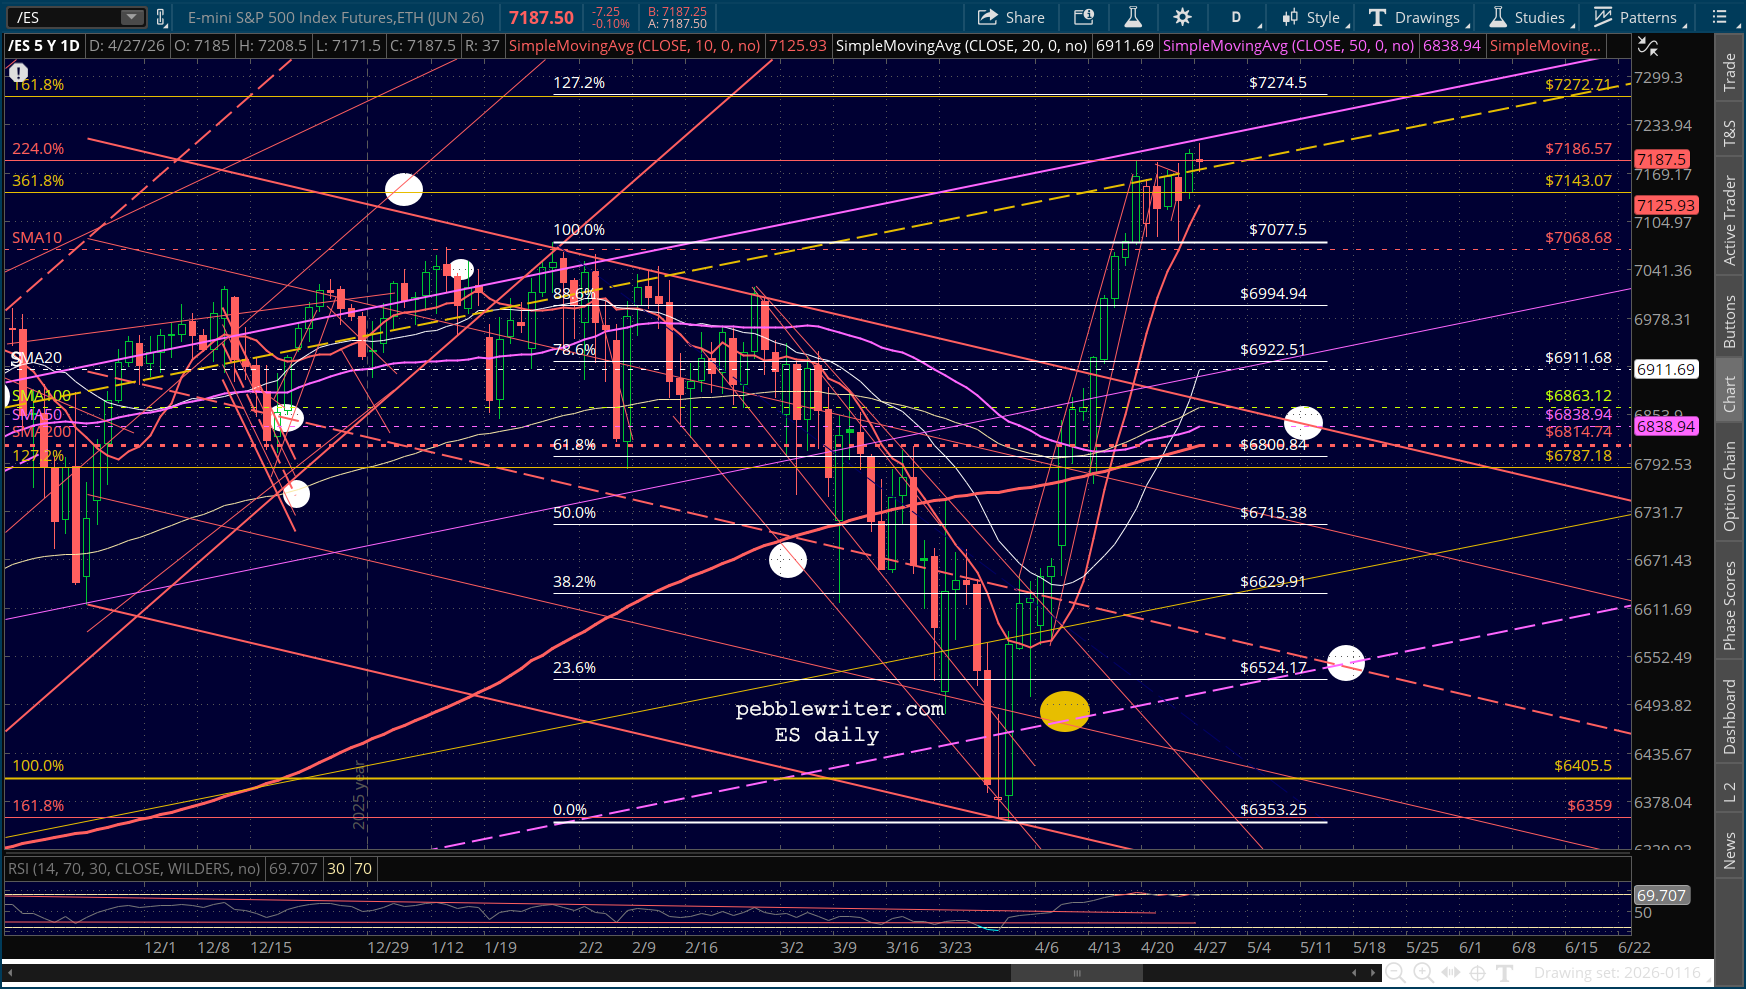
- The March 2026 correction halted at 45,057, only .04% from the December 2024 high at 45,074. [See: It’s TACO Monday.]
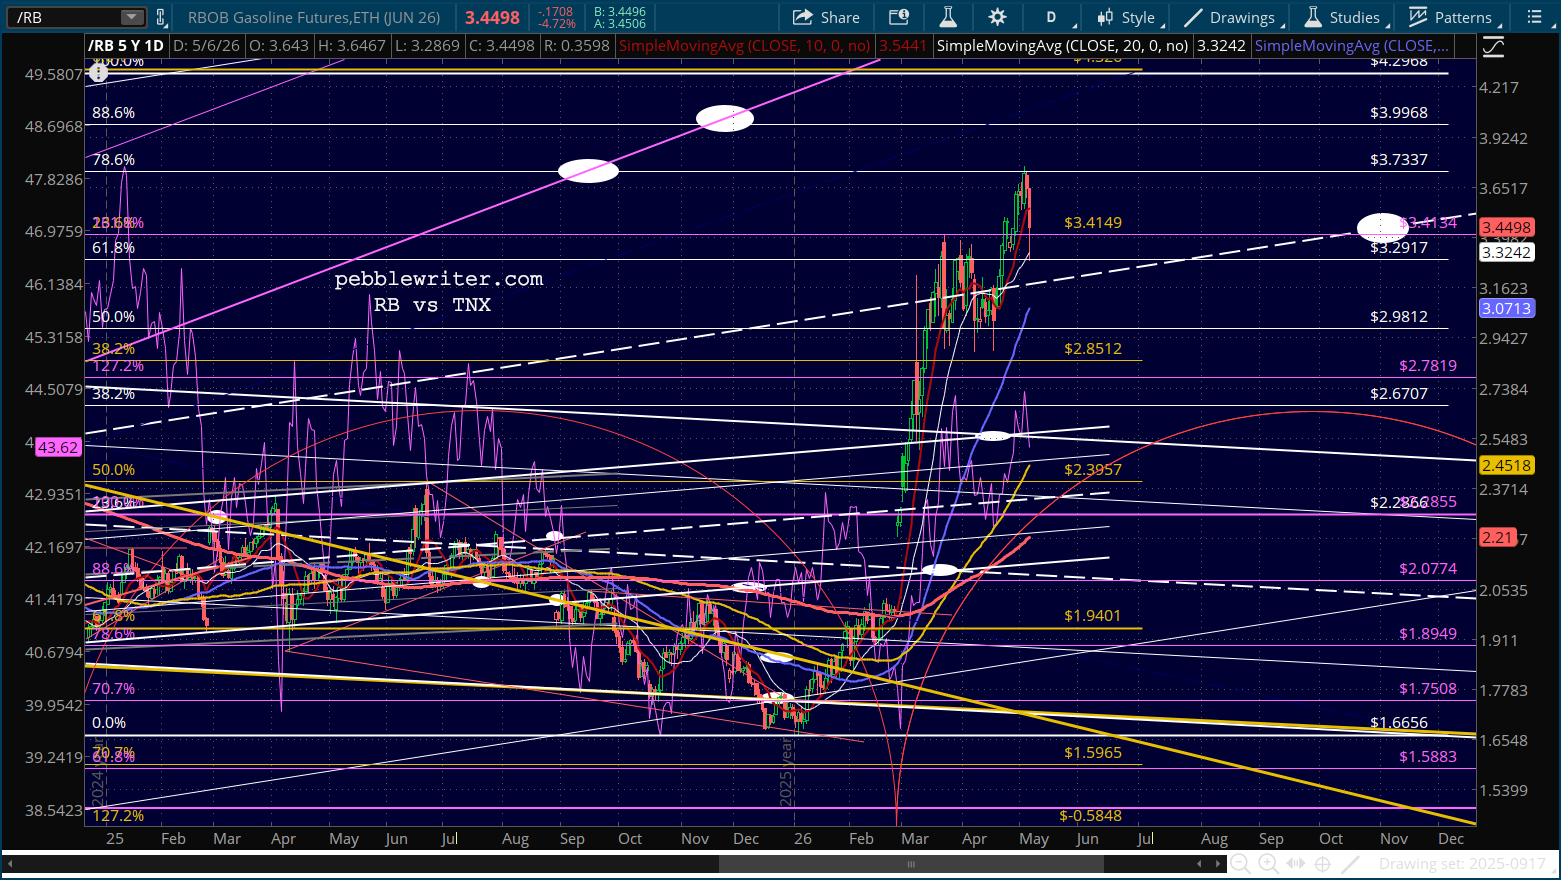
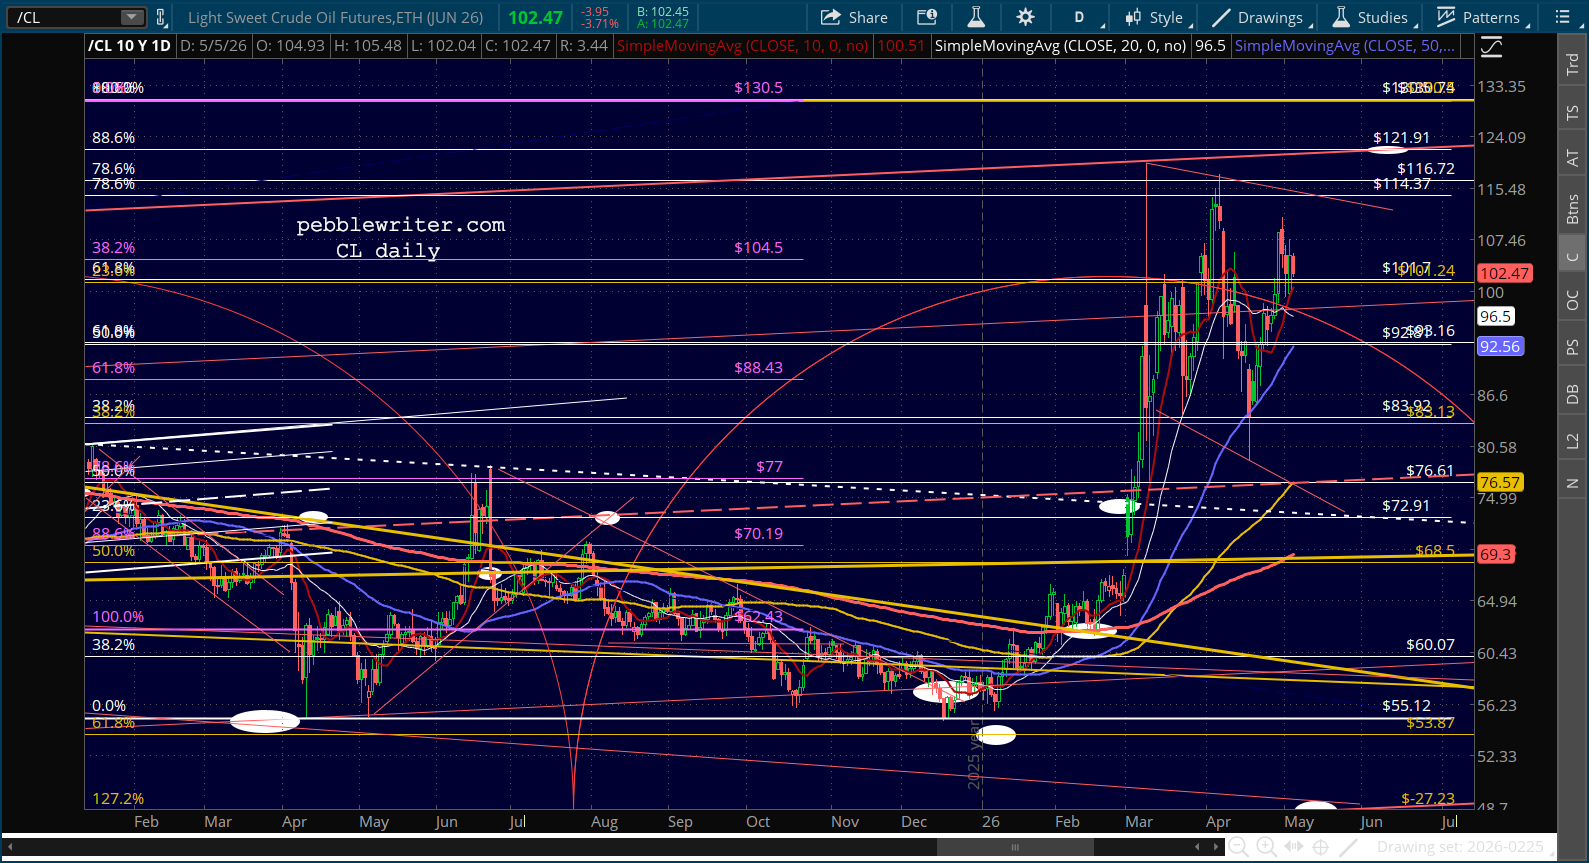
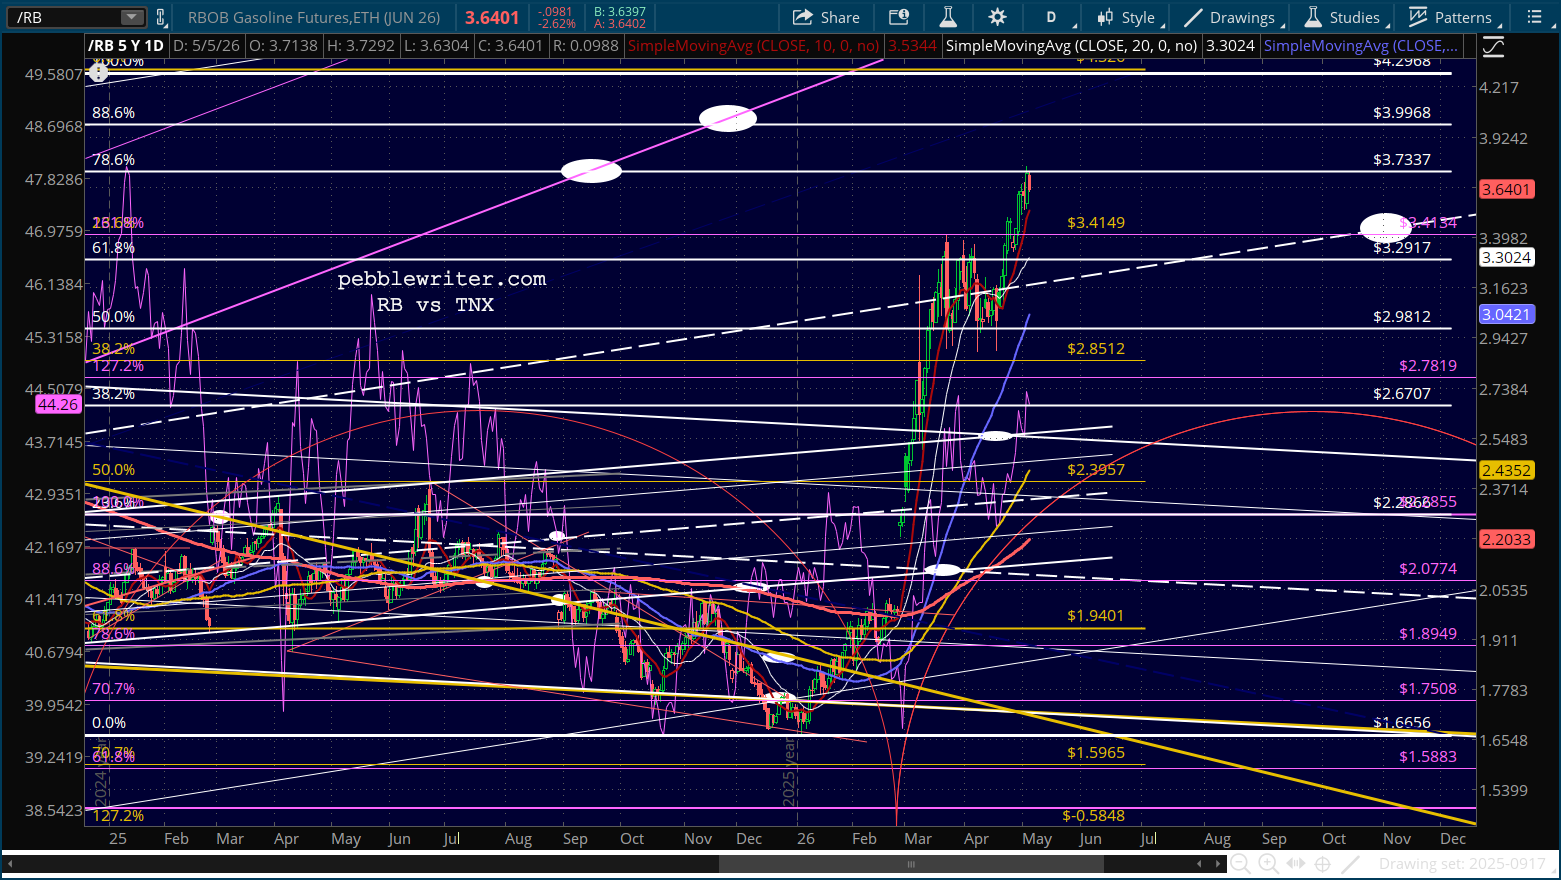
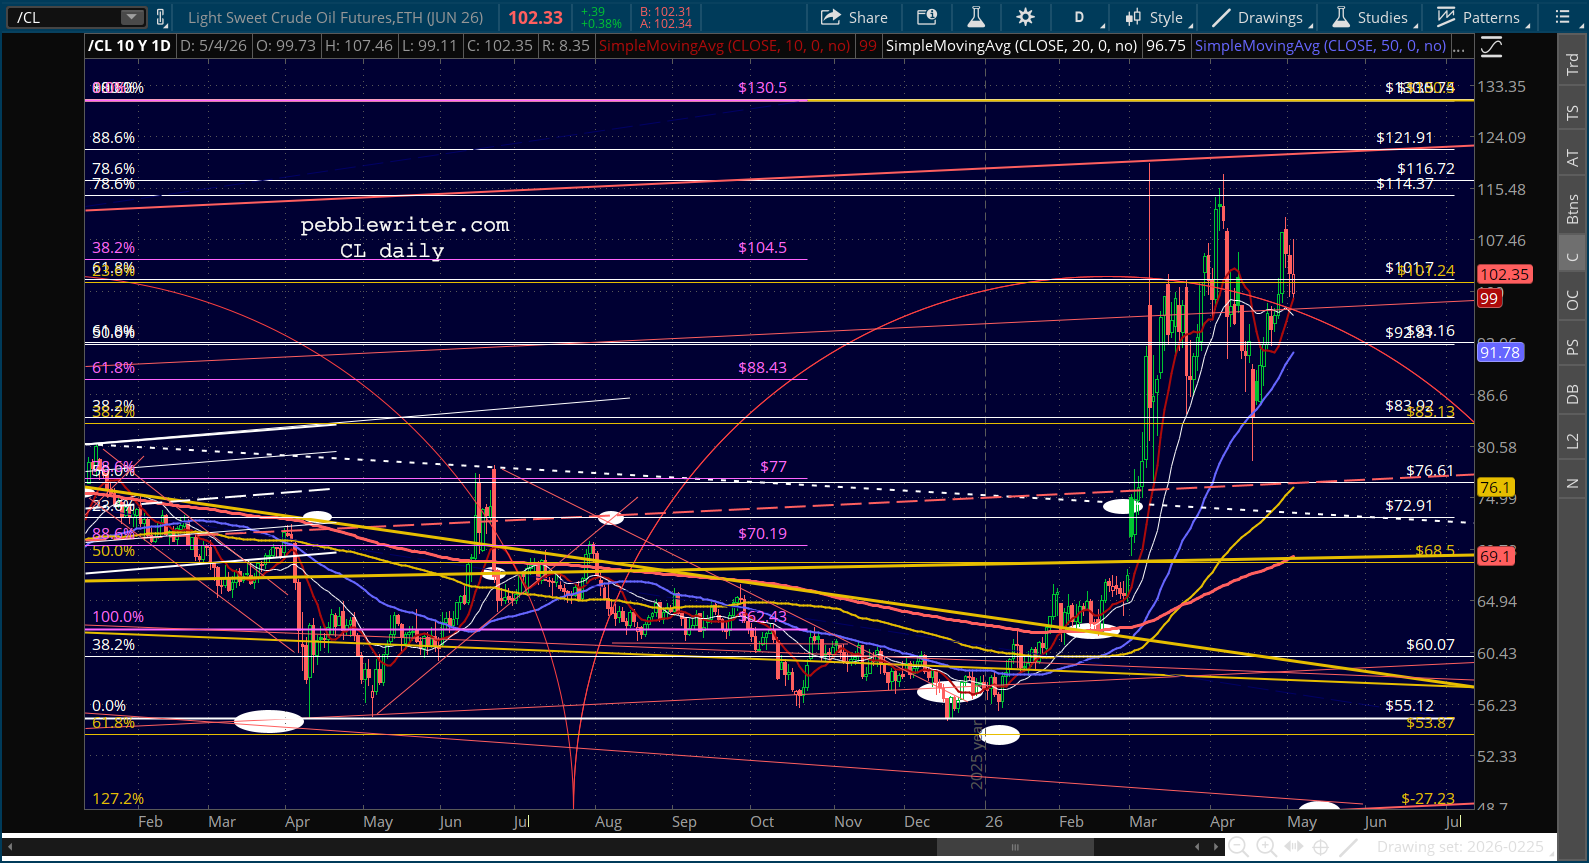
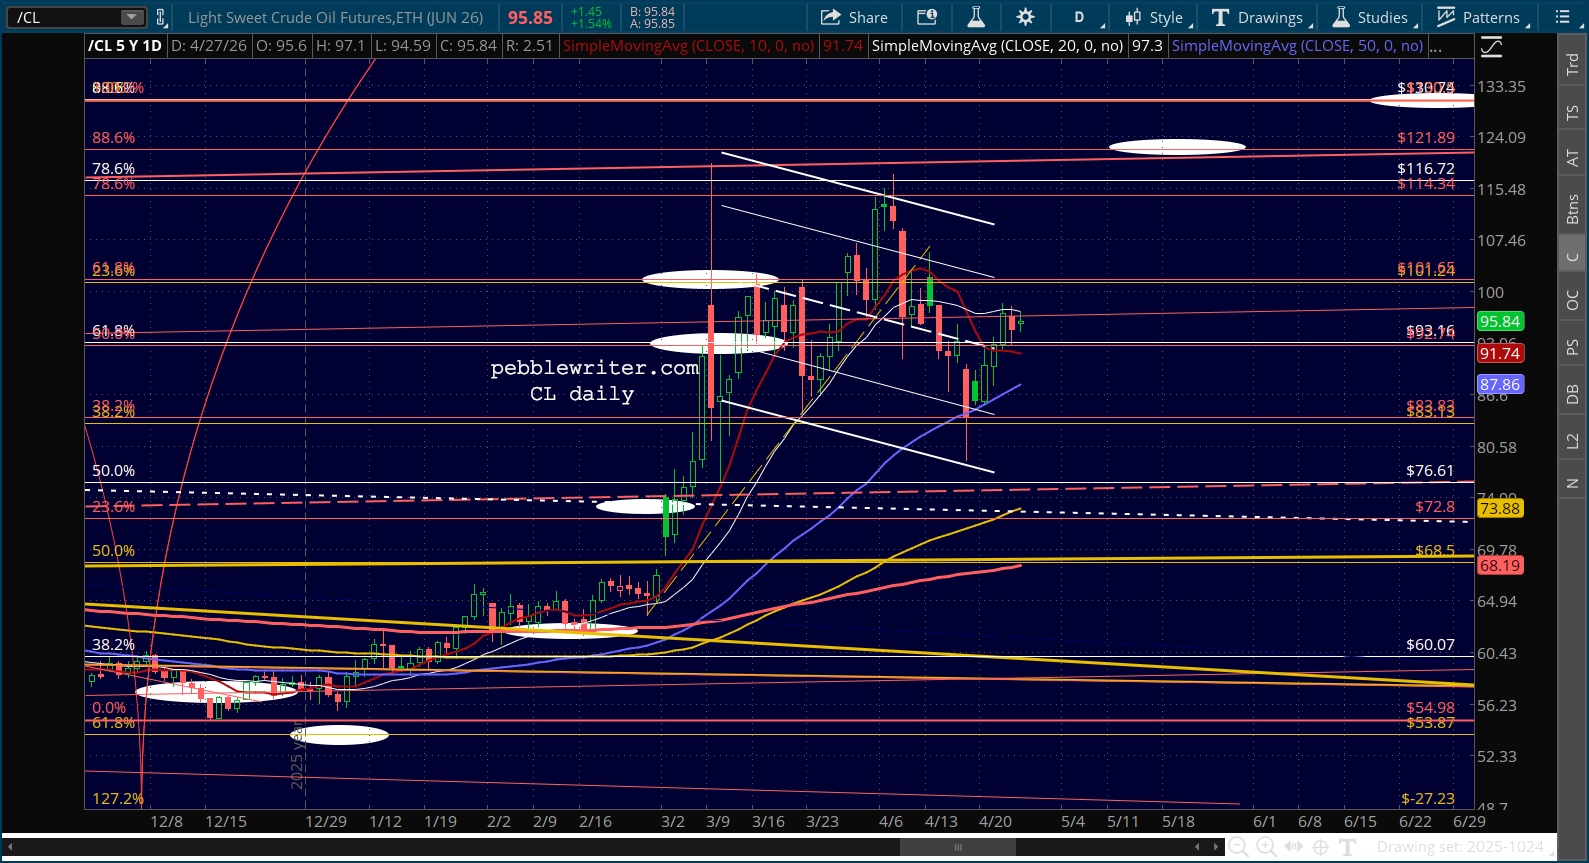
What makes this pattern particularly difficult to attribute to fundamentals is the variety of the macro backdrops. The 2020 reversal occurred during an unprecedented liquidity injection amid a global pandemic. The 2022 reversal happened mid-way through the most aggressive Fed hiking cycle in forty years, with inflation at 9%. The 2025 reversal followed a surprise tariff shock. The 2026 reversal coincided with soaring oil prices during the war with Iran.
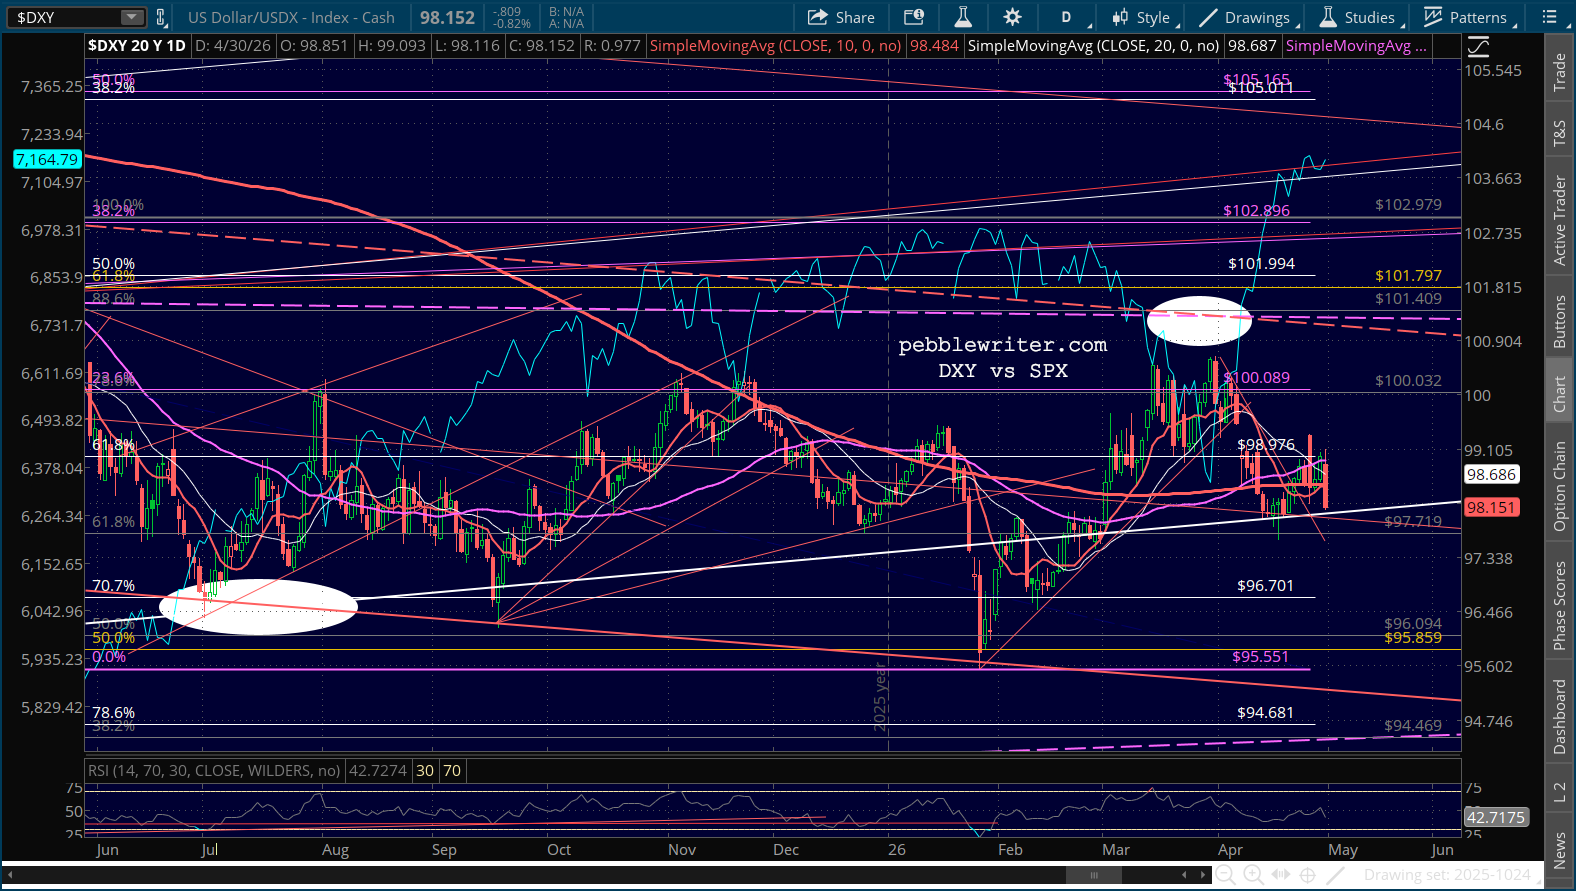
If fundamentals were the governing force, the reversal levels should be scattered across a wide range of prices reflecting differing earnings expectations, discount rates, and risk premia. Instead, they cluster precisely at prior structural highs — technical levels that have no inherent fundamental significance.
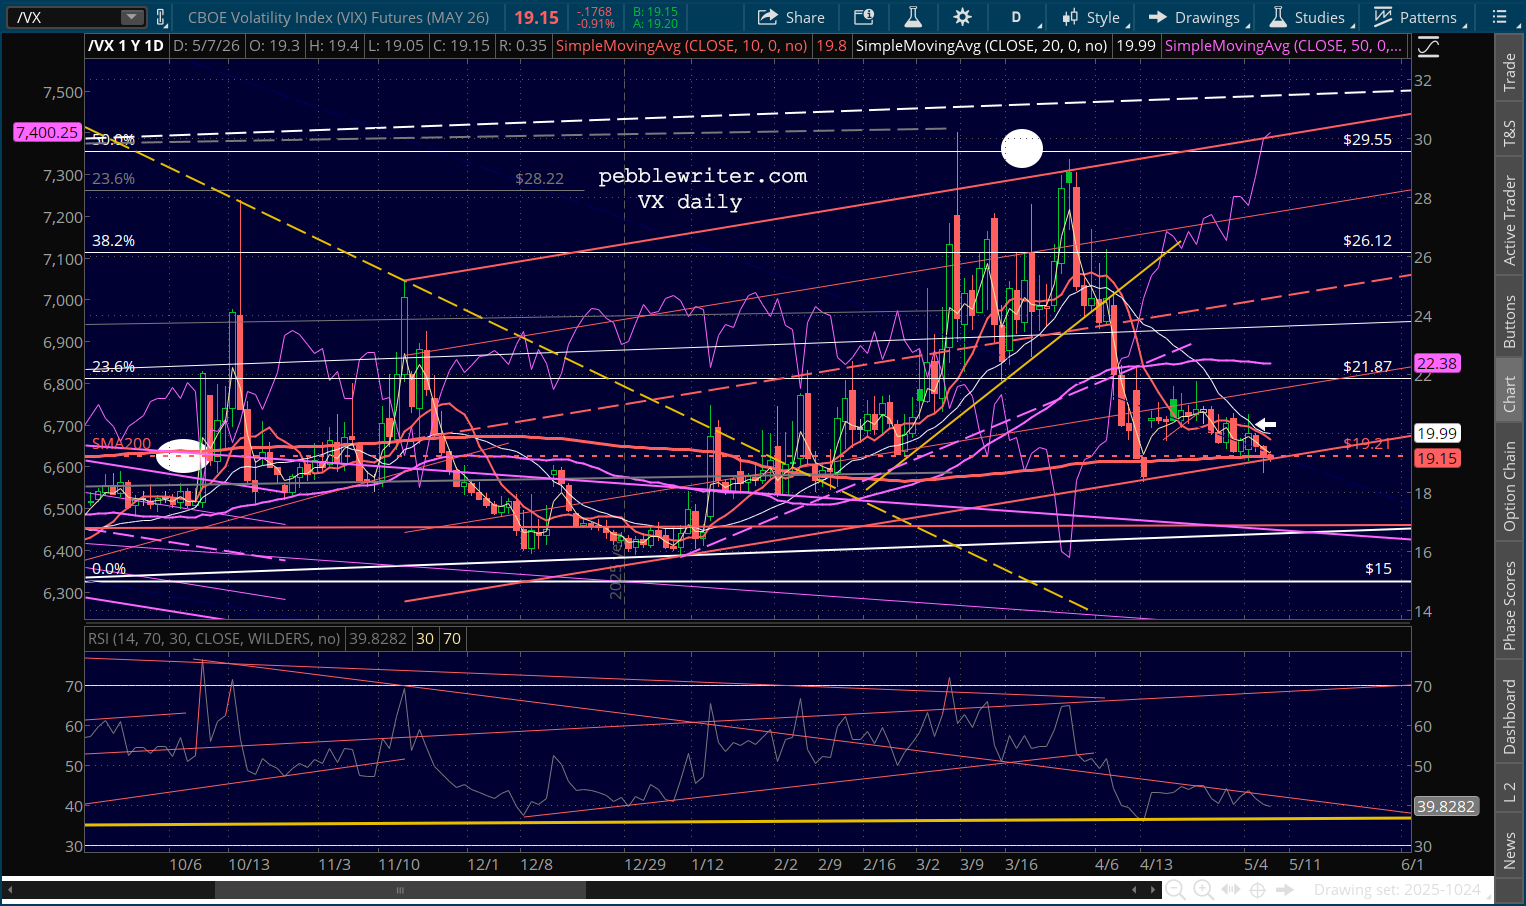
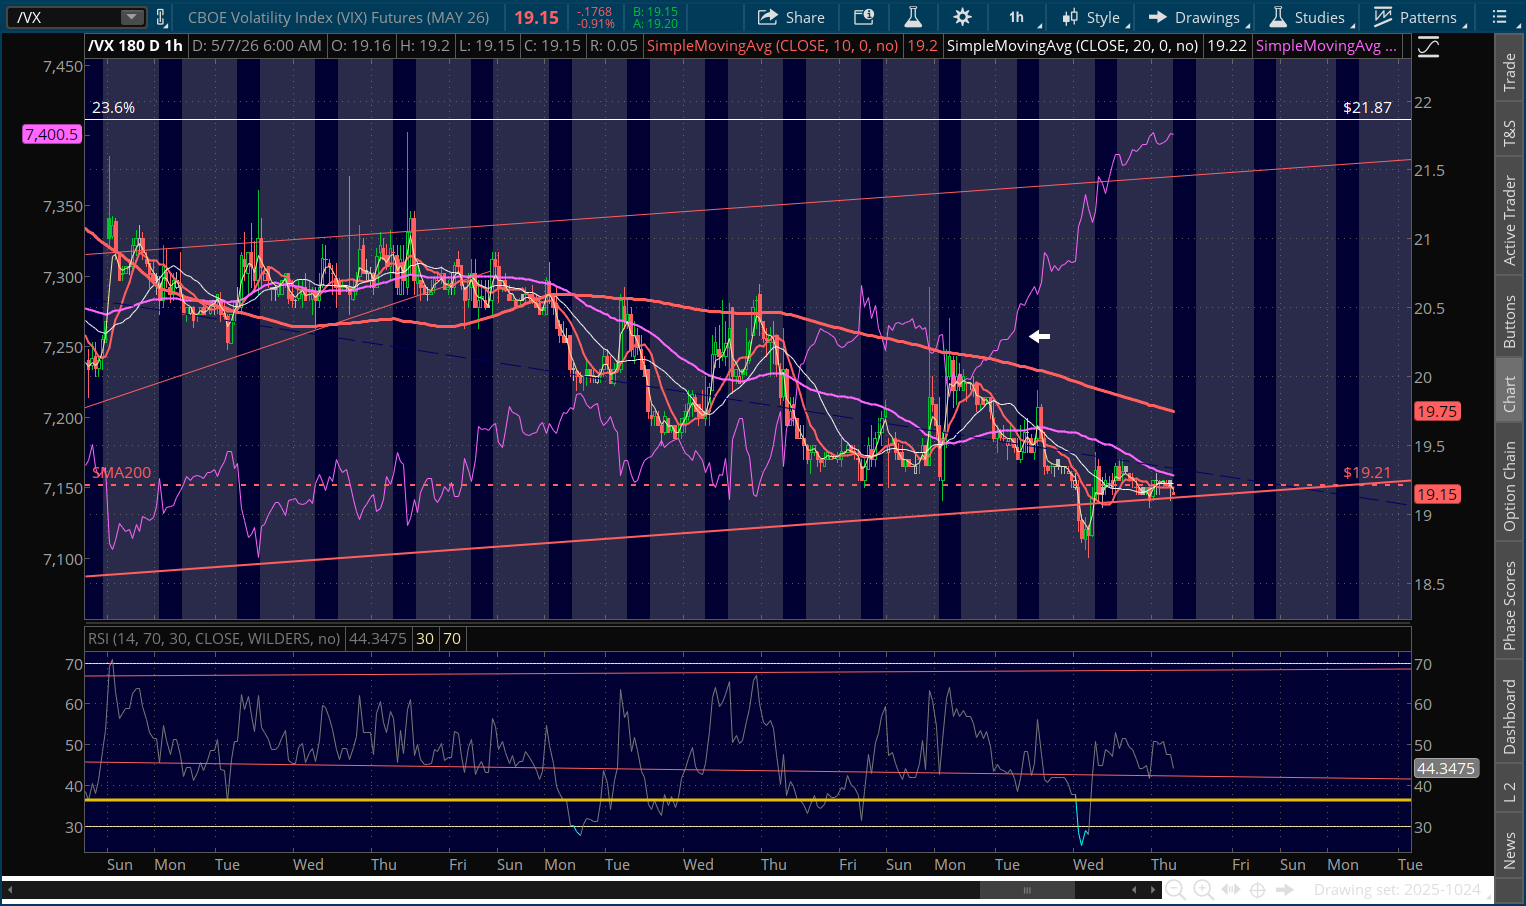
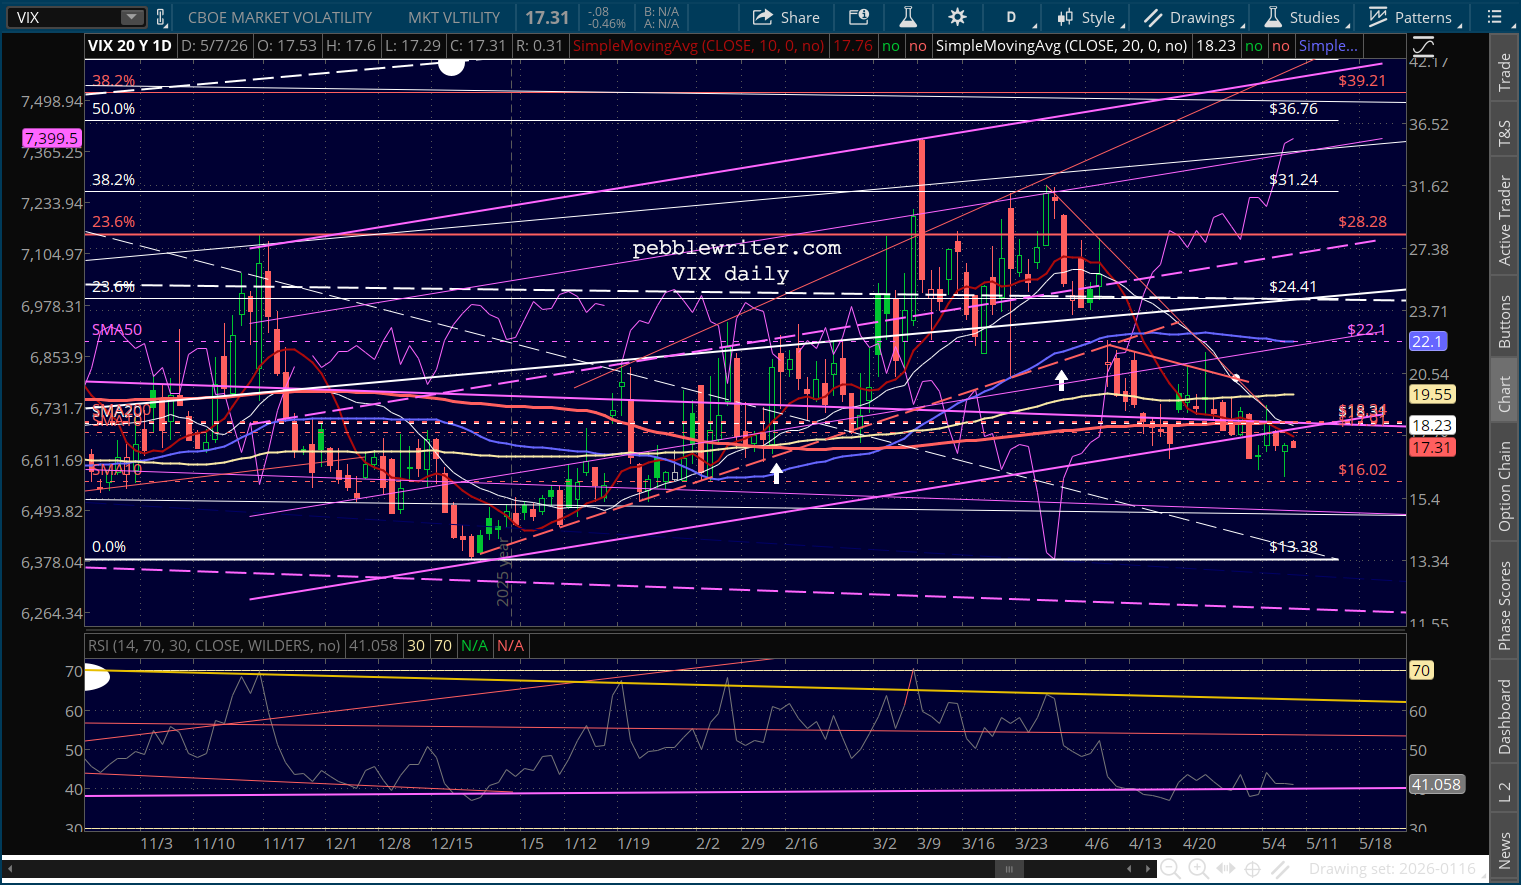
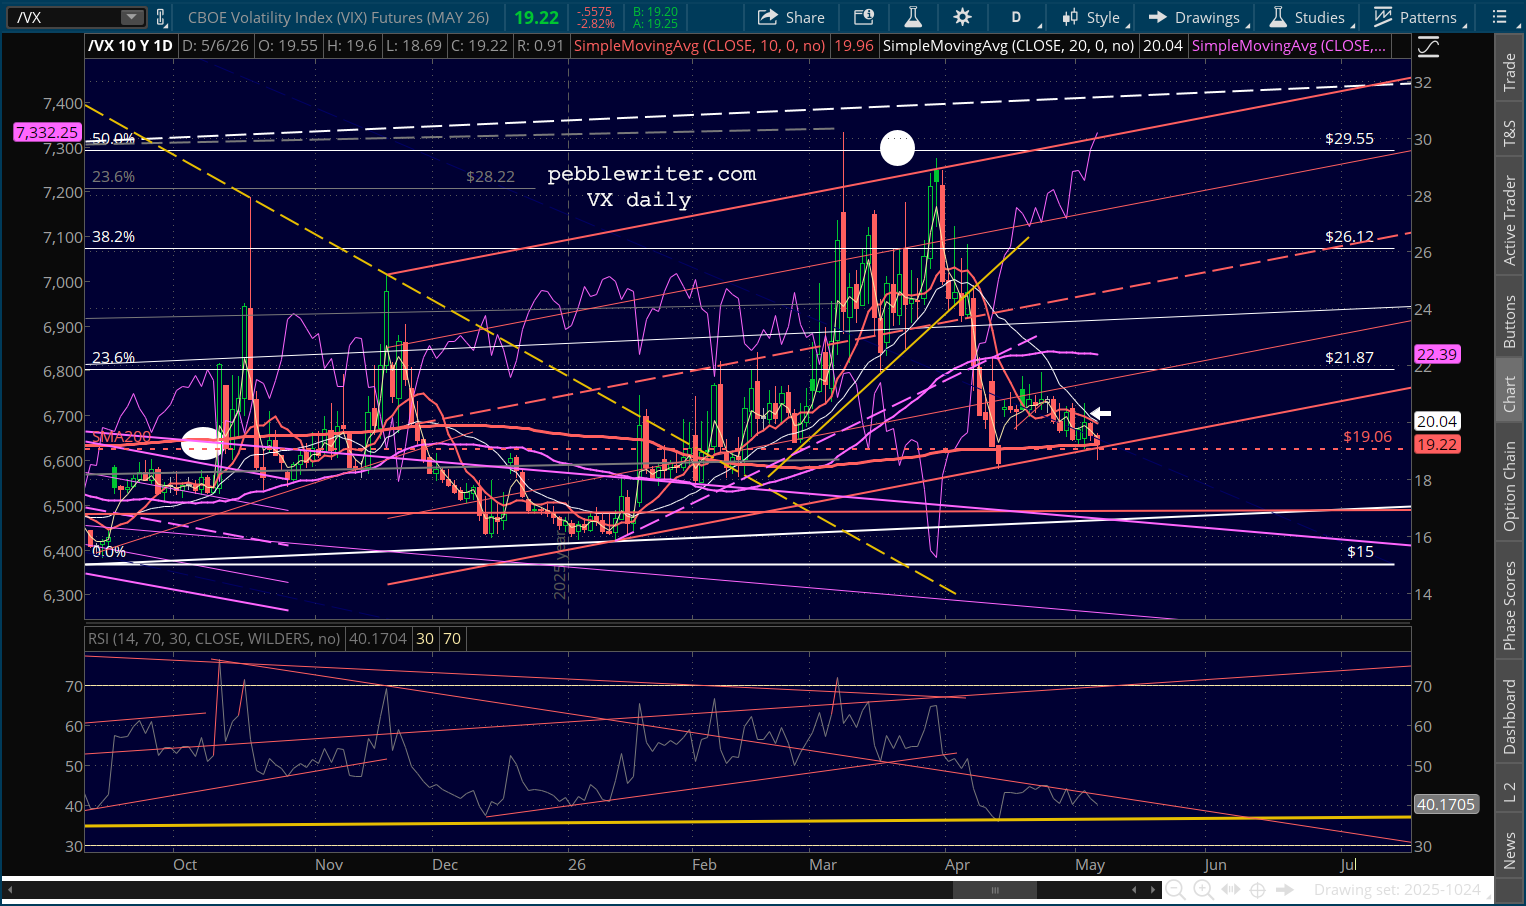
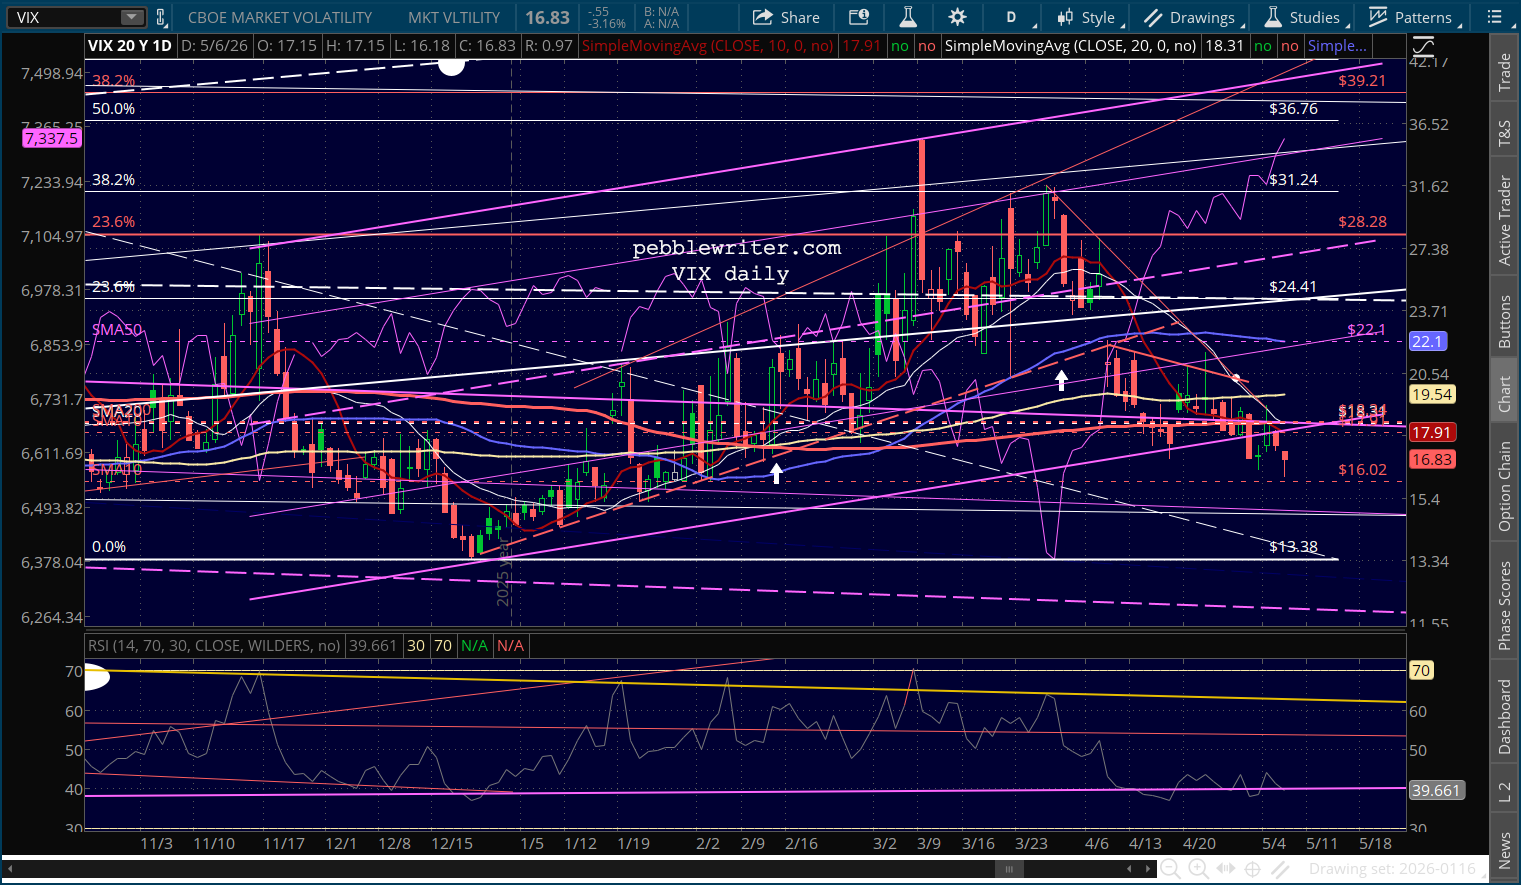
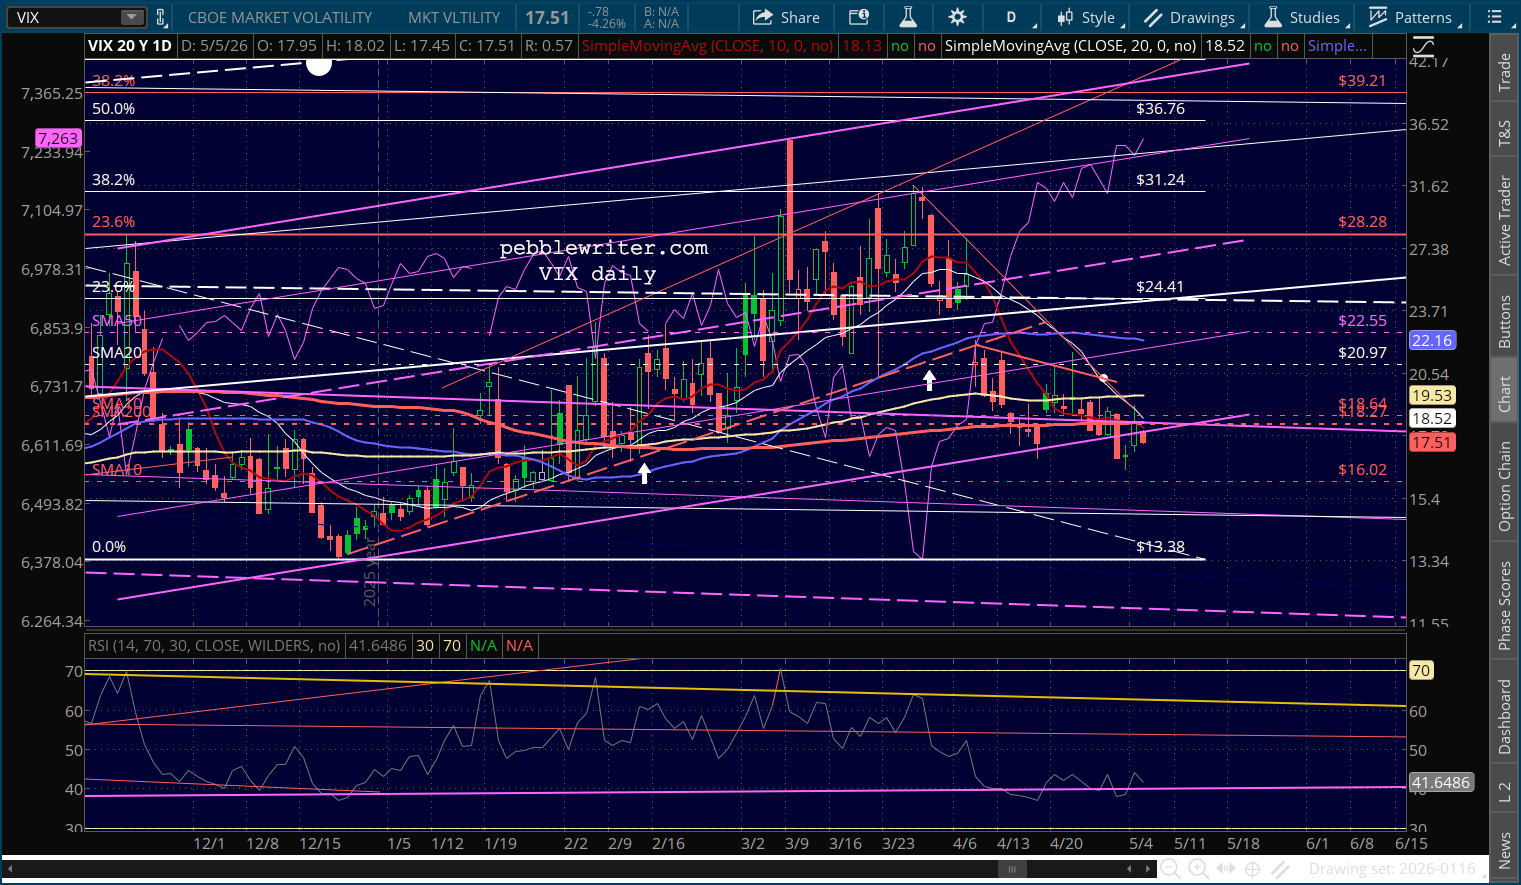
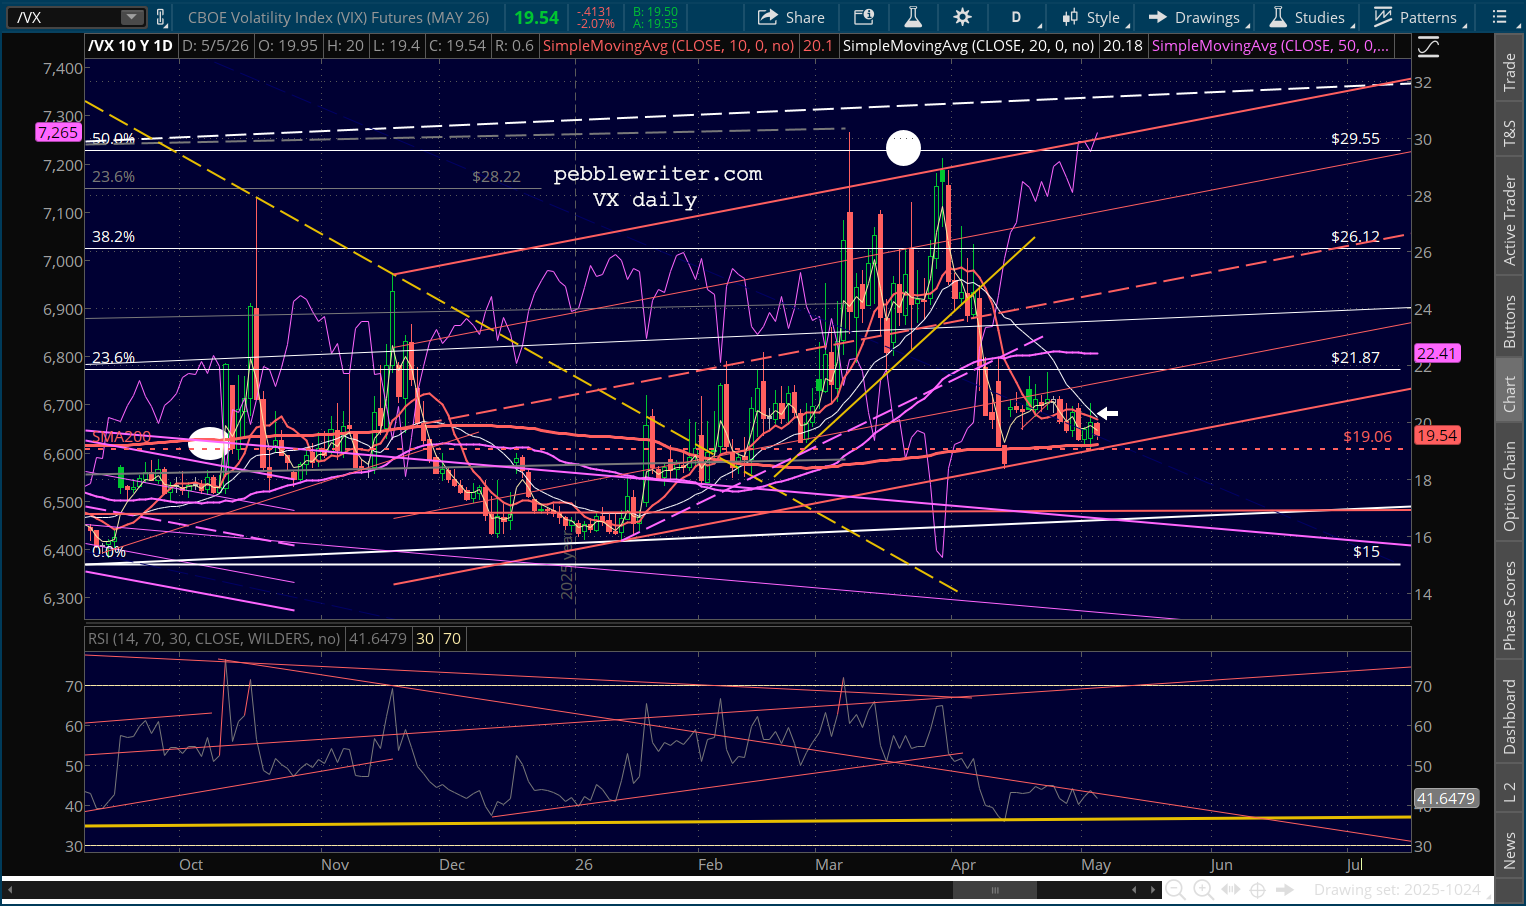
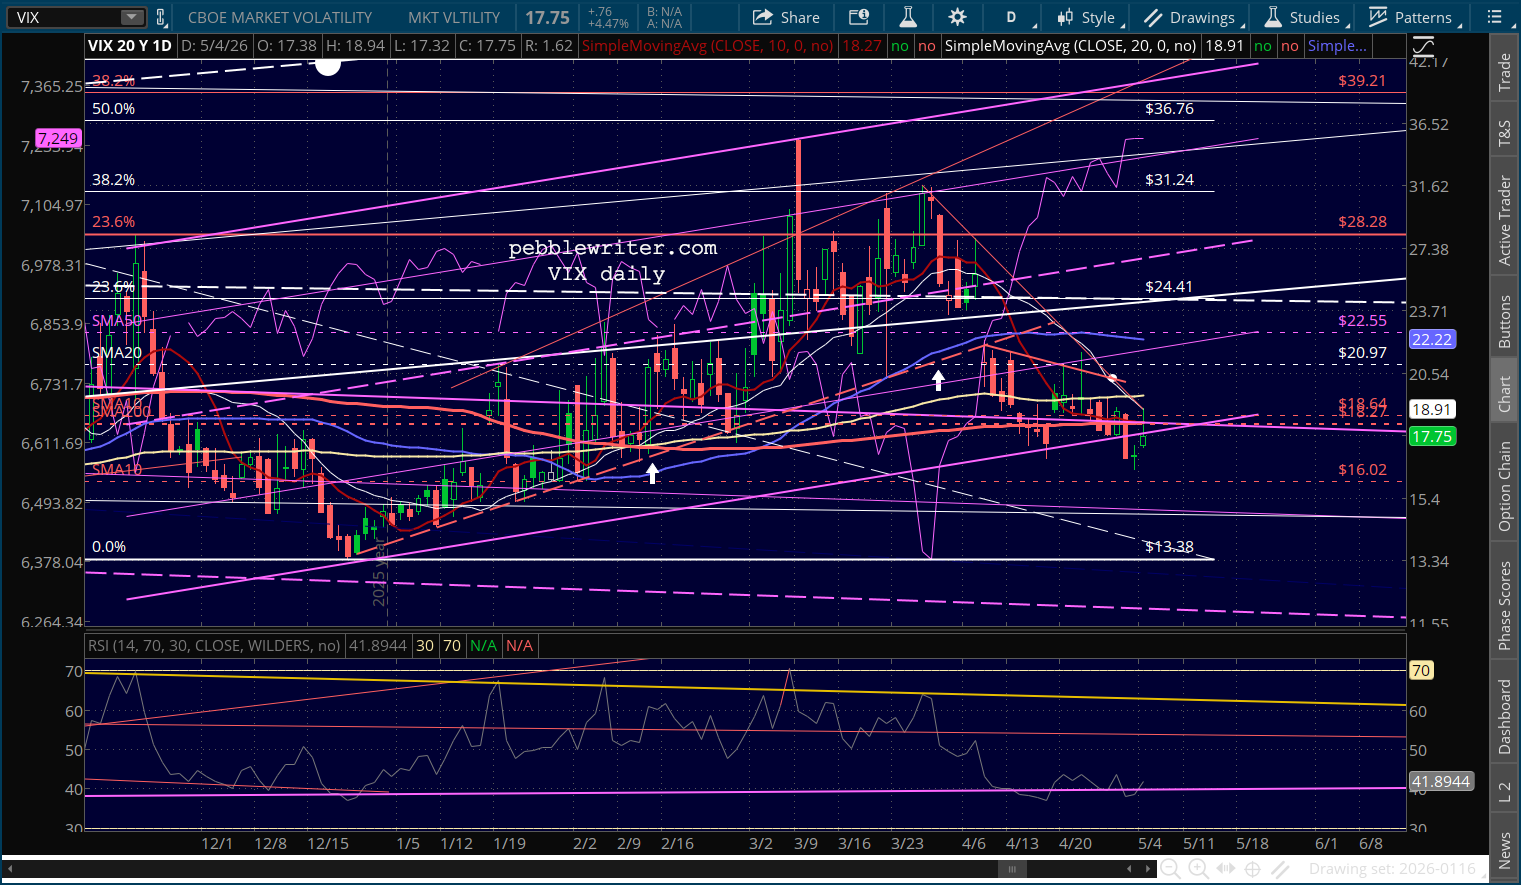
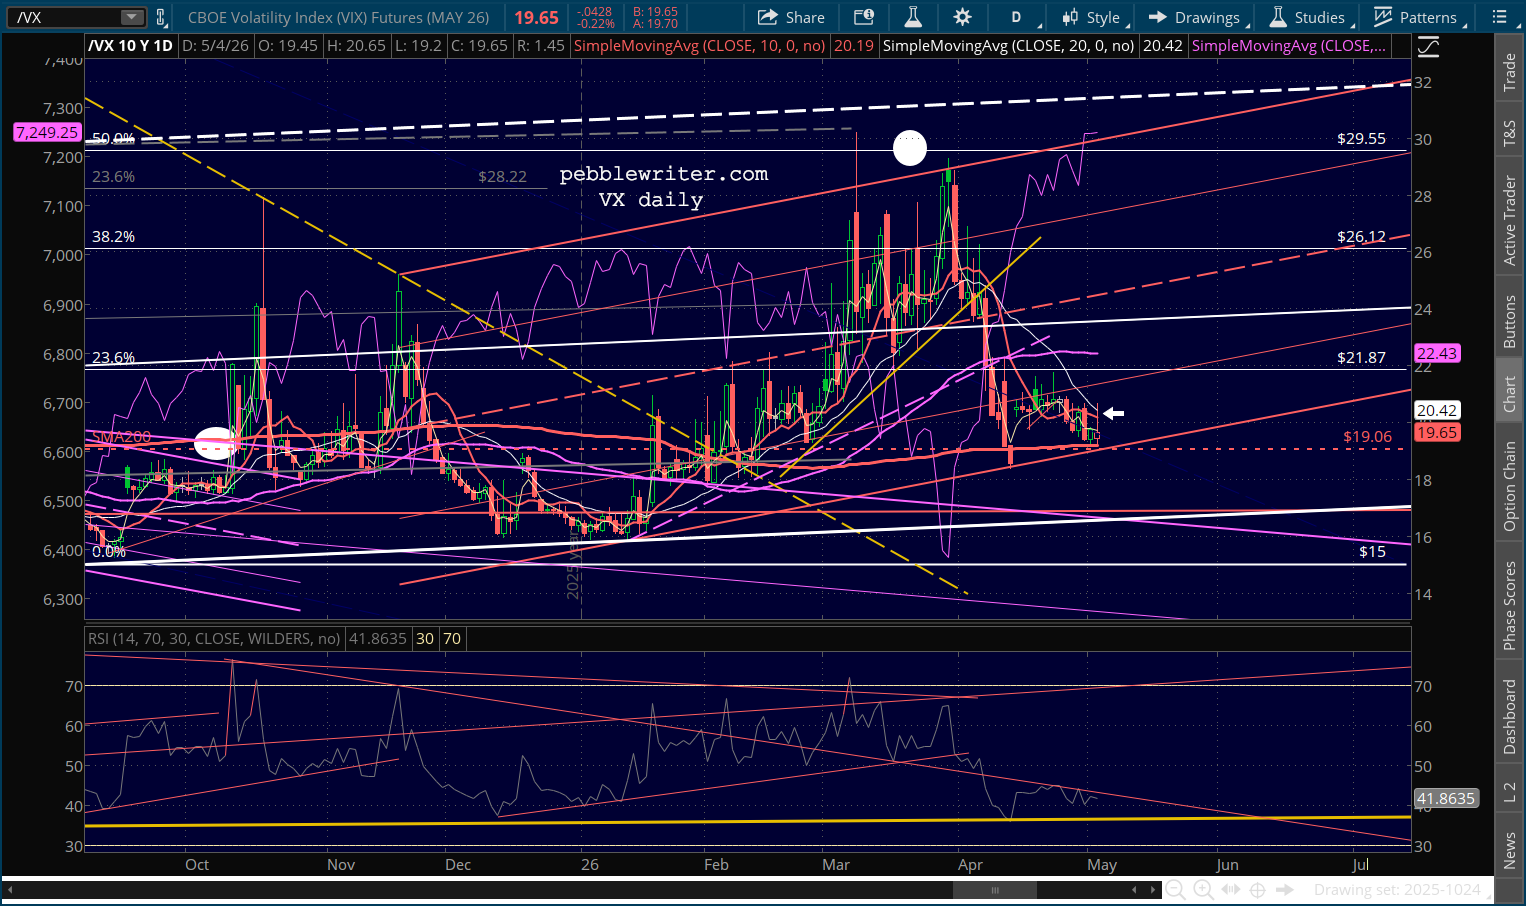
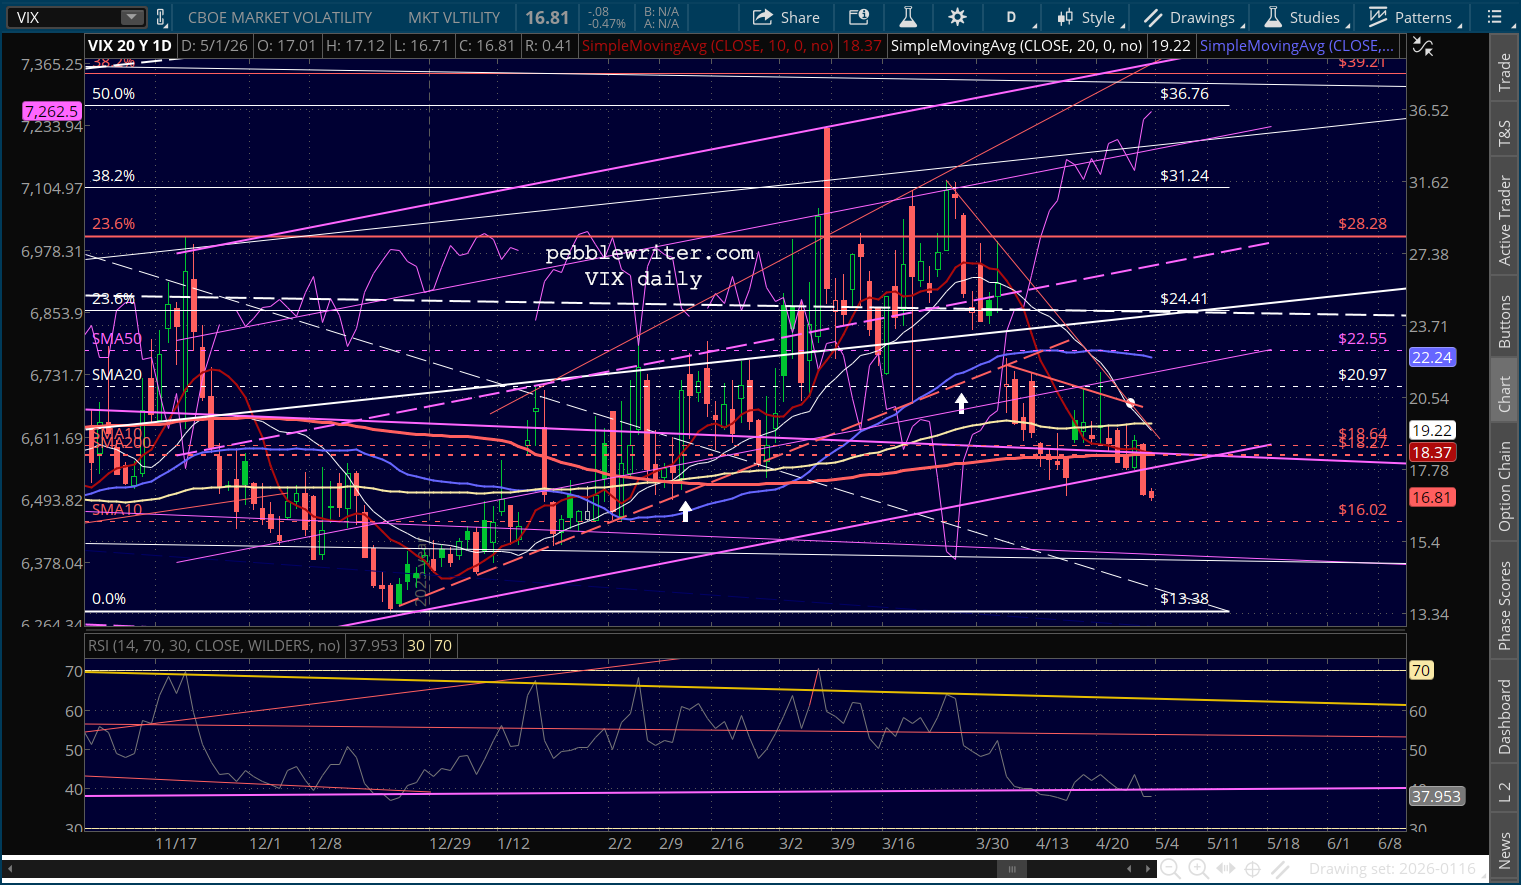
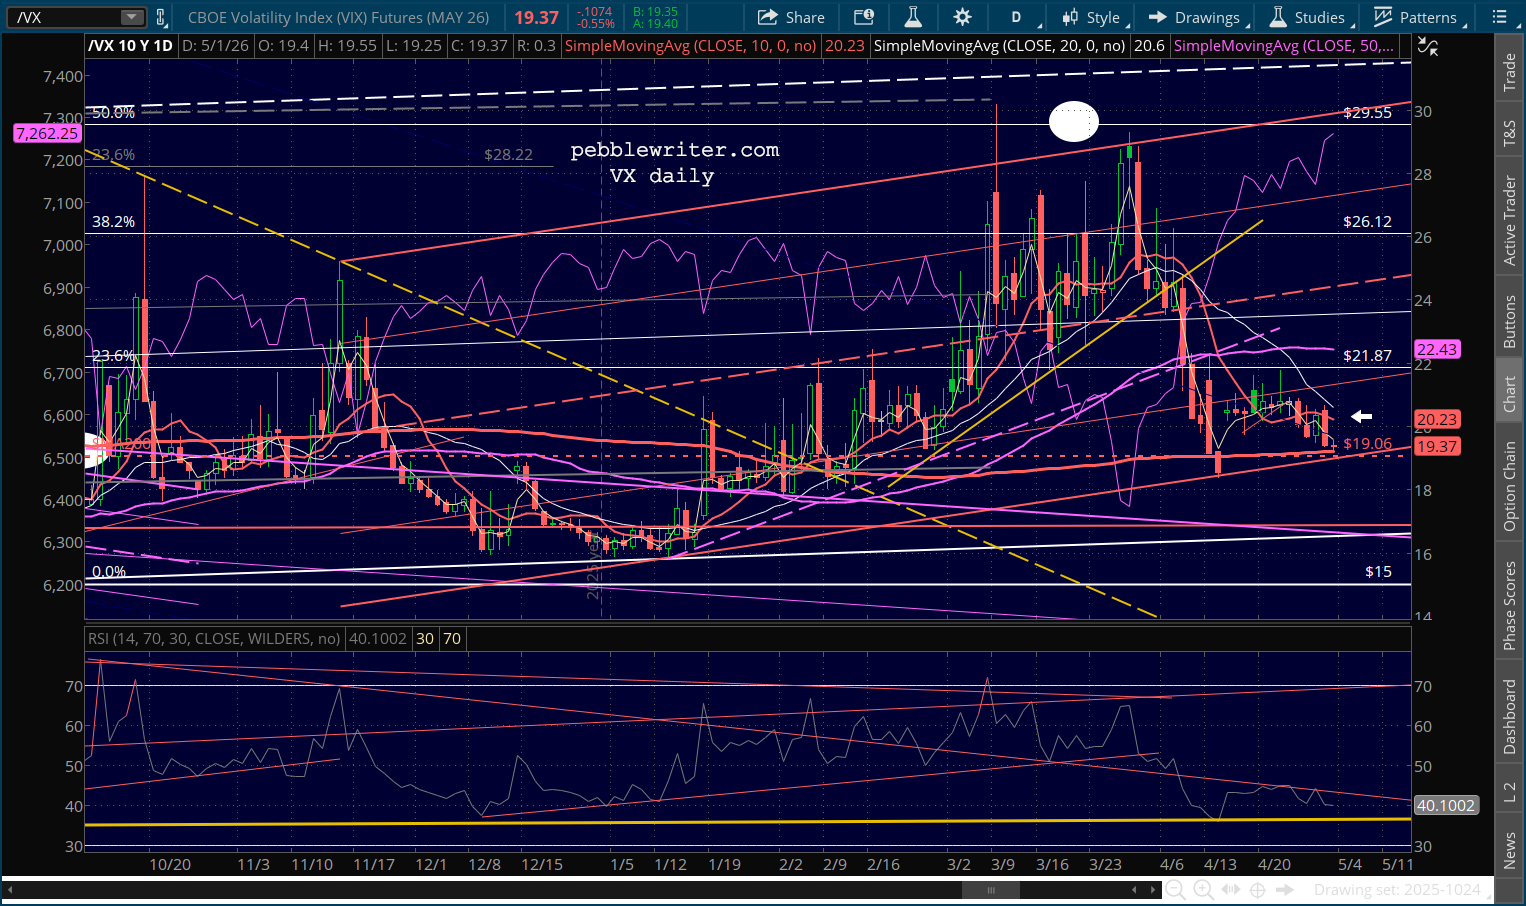
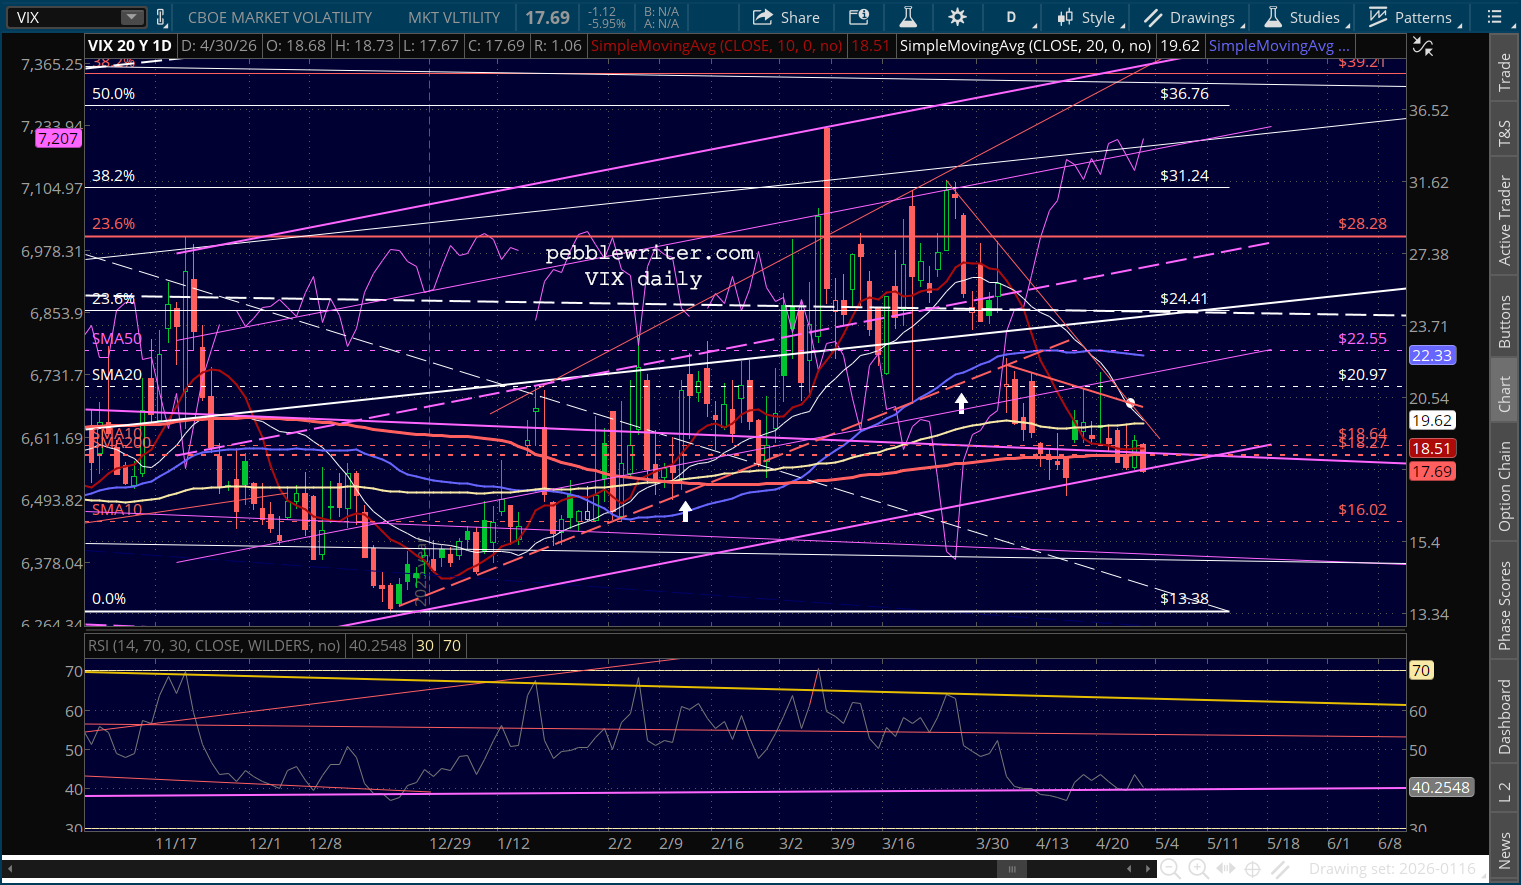
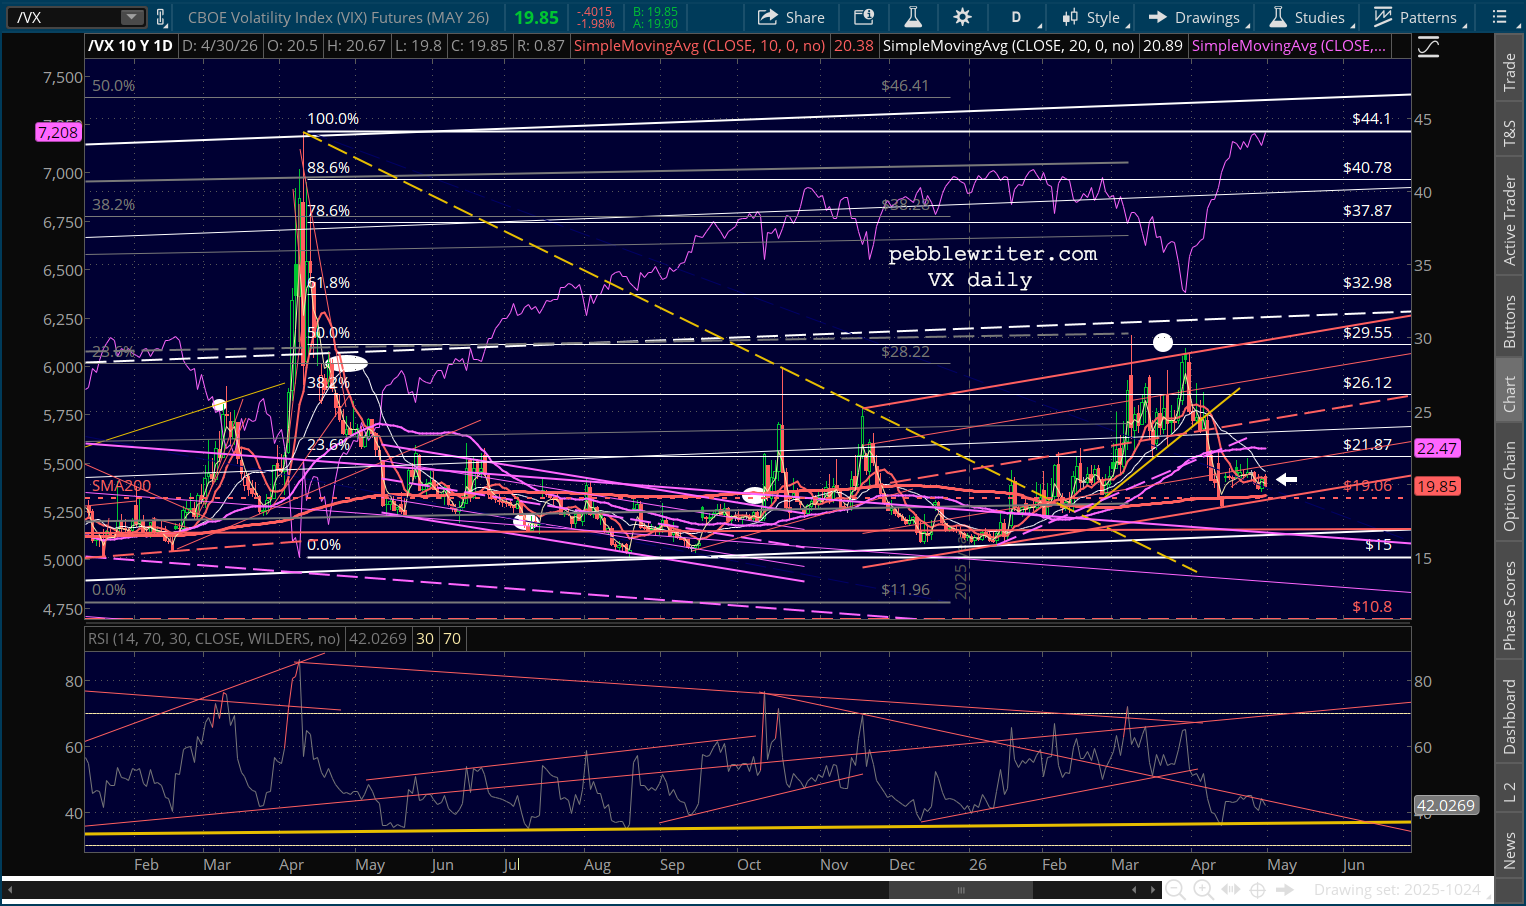
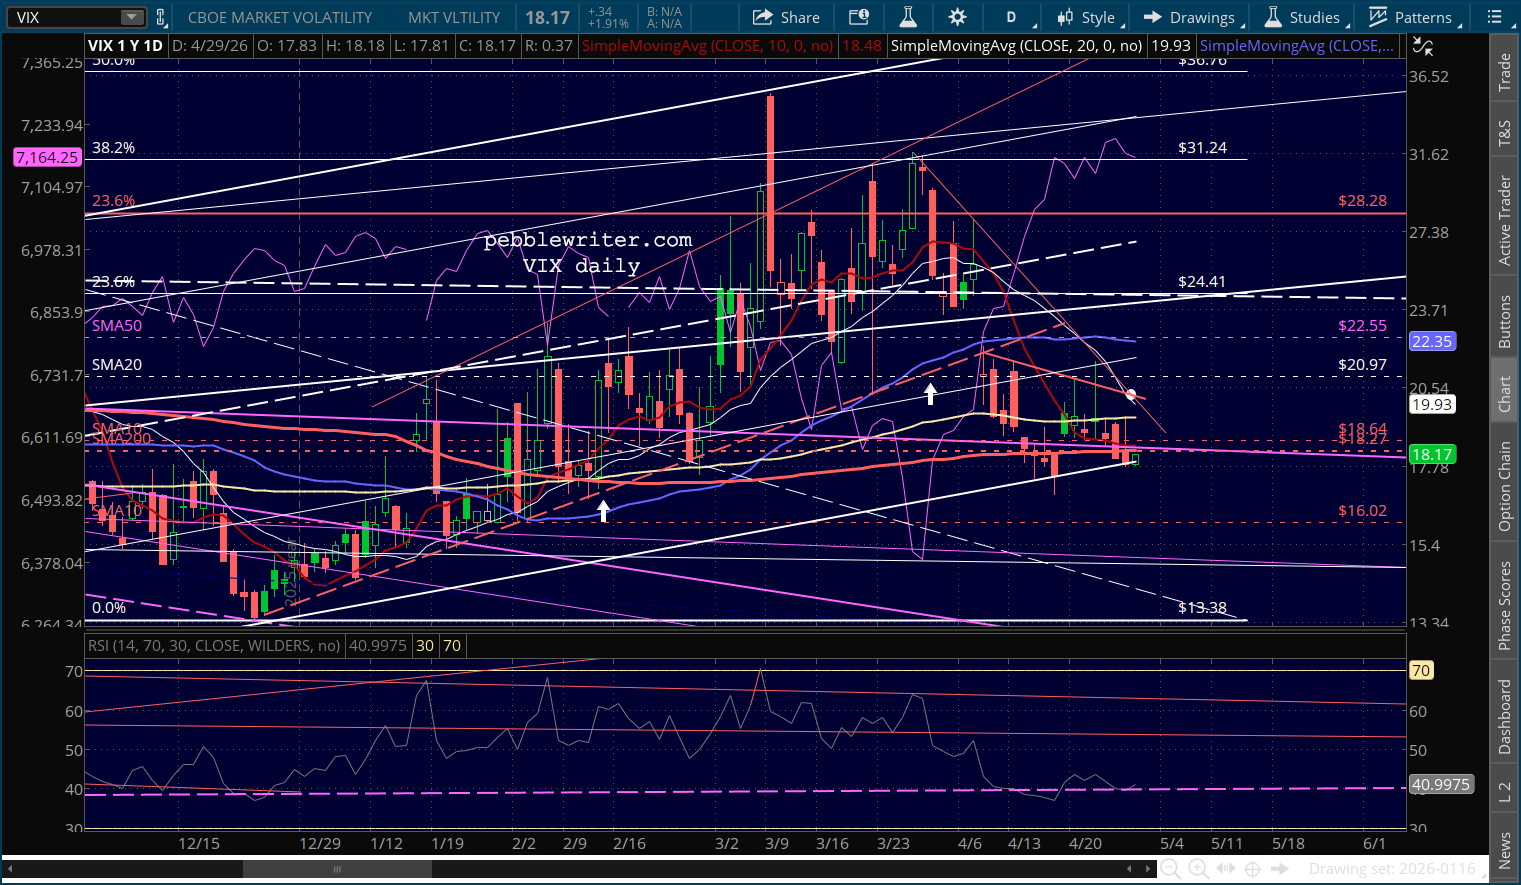
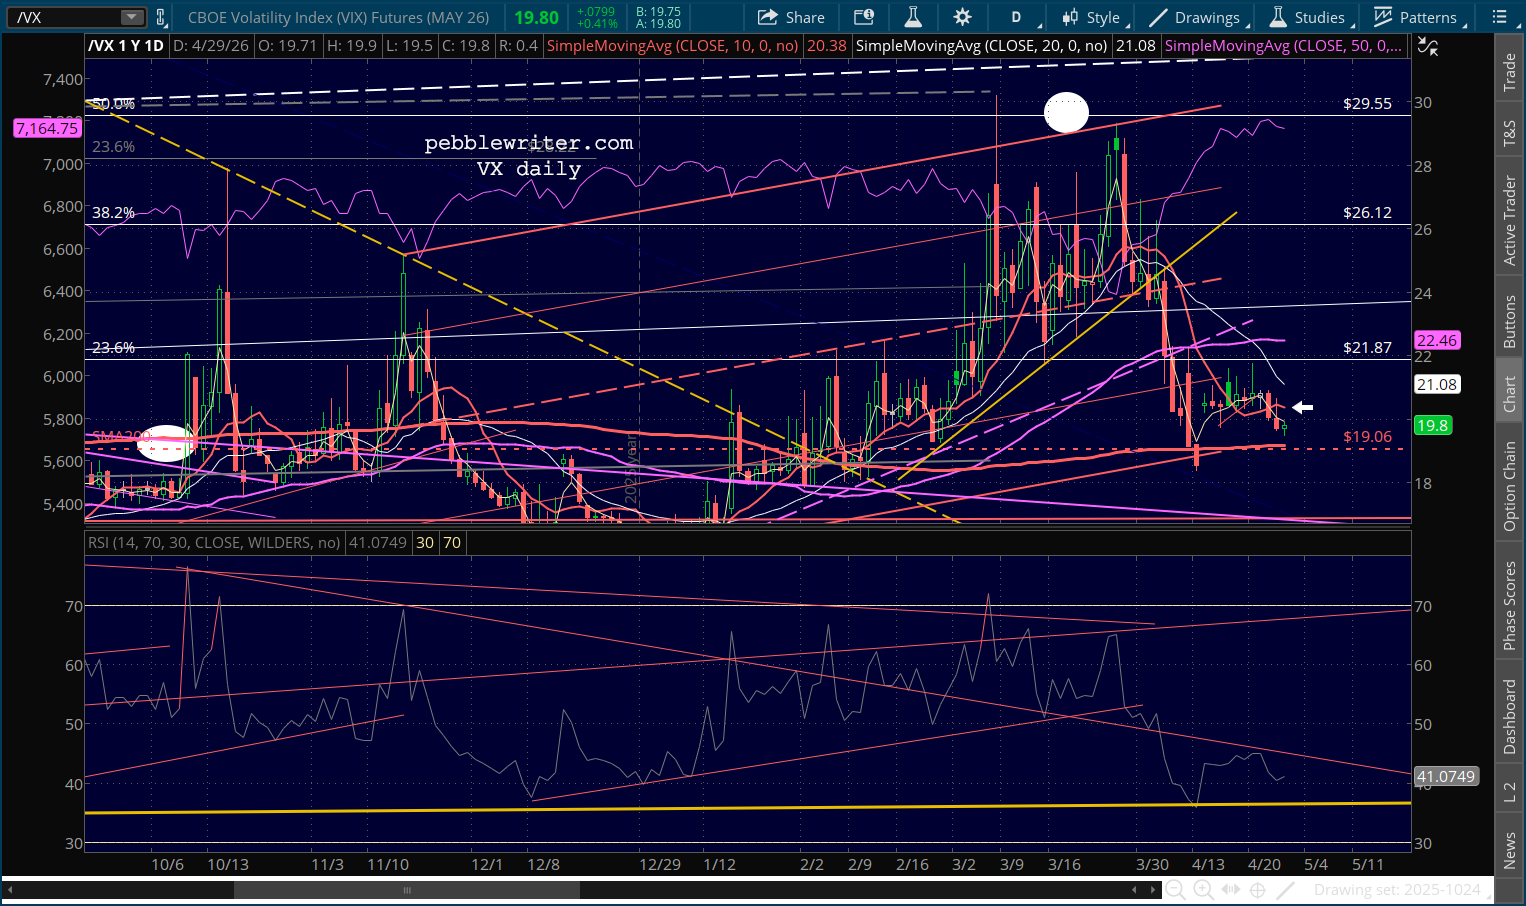
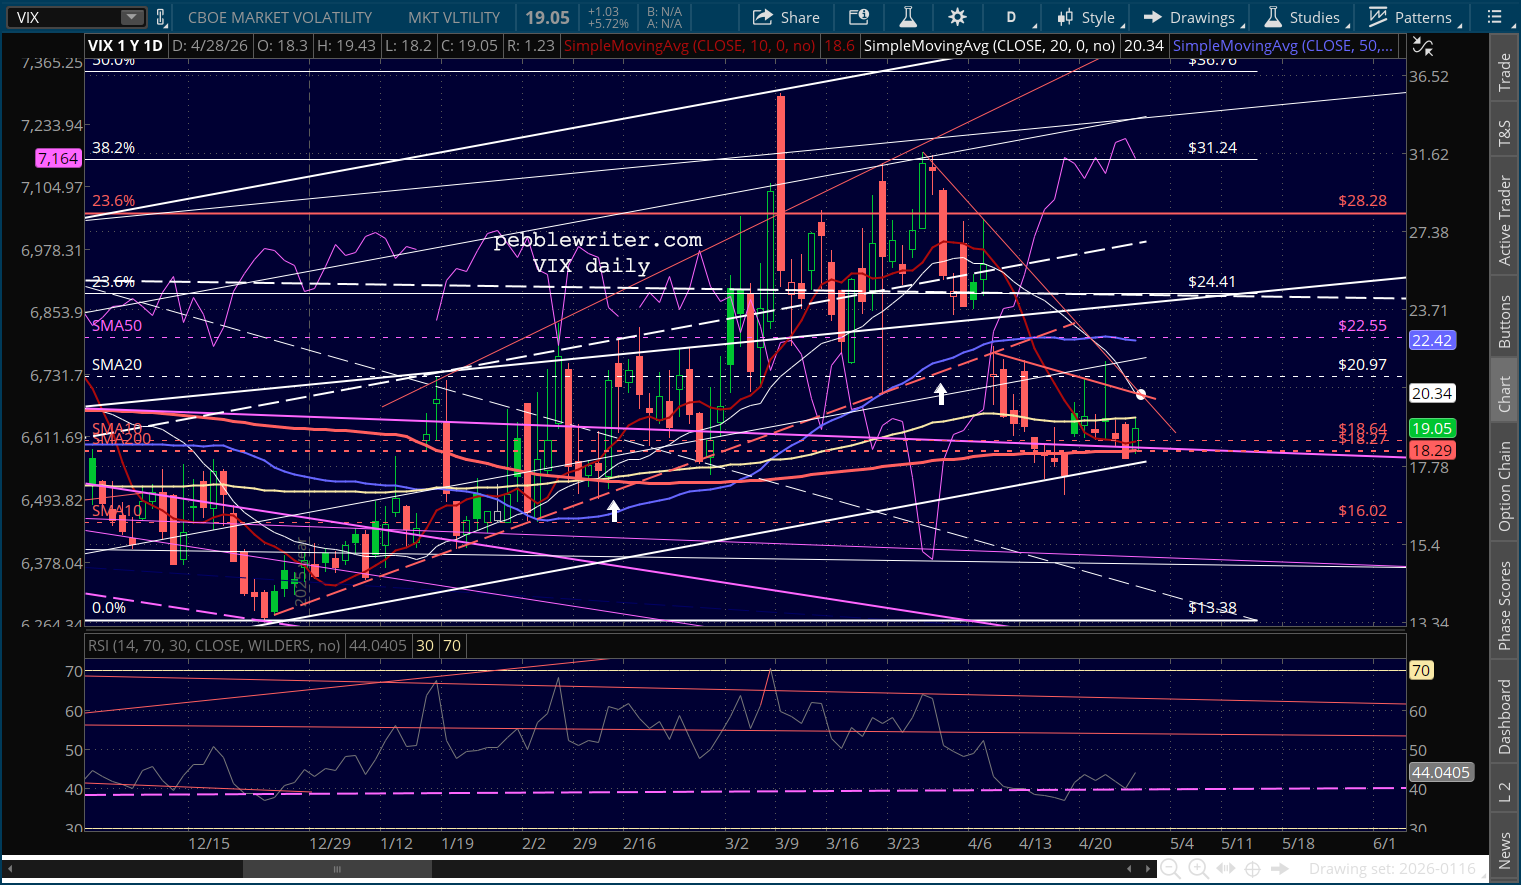
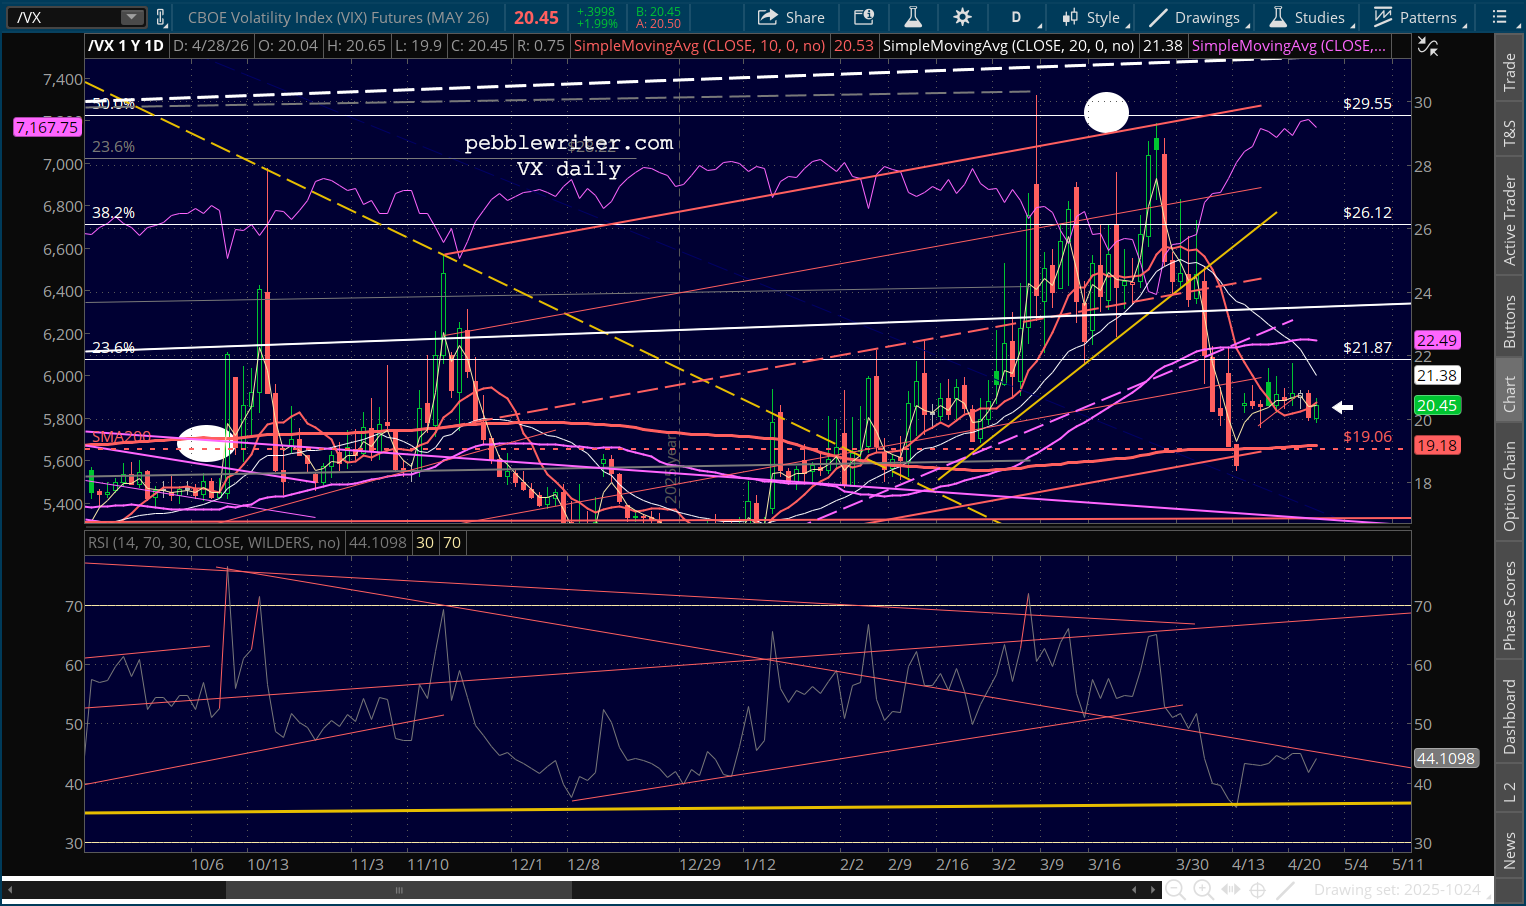
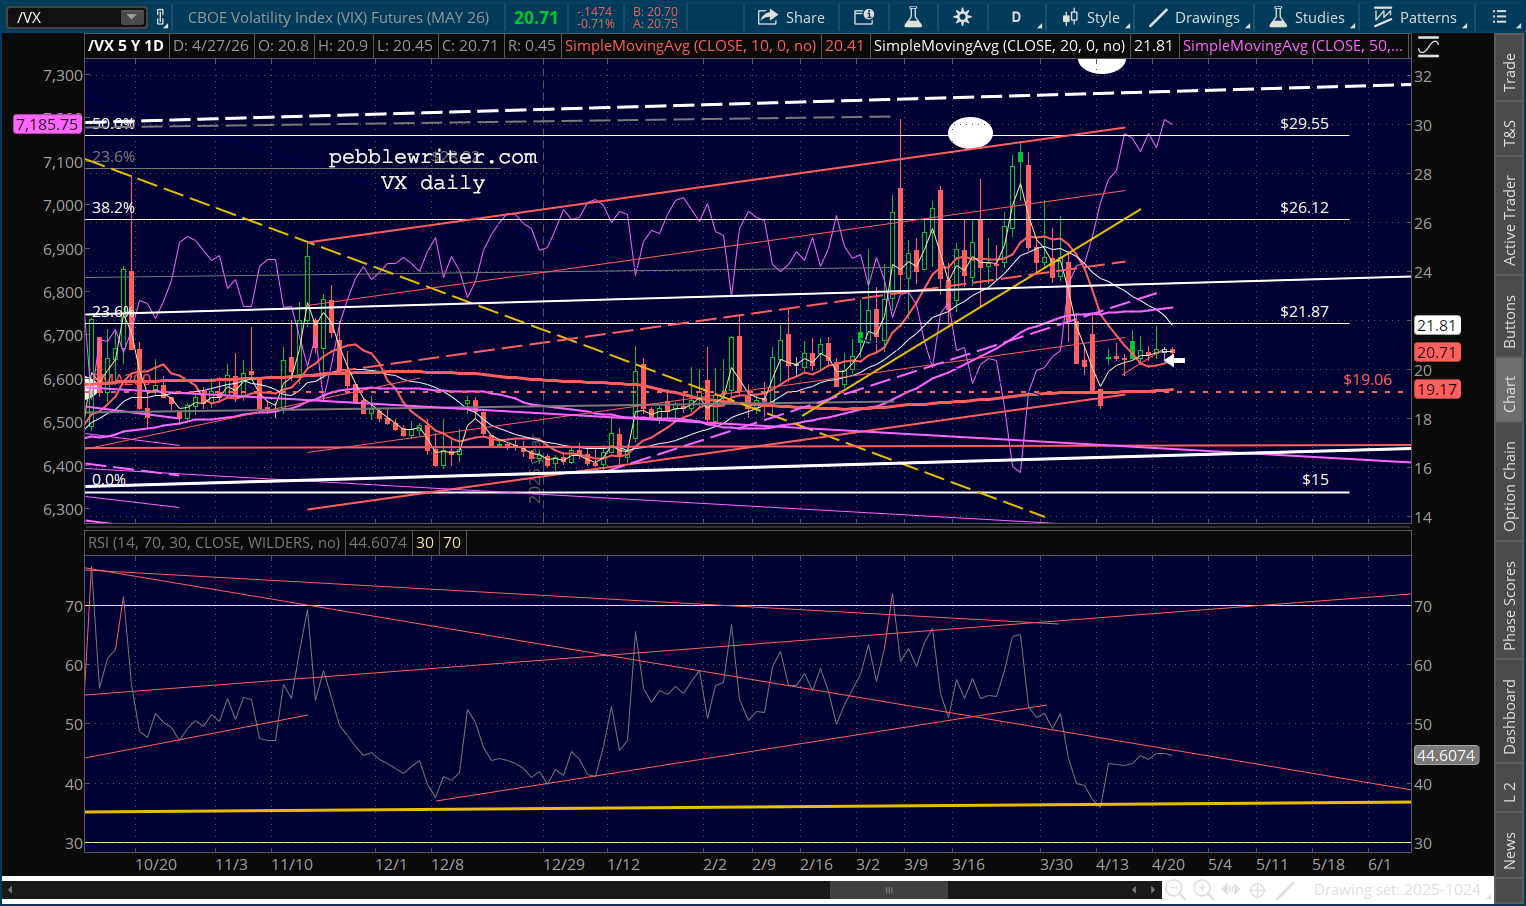
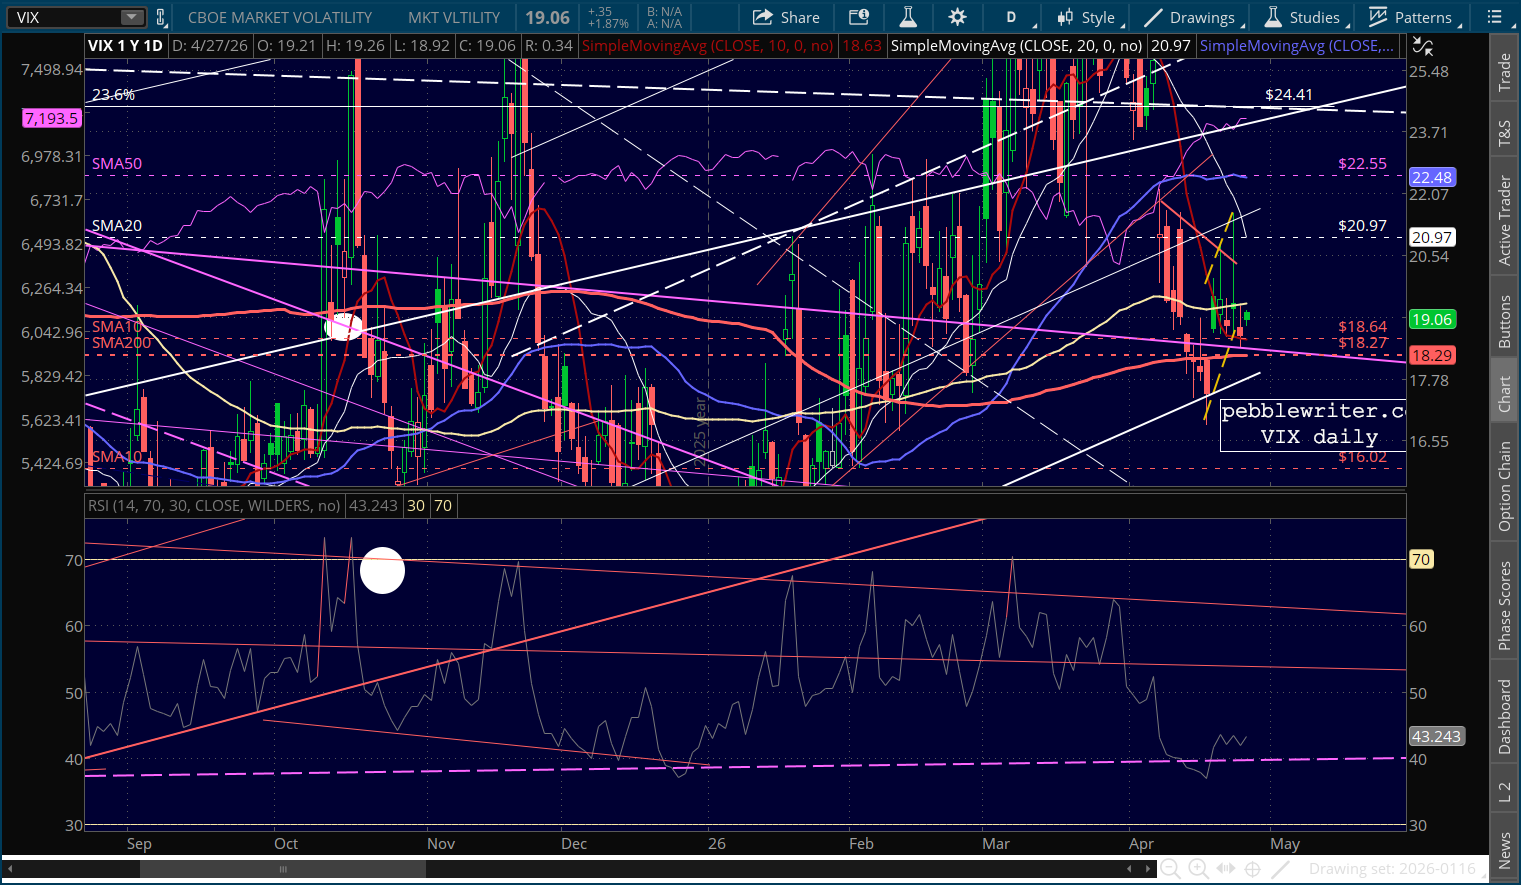
The companion VIX behavior reinforces the anomaly. In each case, vol exhibited a distinctive signature at the reversal: a simultaneous break of two independent technical structures on 2016 election night; a controlled descent from a rising trendline ceiling in 2022; a 44.1 spike precisely sized to deliver an overdue backtest in 2025; a pre-positioned lower high at the March 2026 equity low followed by a 40% crush through the 200-day moving average. These are not the vol signatures of random news-driven selling exhausting itself at arbitrary levels. They are vol signatures consistent with coordinated positioning around specific defended price zones.
The odds against such an outcome are very long indeed. Assume the DJIA trading range between 2016 and 2026 spans roughly 18,000 to 50,000 — a 32,000-point range. The probability of a random reversal landing within 3% of a specific pre-identified prior high is approximately 6%. The probability of four independent reversals all landing within 3% of pre-specified prior highs, under a null hypothesis of fundamental price discovery, is roughly 0.06⁴, or approximately 1 in 77,000. Even relaxing the tolerance to 5% only brings the joint probability to about 1 in 10,000. It doesn’t prove market manipulation, but it certainly rules out “coincidence” as a viable explanation.
Ironically, the biggest tell is that the pattern operates on the DJIA — a price-weighted, 30-stock index that professional investors ignore — rather than the S&P 500, where institutional capital, derivatives liquidity, dealer gamma, systematic flows, CTA positioning, and vol-centered strategies live.Why the Dow?
There’s no doubt that the DJIA is the index that populates political rhetoric, newspaper headlines, and presidential talking points — suggesting that this function is calibrated not to professional positioning but to preserve a specific narrative: Everything is alright. Nothing to see here. Move along. Trump has posted on social media or given speeches or interviews over 800 times in the past month. When he wasn’t posting about the incredible ballroom, he was posting about the Dow or the stock market — even as more consequential topics were on our minds.
We’ve discussed countless times the means by which markets can be manipulated. The list of likely suspects is fairly short: the Treasury’s Exchange Stabilization Fund (ESF), the Plunge Protection Team, the Fed, the Treasury’s Office of Debt Management. All except the Fed are headed by Treasury Secretary Scott Bessent, a man with ample financial sophistication, hedge fund experience, and loyalty to his boss. We can assume that the appointment of Kevin Warsh to Fed Chair will only strengthen Trump’s ability to dictate market outcomes — at least so far as the Dow is concerned.
Stay tuned...