

Annualized Q4 GDP came in much lower than expected: 1.4% versus 3.0%. At the same time, December PCE (ex food and energy) heated up from 2.8% to 3.0% YoY (0.4% MoM.) These data don’t necessarily scream stagflation, but they more than whisper it. We’ll see if the algos are listening.


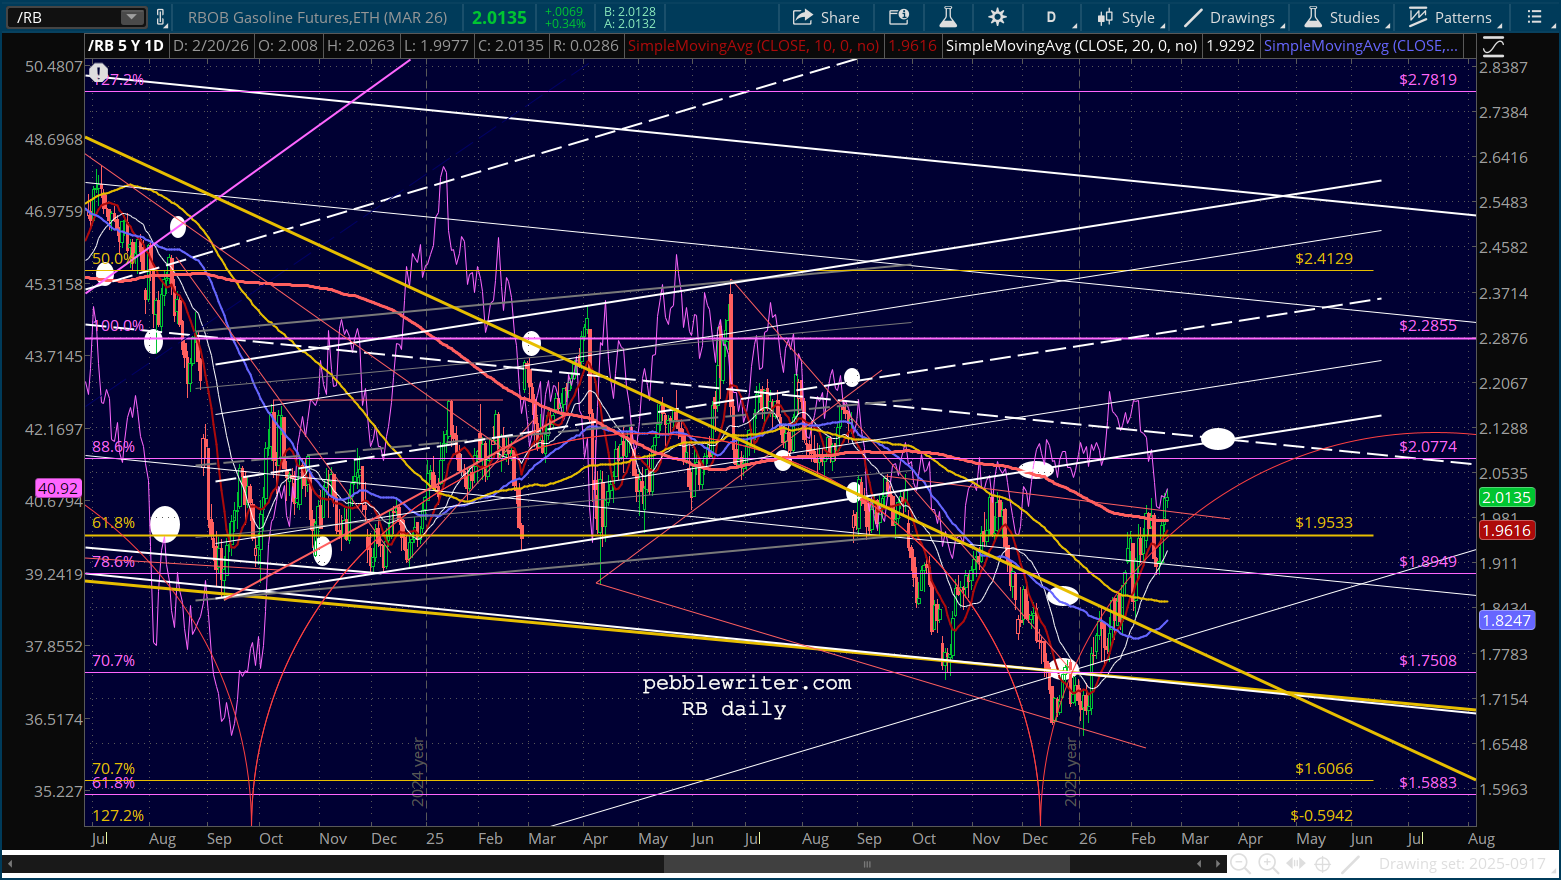
Interesting goings on in the bond market, as the 10Y continues to counter oil/gas.


They’re usually in lock step. As YoY gas prices drop, CPI generally keeps pace.

But, RBOB futures are up 22% since Jan 5. The 10Y kept up until Jan 20, but has been plunging ever since.
It might be because it’s diverged so much from CPI. Looking at the chart below, you have to wonder whether the risk implied in the 10Y is problematic. There’s no question that CPI is understated. But, does that explain the growing divergence between the 10Y and CPI?
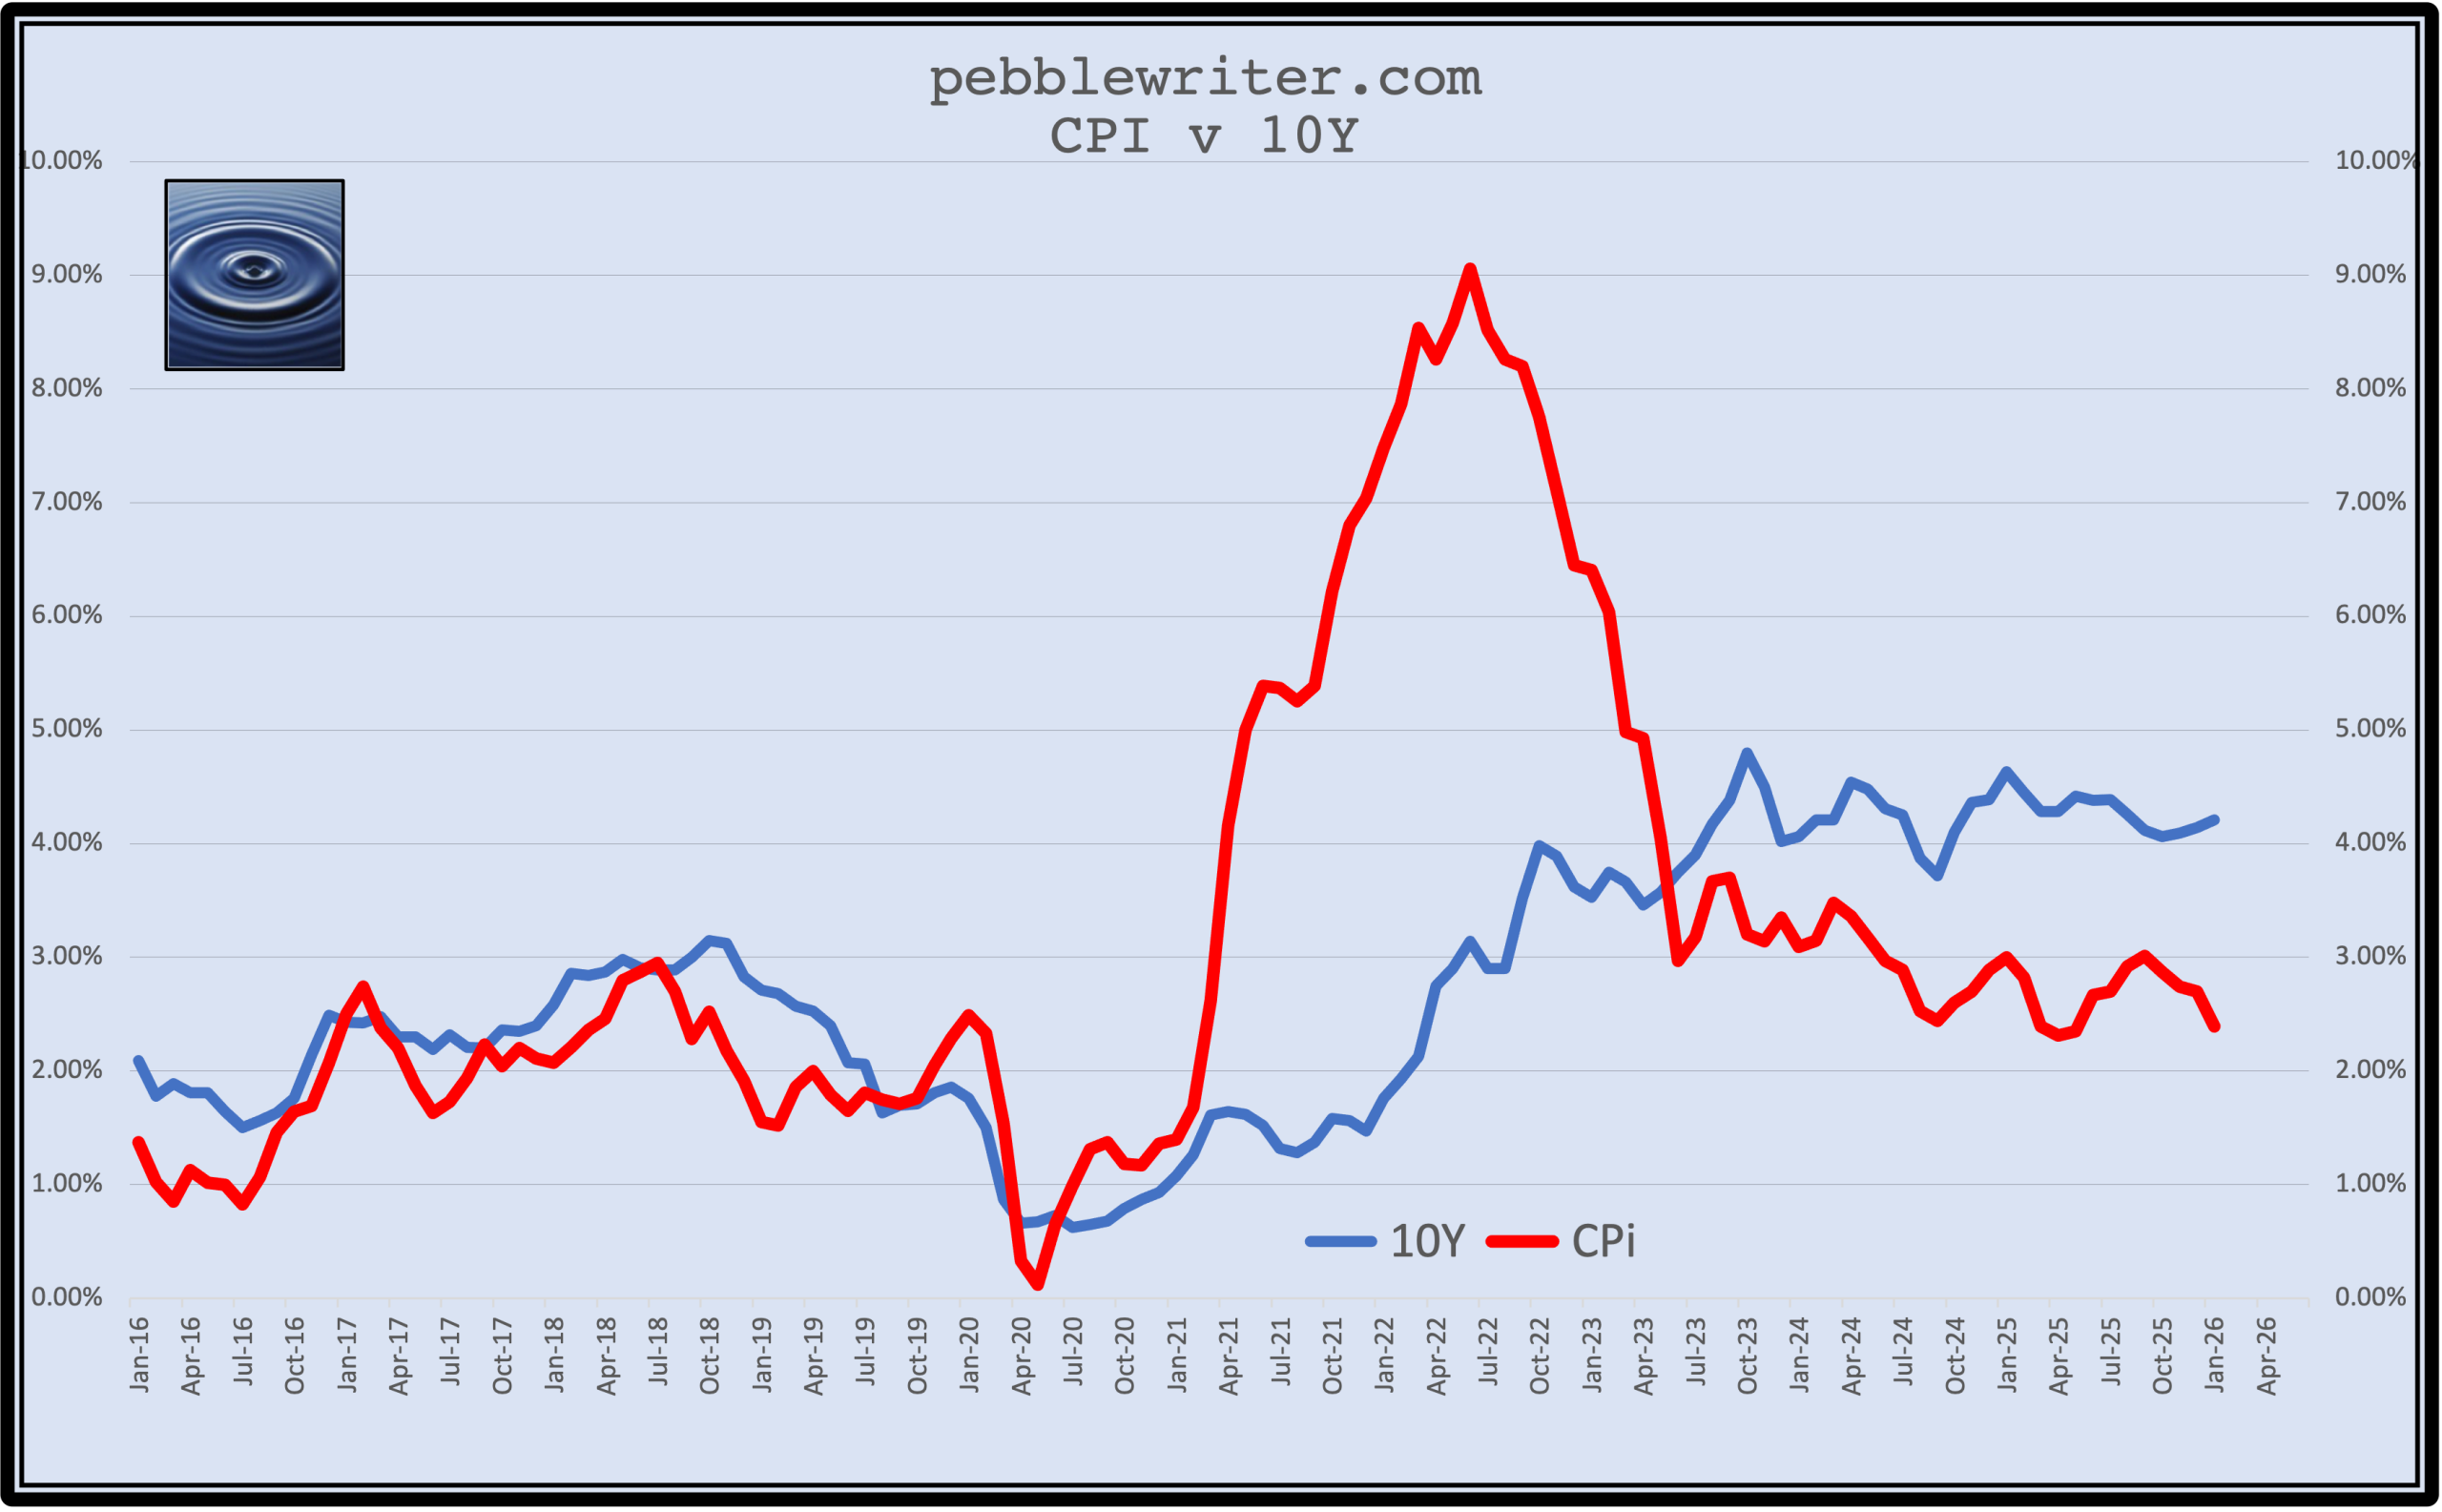
Historically, it’s an unusual phenomenon, code for “is this time different?” There are only a dozen instances over the past 80 years where the 10Y remained in as tight a band as it has since June 2023 (108 bps.) It’s worth noting that no prior episode with a band this tight has such elevated CPI to begin with. It’s also worth noting that the divergence between the two is building, which is unusual in the sense that most prior divergences peaked sooner.
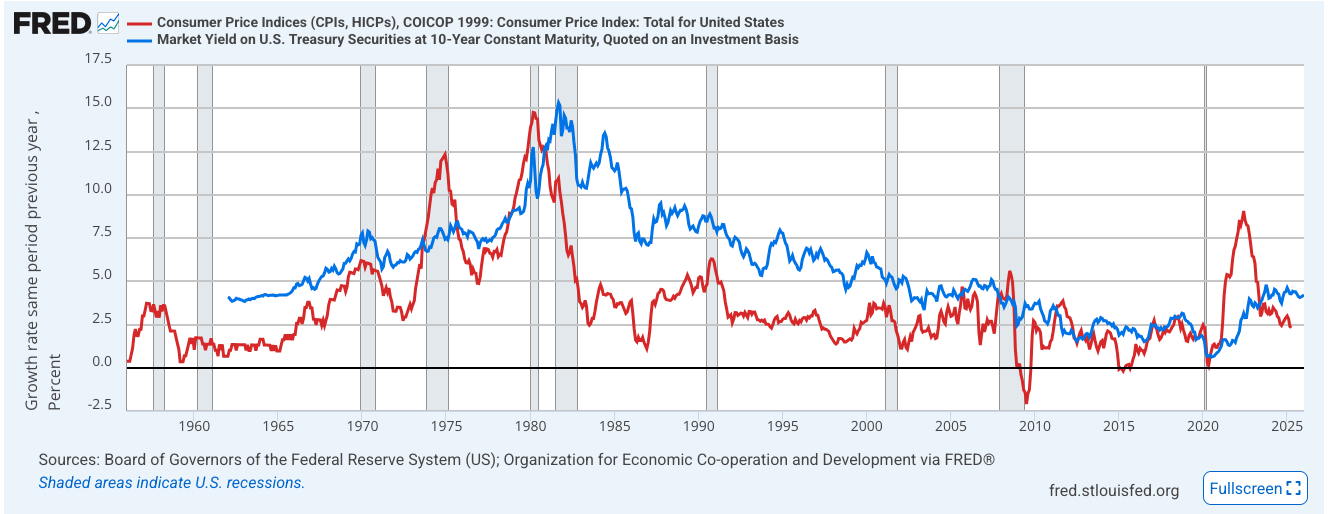
Of the four most comparable episodes over the years, three had positive equity returns: Jul 96 – Dec 97 (+27.8%), Sep 05 – Aug 07 (+10.2%), and Dec 74 – Sep 76 (+26.7%.) The market fell about 20% in 1977 following the 1974-76 period. It was relatively flat following the 1996-97 period. And, it was a disaster following the 2005-07 period. It tumbled 12% in early August, rebounded until October, then crashed 58%. But, it’s the fourth episode which might be the most comparable.
continuing…