Category: Charts I’m Watching

  • A Big Squeeze

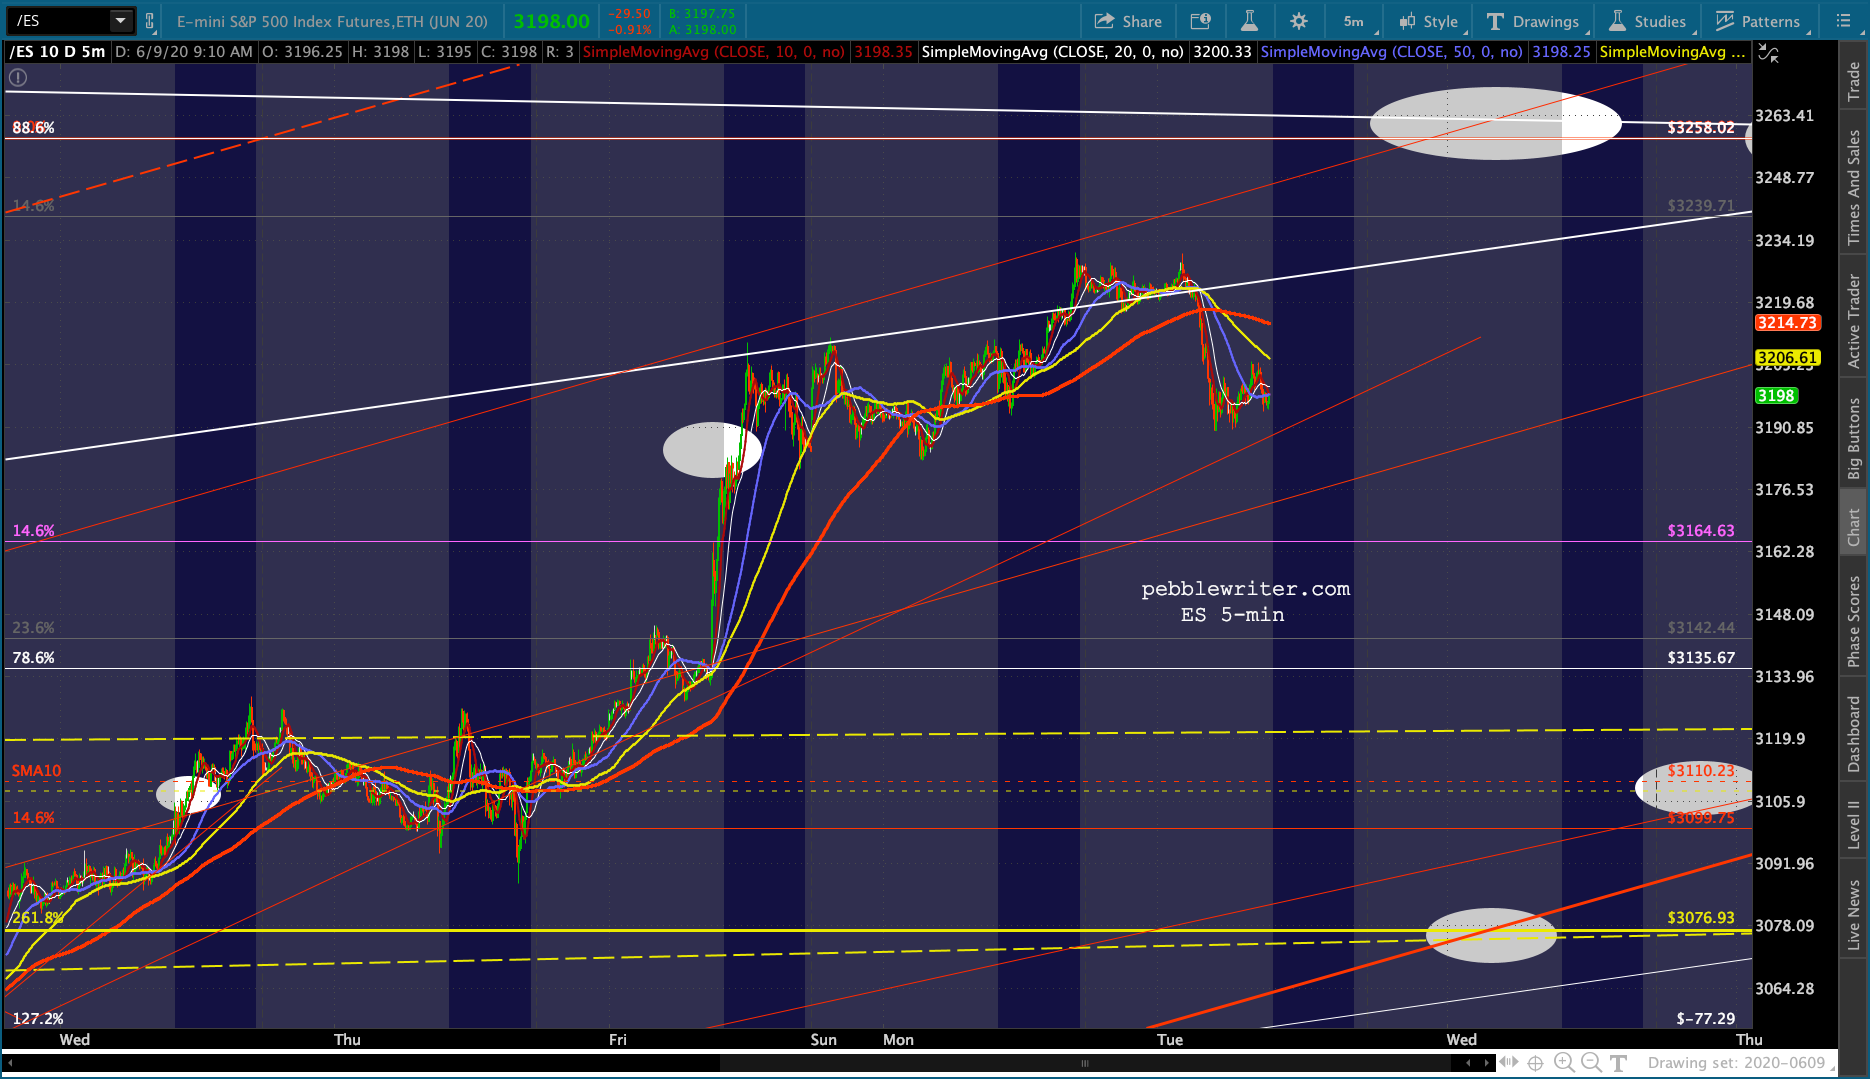
    ES has given back yesterday’s gains after bumping into the top of the rising channel which has guided it since late March. A large sell off would be unusual for the days leading into a Fed decision, let alone OPEX and the end of Q2.But, then again, there’s nothing normal about the market these days – which is why we need to keep a very close eye on VIX.

    continued for members(more…)

  • VIX Rules

    VIX continues to rule the roost. Friday’s plunge below the 200-DMA was all the algos needed to justify breakouts in multiple indices. The rallies in USDJPY and oil were icing on the cake. At what point can we assume stocks will take a breather, or more?

    continued for members(more…)

  • Another Yield Curve Warning for Stocks

    Two steps forward…in order to accommodate a big step back.

    We’ve seen it countless times in the lead-up to Fed meetings, GDP reports and, lately, jobs data. With May unemployment expected to top 20% (it’s unofficially already there) after another 7.5 million joined the jobless ranks……the market’s caretakers put a 58-pt cushion into the market.  ES’ 10-day moving average, for instance, is about 87 points below last night’s highs. Had ES instead fallen 87 points from yesterday’s lows, it would mean a risky test of its 200-DMA.

    It’s gratifying to see scores of analysts come to the realization that the markets are being heavily influenced (a more accurate word is manipulated) by massive Fed stimulus. But, as members know, this has been going on for years – particularly as stocks reach key levels of overhead resistance.

    With the Dow finally joining SPX in reaching its 200-DMA on Wednesday and several key components (e.g. AAPL) taking great pains not to break out to new highs, it seemed as though we might get at least a pause in the meltup, maybe even a correction.

    Our yield curve model confirmed it yesterday with the 2s10s breaking out above all recent highs except that seen in late March.Now, we’ll have to wait and see whether the algos, being directed this morning by USDJPY, VIX and CL, are intent on notching new highs or will, temporarily at least, reconcile with the real world.

    continued for members(more…)

  • Falling Into Place

    The Dow finally reached its 200-day moving average yesterday, one of the targets that seemed important to the algos. Perhaps significantly, it managed the tag without AAPL and COMP reaching new highs – a nifty trick – and on the same day that ES and SPX tagged our IH&S targets from Apr 6.

    We also saw a few more pieces fall into place – particularly USDJPY. It certainly opens up some downside targets as long as VIX cooperates by bouncing at 24.52.

    continued for members(more…)

  • What Resistance?

    ES closed just above the 2.618 Fib extension at 3076.93 yesterday and proceeded to conduct the usual overnight meltup, aided by a nonsensical ADP jobs report. Consequently, it is closing in on the IH&S target of 3108 from a pattern completed way back on Apr 6.

    At the same time, COMP – which has struggled to move beyond its .886 retracement, let alone make new all-time highs – just completed a golden cross, where the 50-DMA crosses above the 200-DMA.Is there even such a thing as overhead resistance any more?  We should find out today.

    continued for members(more…)

  • Pop and Drop?

    There’s a lot to unpack this morning, as several targets were tagged overnight.   USDJPY finally popped up to tag its 200-DMA……which enabled ES to come within 1.43 of our 3076.93 target – the 2.618 Fib extension of the drop between 2007-2009. I thought this was going to happen over the weekend, but better late then never.

    It’s been a while since we had a nice pop and drop. Stay tuned.

    continued for members(more…)

  • Mind the Gap

    In 2009, in the depths of the GFC with the S&P 500 tagging 666, about 11.9% of Americans lived in poverty.  In 2020, with the S&P 500 having recently reached 3393 after trillions in central bank intervention, the rate is estimated to be 12.4%, with projections of over 15% depending on how bad unemployment gets.Black and Hispanic Americans have it much worse.

    Is it any wonder that as the gap grows between the haves and have-nots, we’re again seeing evidence of extreme anger and despair?  With so many unable to pay their rent or buy groceries, and the lion’s share of the government’s pandemic response going to large corporations, should we be shocked that people are protesting in the streets? How about when they realize they’re the guinea pigs in the establishment’s undeclared herd immunity experiment.

    To use the talking head parlance, the market keeps “shrugging off” such economic realities. But, there’s something about protests, looting and riots that seems to get investors’ attention. Don’t be surprised if the market finally reacts.

    continued for members(more…)

  • The Hits Keep Coming

    It’s the last day of a short week packed with more important economic data — which the market has managed to ignore so far. Today might be a little different, as the spike in the savings rate and the collapse in consumption confirm a troubled road ahead for the strong consumer narrative.  Gee, could 25% unemployment actually begin to matter?

    Ignore the spike in personal income, as it reflects the massive government stimulus checks sent out last month.

    The PCE deflator also surprised, plunging almost to 2009 levels. So far, the futures have managed a muted reaction, with a likely falling wedge setting up following yesterday’s reversal at our channel midline target.But, with China trouble, riots in Minneapolis, and Trump taking a swing at social media darlings, maybe the data will matter for a change.

    continued for members(more…)

  • Update on Bitcoin: May 28, 2020

    I’ve only posted about BTC once before, back on Mar 23 in response to a member request [see: FOMC Embraces MMT.]  The Dow was about to test its 2016 election day lows and, not coincidentally, the Fed had just unleashed QEinfinity.

    The post went as follows:

    Two major chart patterns jump out at me: first, the obvious triangle pattern on the weekly arithmetic chart (it isn’t there on the log chart) suggests BTC should bounce from here and return to the top trend line (which failed, BTW, to hold a recent tiny breakout.) It currently stands around 9,925.Second, the daily log chart shows a TL was broken last week but BTC has since rebounded back above it. For those wondering, the retracement of the rise from the Dec 2018 lows to the Jun 2019 highs reached about 81%. Had the TL held, we’d be looking at a Fibonacci 78%.

    If you believe that BTC will necessarily rise (as gold will) as QE explodes, the charts support a continuing bounce. If you believe the FOMC will do whatever it takes to support the USD and crush surrogates such as BTC and GC, then keep an eye on that TL (5,000ish) as a fairly clear stop level.

    Having spent a few hours studying Bitcoin, I promptly forgot about it.  I don’t really follow it, and believe it’s at least as heavily manipulated as everything else. Probably more. But, thanks to member John K., I was encouraged to take another look.

    As it turned out, BTC did continue its bounce and went on to test the top trend line, reaching 9917.25 on May 8.  It was an impressive 100% move from the March lows.

    Of course, now it’s back at overhead resistance – the same trend line from December 2017 which halted the 2017 and 2019 rallies.We’ll take a look at the potential for a reversal or a breakout.

    continued for members(more…)

  • Betwixt and Between

    Q1 GDP was revised down to a negative 5% from 4.8% as Durable Goods came in at -19.4%, the worst since the financial crisis.

    Naturally, futures are up sharply……about equidistant between the important 200-DMA and the equally important 2.618 Fib extension at 3076.93.

    It’s decision time for the men behind the curtain. Credibility has already been stretched extremely thin. Does it still matter?

    continued for members(more…)