Category: Charts I’m Watching

  • Moment of Truth

    Algos continue to prop up stocks. This morning, VIX tested its 200-day moving average yet again, setting the stage for SPX to join ES in completing a golden cross. It will either be a springboard to new highs or, as we discussed on Tuesday [see: The Big Picture], a nasty headfake.

    It’s another moment of truth for stocks which seemingly everyone agrees are way ahead of fundamentals.

    continued for members(more…)

  • The Big Picture: Jul 7, 2020

    Few charting patterns receive as much attention as the death cross and the golden cross. In a death cross, the 50-day moving average falls below the 200-day moving average, suggesting lower prices ahead. In a golden cross, the 50-day moving average moves above the 200-day, portending higher prices.

    As we marvel at the speed and distance of the market’s bounce since March 23 and question whether the Fed’s assistance somehow invalidates it, it’s worth noting that SPX is about to experience a golden cross.The last time a golden cross occurred was on Mar 29, 2019. SPX closed at 2834 that day and rallied nearly 20% to 3393 on Feb 20, 2020 before crashing 35% over the following month.  [Incidentally, the Mar 30 death cross was a head fake, as the bottom was already in and stocks barely paused.]

    The previous instance came on Apr 25, 2016 when SPX closed at 2087. It went on to rally over 40% until topping out on Sep 21, 2018 and shedding 20% over the following three months. Looking at only these most recent instances, one might think a golden cross is a very bullish signal to throw caution to the wind – at least for a while.

    On Dec 24 2015, however, a golden cross turned out to be one of the greatest headfakes in years.  SPX pushed slightly higher over the next two days, then plunged 13% in a matter of 14 sessions.The biggest question in the investment world these days is whether the 15-minute 35% crash in March was an isolated incident and we have clear sailing ahead or whether there’s a bigger storm up ahead.

    To put it another way, has the massive central bank intervention really precluded any more downside?

    continued for members(more…)

  • Nothing New

    Another VIX-inspired, holiday weekend ramp in the futures in the face of dismal headlines… What a shock. Not.

    continued for members(more…)

  • VIX’s Important Test

    Futures are up sharply on a better than expected jobs report: up 4.8 million, and the unemployment rate dropping to 11.1%. Initial claims came in at 1.43 million, with continuing claims rising slightly to 19.3 million.

    The direction didn’t surprise anyone, but the numbers surprised most. The reopening of most of the country over the past month has produced the desired results. It remains to be seen whether the spike in coronavirus cases in half the country will put a dent in the trend.

    Back on June 12 [see: Is it Safe?], we alerted members to a development in VIX, which had recently broken out of a falling channel from March and was nearing a 10/20 cross.

    It’s tough to see on the chart above, but VIX’s SMA10 was just about to cross above its SMA20 – a bullish sign for VIX and bearish one for stocks. If VIX is hammered today, the bullish cross can be avoided. If stocks’ meltup is to resume, we could still see VIX backtest its broken white channel or the yellow trend line off the 2018 lows which is nearing the SMA200 currently at 24.89.

    As it turned out, that’s exactly what happened. After the jobs numbers this morning, VIX tumbled to tag its SMA200 and the yellow trend line from the 2018 lows. This completes a 42% drop which produced a 200-pt (6.7%) rise in SPX.The big question, of course, is whether this important support will hold.

    continued for members(more…)

  • We’ve Seen This Movie Before

    Futures have erased 40 points of overnight losses on the latest Statline vaccine news, this time involving Pfizer. As usual, it’s early stages on a limited number of trials. And, as usual, it’s coming in the hour just prior to the market open after futures had dropped below significant support.

    We’ve seen this movie before. This is the 2020 version of 2019’s “China Trade Deal is Done!” Chase it at your own risk.

    continued for members(more…)

  • Q2: Good Riddance

    It’s not that Q2 hasn’t been kind to investors. The S&P 500 is still up 39% from its March 23 lows (40% for the Dow, 49% for COMP.) But, it’s impossible to ignore how stocks got here and wonder whether they’ll continue to dance with the forces that brought them. Moreover, what happens if the Fed decides it’s done enough for now and the music stops?

    As we discussed yesterday, the bearish charts and downside indicators are piling up. And, of course, big rallies produce meaningful rebalancing that could offset the usual end-of-quarter algo-driven meltup. The next few days will be most interesting.

    continued for members(more…)

  • Charts I’m Watching: Jun 29, 2020

    Futures are up modestly this morning as we glide into the quarter end on a holiday-shortened, low-volume week.  VIX’s triangle perfectly illustrates the technical picture: attempts to break out have been beaten back, while threats to break down have routinely been rebuffed.

    It’s exactly what one would expect when the goal is to maintain positive numbers for the quarter – in the midst of a horrid fundamental backdrop. It’s hard not to look ahead to July, when the calendar offers less support.

    continued for members(more…)

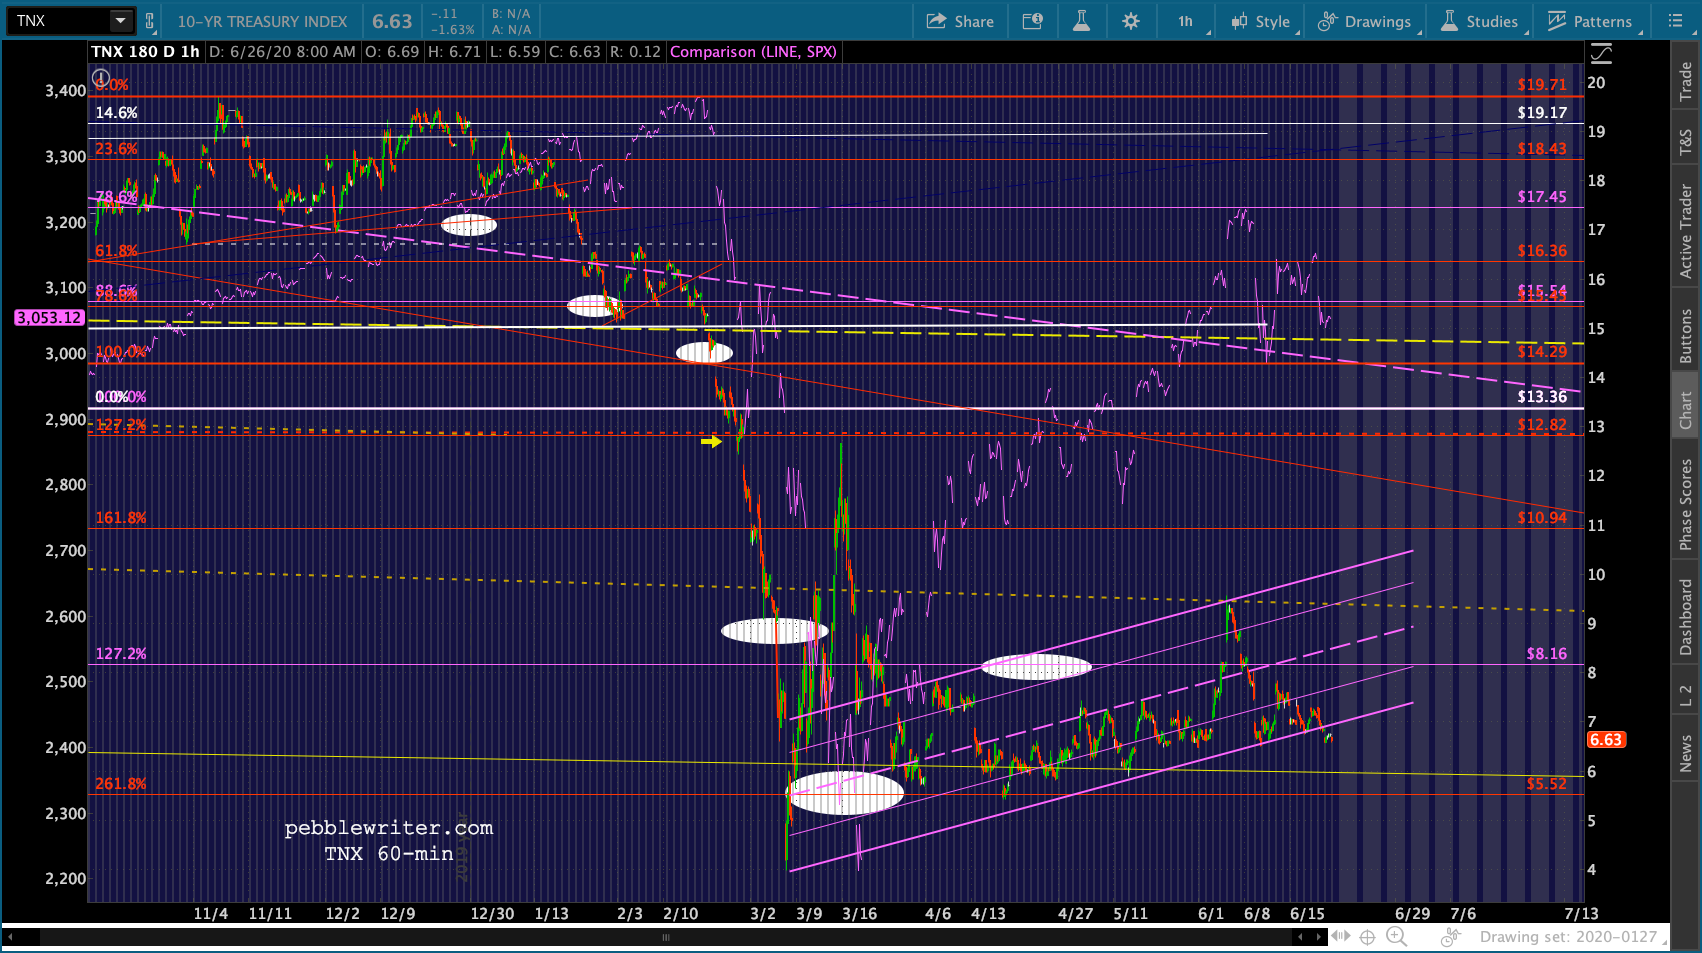
  • Update on Bonds: Jun 26, 2020

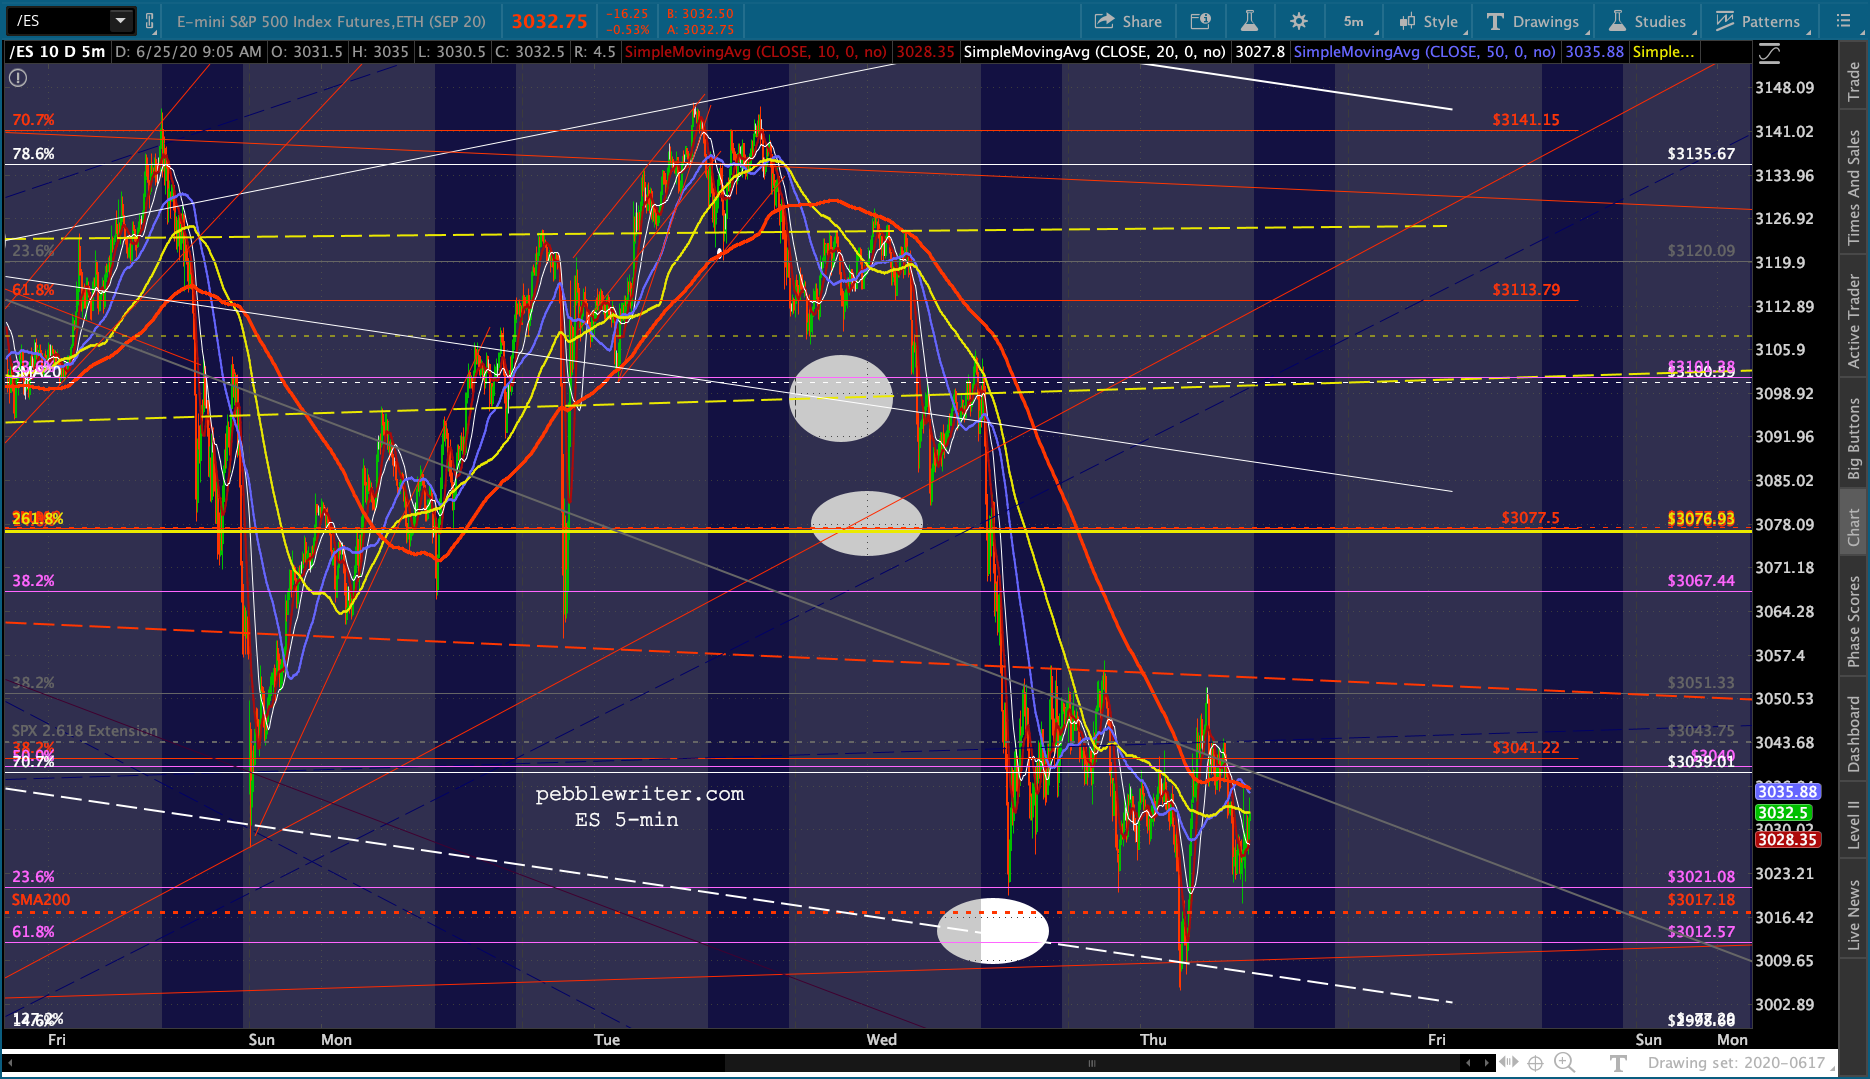
    Futures tested the important 2.618 Fib extension four times since yesterday’s close, bailing on the upper bound of a rising wedge with the last tag. This is a bearish pattern which, combined with numerous other bearish charts, still signals elevated risk.

    But, we’ve been beating that drum for a while. Today, I’ll focus on the bond market which continues to send its own signals of potential downside ahead. After an extended bounce, the 10Y broke trend ever so slightly just yesterday. What does this mean for bonds and for stocks?  Hint: bonds still matter.

    continued for members(more…)

  • Danger Ahead

    Today is a very important day in the markets. The signals that prompted us to short on several days ago are still intact, and more have joined their ranks – the most notable being the breakdown in the 10Y flag pattern.

    ES snuck down and tagged our SMA200 target overnight. To put things simply: If it doesn’t hold, all hell will break loose.There are any number of fundamental reasons for the market to tank, including the spikes in coronavirus cases in many states. Some governors, such as Texas’ Abbott, are even copping to how disastrous the situation has become.Working to prevent a meltdown, of course, are the algo strategies which have been so effective since Mar 23. It should be an interesting next few days.

    continued for members(more…)

  • Another Day, Another Test

    As we slowly make our way toward the end of Q2, we continue to see tests of important support. They are usually followed by sharp bounces despite the growing evidence that a selloff is right around the corner.Will today be the day the market finally takes the plunge?

    continued for members(more…)