EOD: 5:20 PM
AAPL earnings miss, EZ rumor crushed, negative divergence everywhere…tomorrow could be ugly.
UPDATE: 3:55 PM
I think this is a trap. Even after the run up, no break in the 60-min or daily RSI trend lines, lots of divergence. Adding to shorts.

UPDATE: 3:35 PM
The Guardian article, which apparently has a little hair on it. Sixteen point rally in SPX vaporized minutes later. How many of the previous 16 points were as a result of the article being leaked?
UPDATE: 3:05 PM
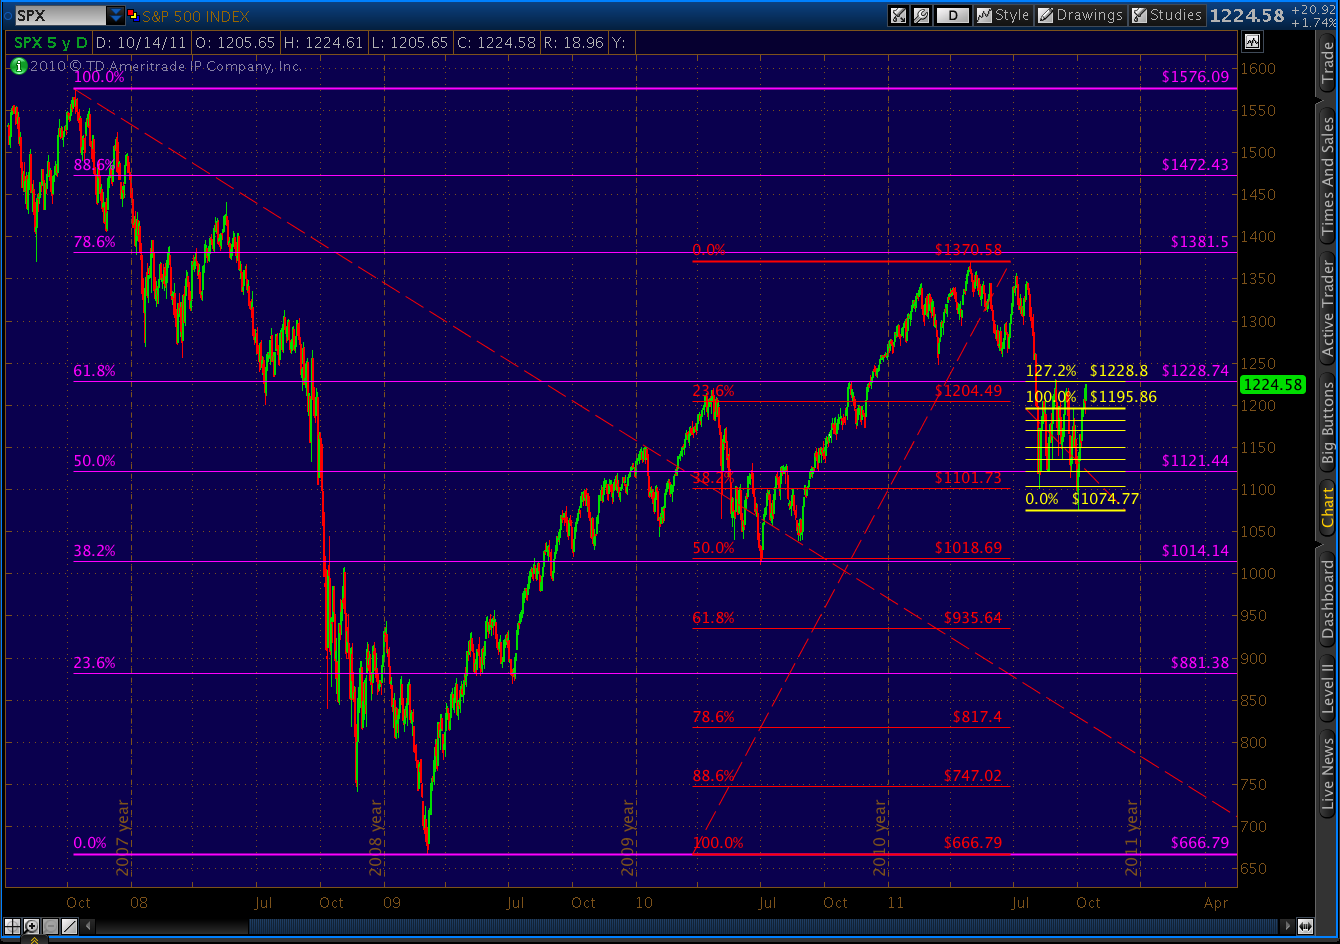
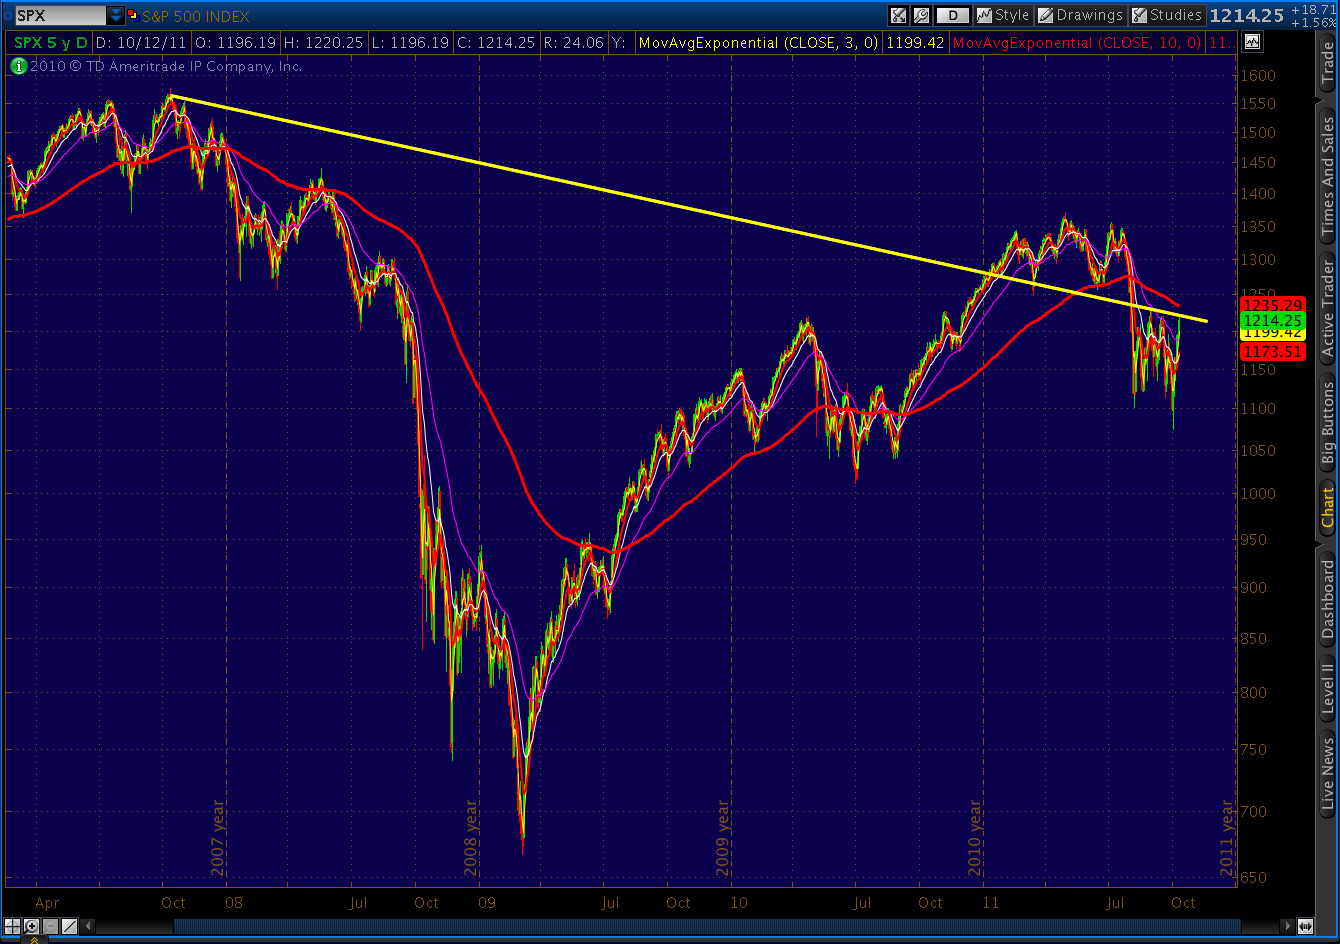
I show SPX, EUR and DX all completing Bat patterns. If we can manage not to exceed 1230, everyone will need to make some changes to their EW counts. If we melt up past 1230, they’ll be major changes. The next logical stopping place is the 200 day moving average at 1234.
UPDATE: 2:35 PM
DX has completed a Gartley that should reverse this morning’s slide and send it back up to test the fan line overhead.

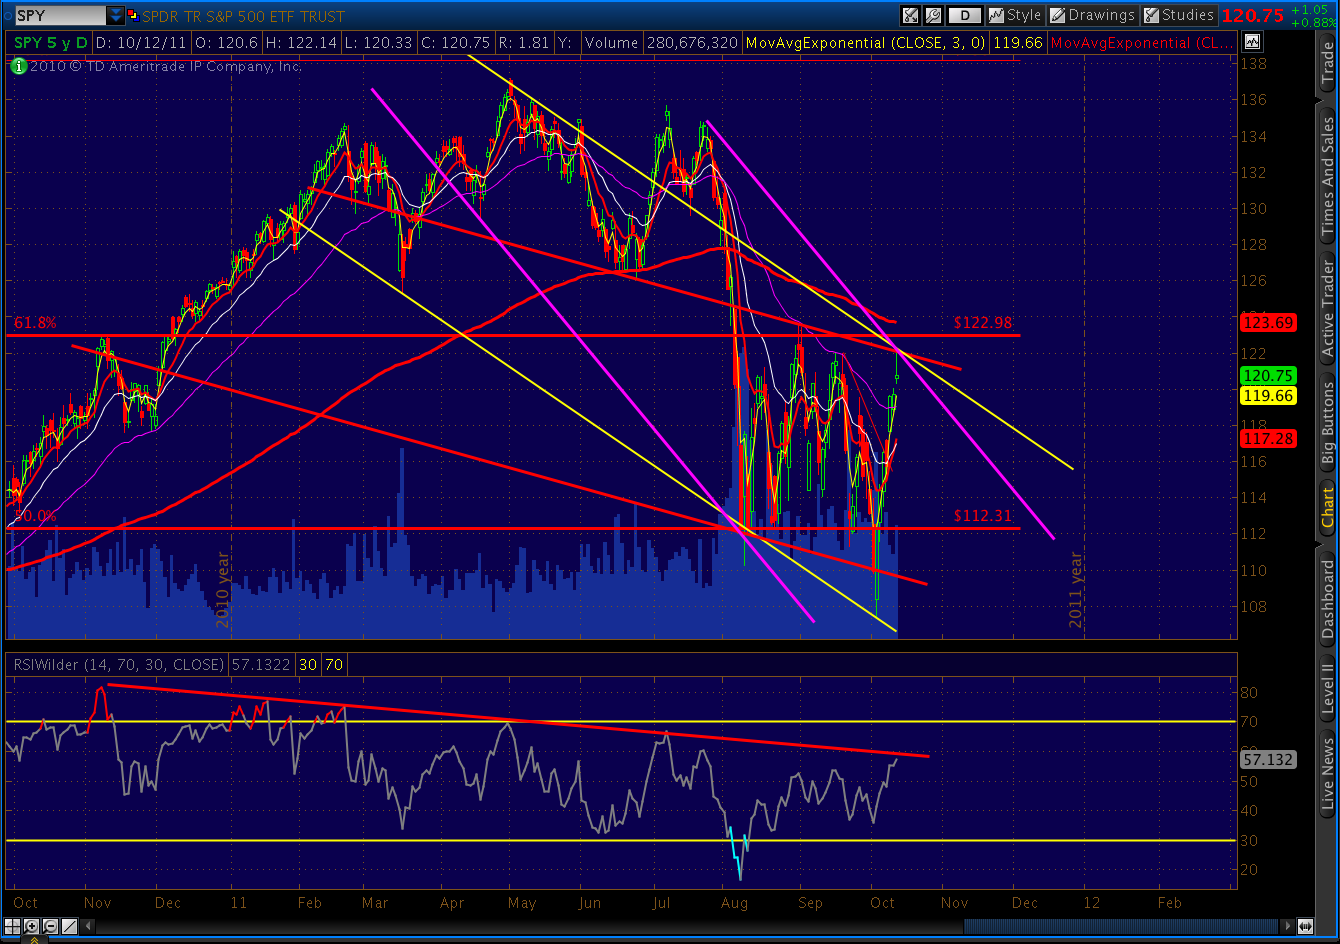
Note that it’s in a small channel that’s a corrective wave in a much larger channel, seen here on the 60-min chart.

Which is seen even better on the daily chart. The RSI trend lines are a testament to how muddled the picture is. TL 3 is fairly straight forward, calling for a continuation of the downturn. TL 1 looks like it’s being backtested, although we could easily adjust the slope to accommodate the latest dip — as we often have in the past. TL 2 definitely looks like it’s in backtest mode, with the turn already having been made. Note the histogram has put in a bottom and the stochastic looks like it’s trying to turn.
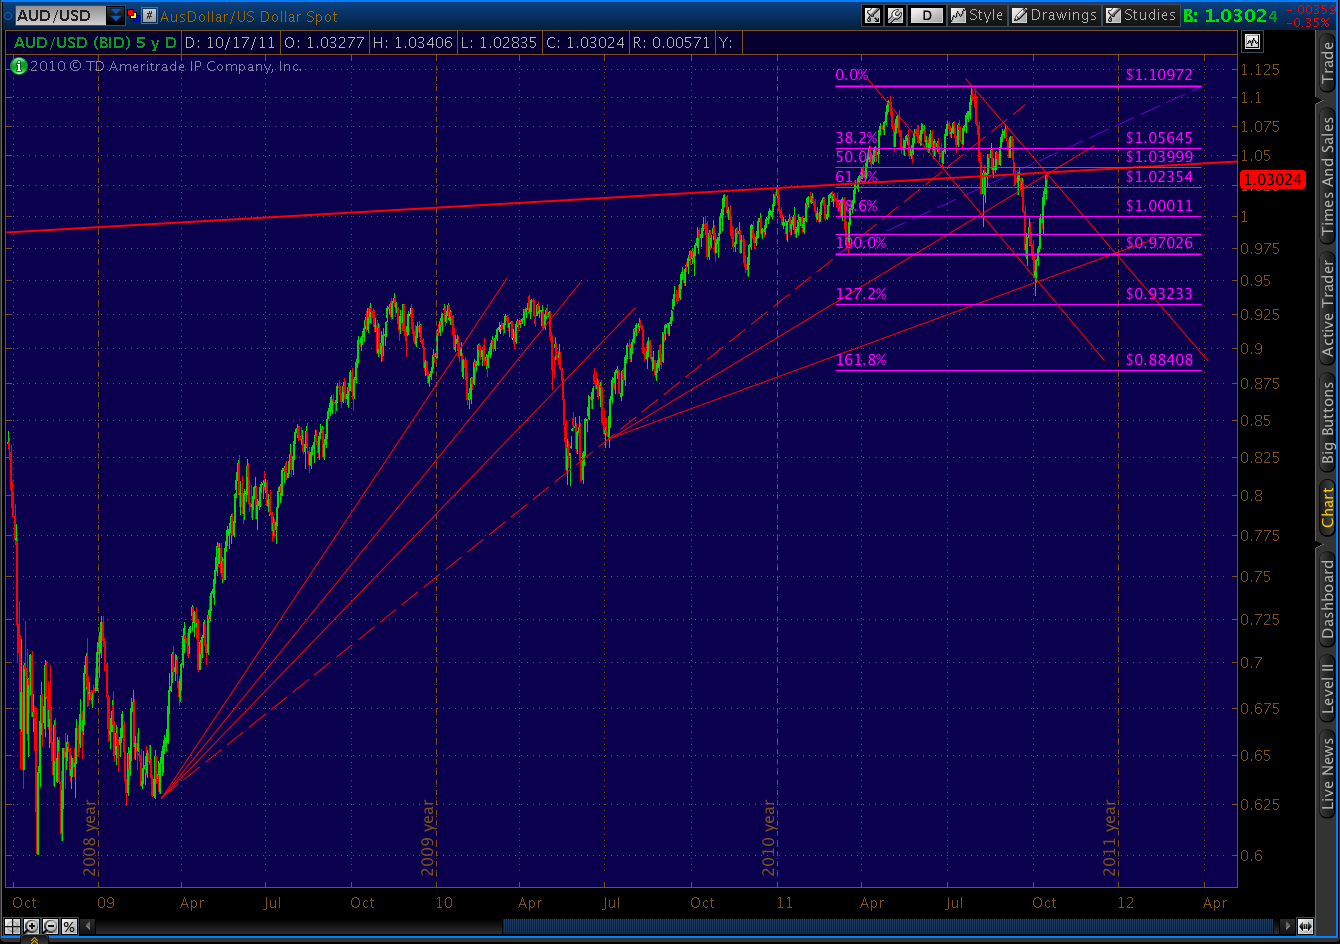
The EUR/USD picture looks similar.
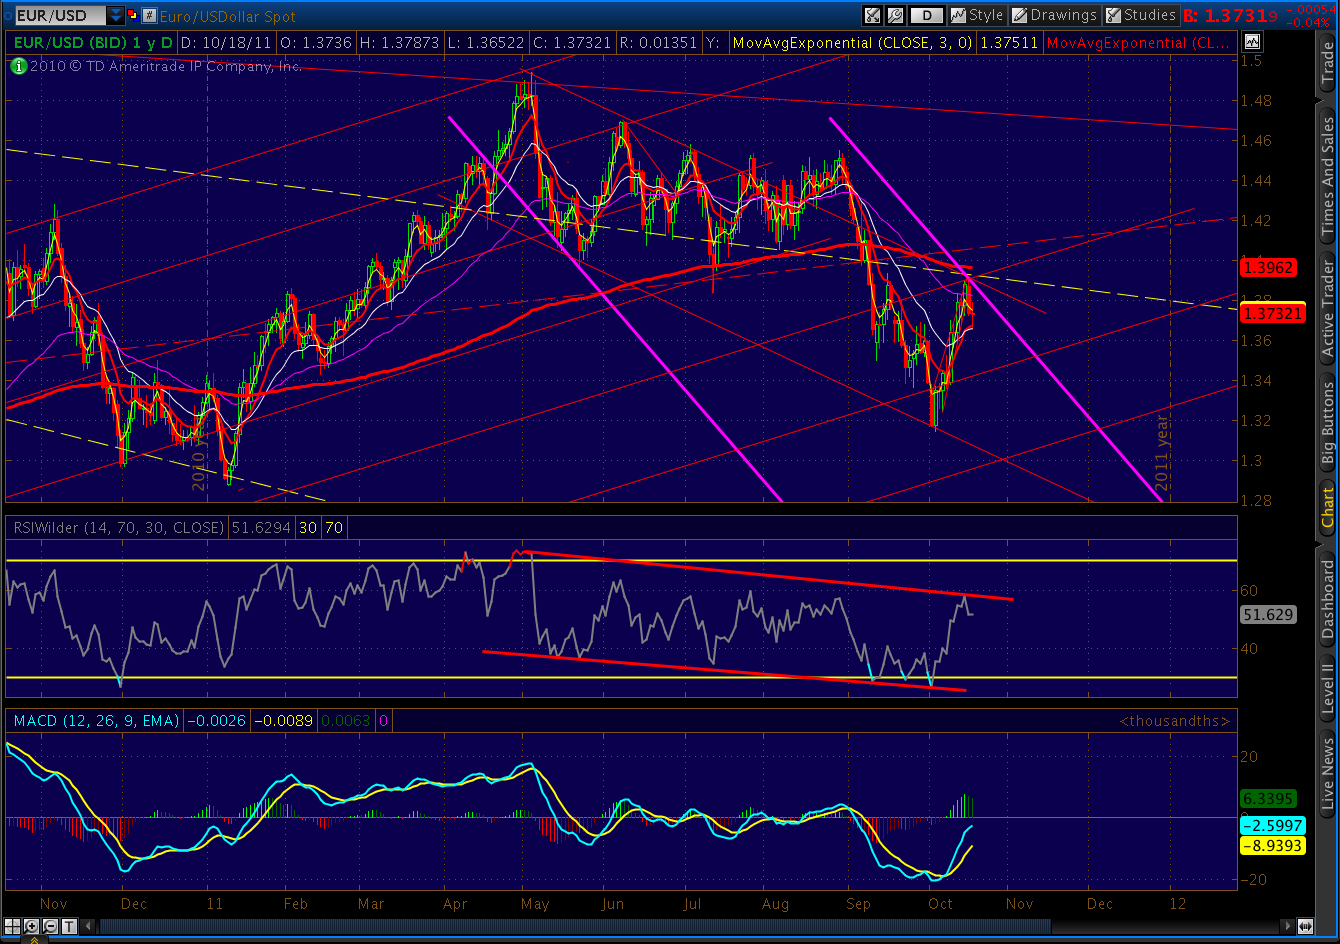
Naturally, we don’t know for certain about the large channel I show us bumping up against. It’s possible it’ll widen, allowing for more upside. But, it just so happens that the slope exactly matches that of several other channels. It suddenly seems a lot less random.

UPDATE: 1:20 PM
Small Crab busted, will probably run up to complete the larger Bat at 1220.72 before turning back.

Although, note the inclined line running through the current price. This is a fan line off the Aug 9 low that connected with a number of other lows on the way here. It’s easier to see on the daily chart (dashed line.)

By my count, this particular fan line provided either a high, a low, an opening or closing price on 13 days over the past two months. That, in and of itself, makes it significant and elevates it to a very likely influence on today’s action.
In fact, if we were to treat the Oct 14 and Oct 17 highs as a throwover, this fan line would make a pretty convincing line of resistance to any further advances.
It seems there are more than a few investors who aren’t sure what to make of the recent highs. I’m strongly tempted to call the chances of an imminent lower low kaput. This would fit better with the 2008 analog, as well as the most popular Elliott Wave count out there.
There are, however, a few issues (especially currencies) troubling me. More in the next post.
ORIGINAL POST:
Crab just completed on the 5-min chart at the 1.618 extension, matches the .618 fib on the larger scale.

Downturn should resume here at 1211.