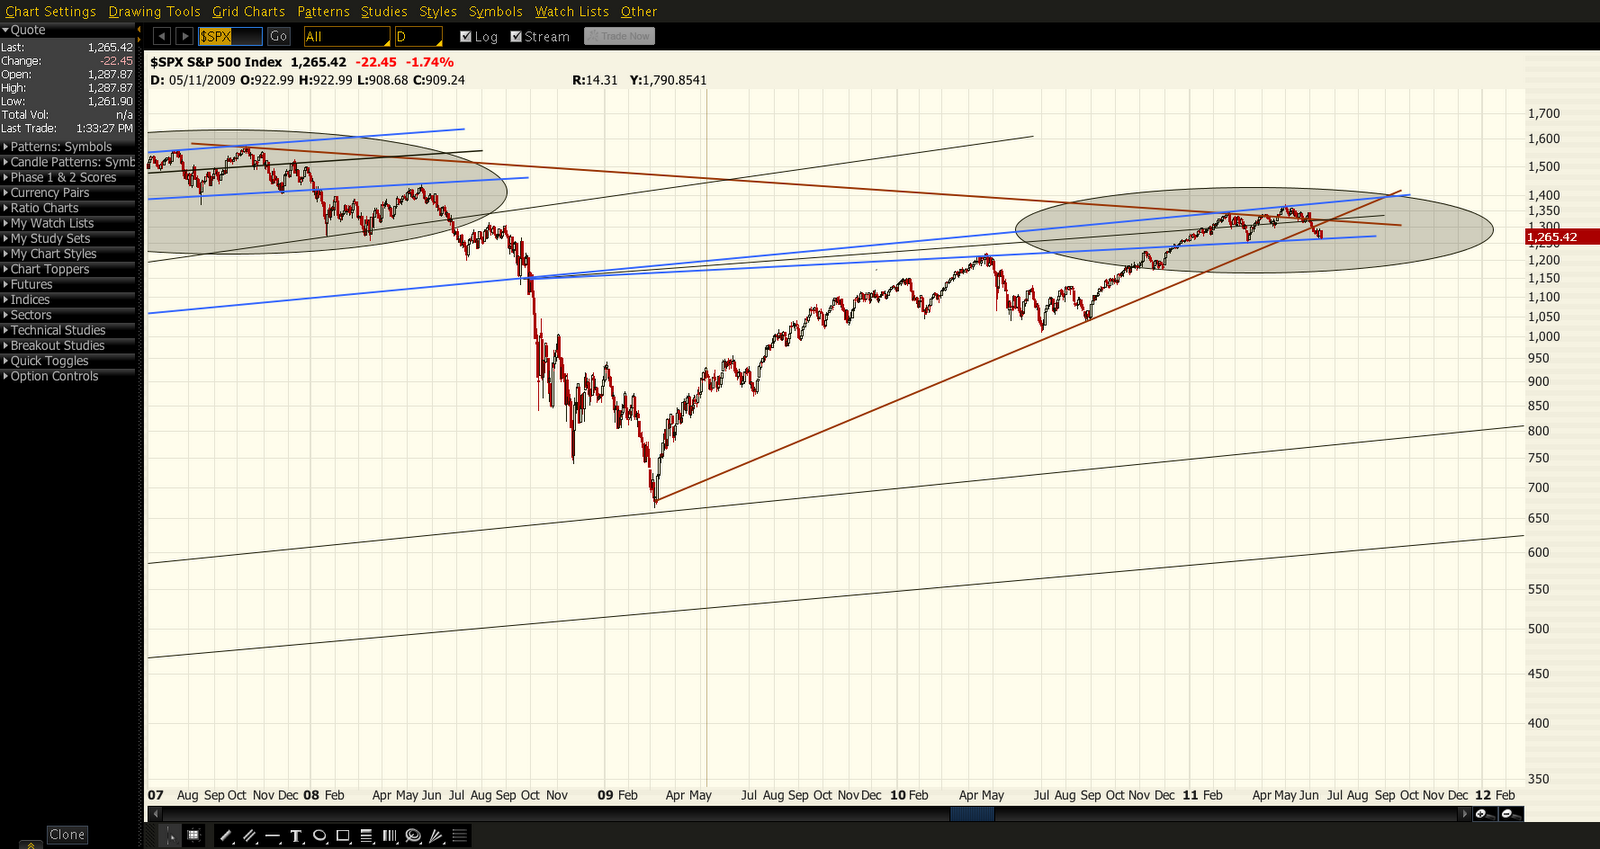
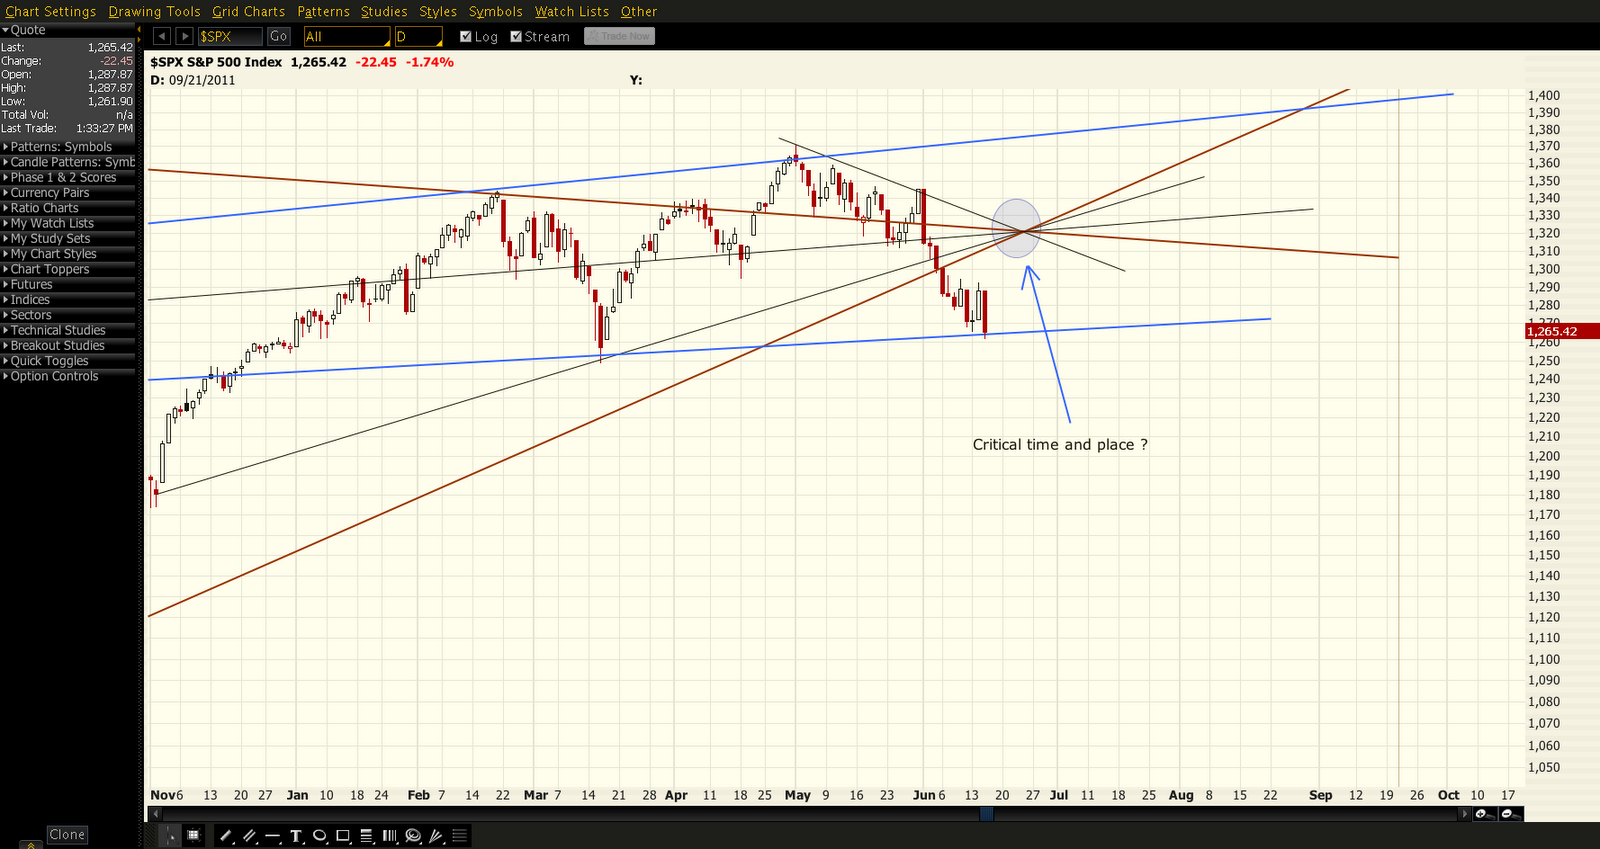
June 8, Deja Vu: Comparisons of this pattern to the 2007 top; expected rebound to 1320 – intersection of rising wedge, fan line from 2007 top, trend line from May 2 top; target date June 29.
June 10, Channel Surfing: Should bounce off 2-std dev channel being established (not the 1249 horizontal support or the 200 SMA), then return to channel midline at 1328-1330.
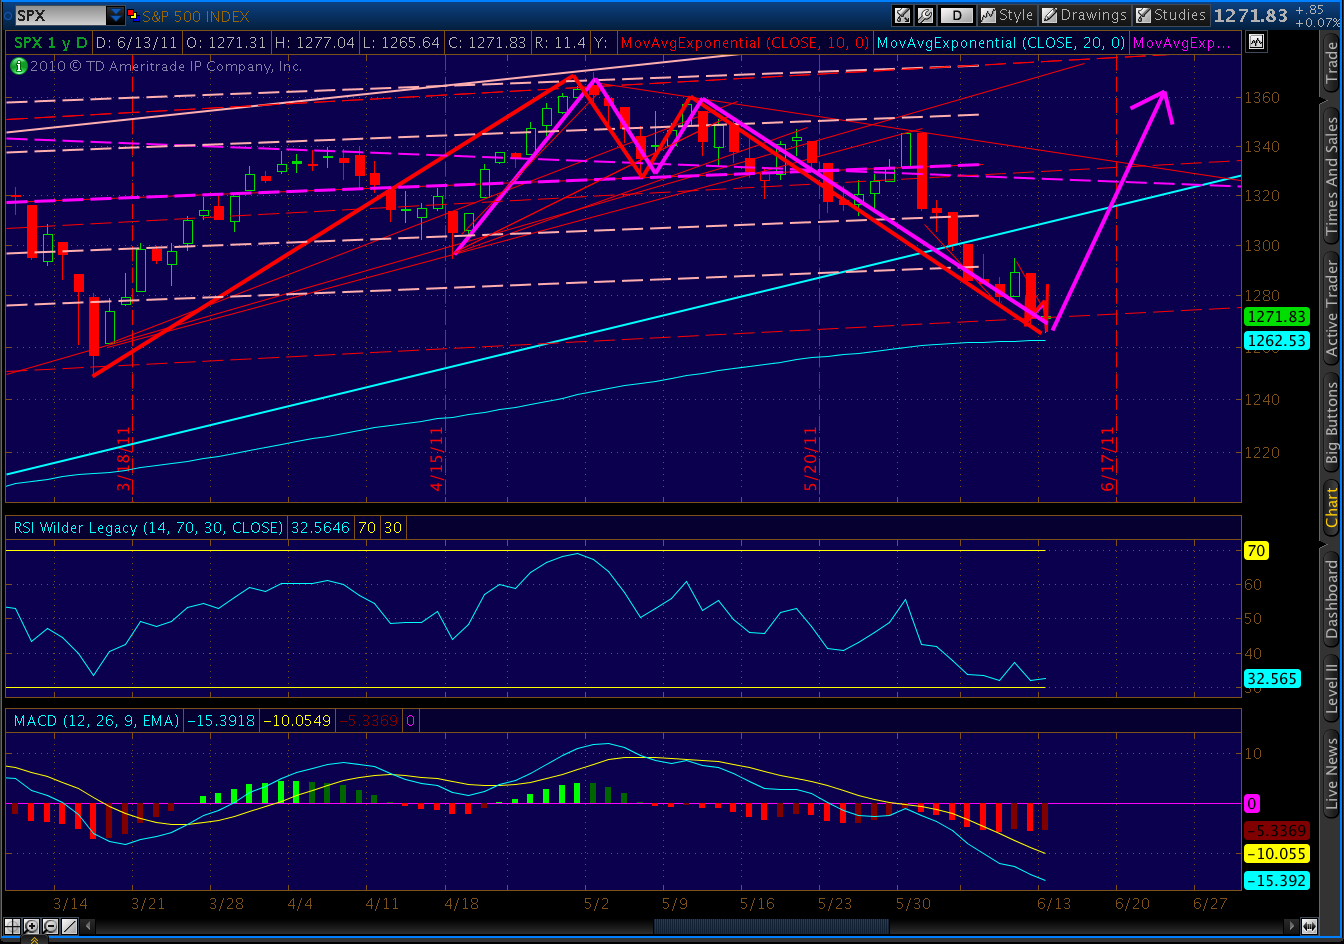
June 13, Matryoshkas: Butterfly inside a Butterfly inside a Crab inside another Crab Pattern — indicated 1329; should return to channel midline of 1329.
June 15, Still Playing Bounce: Called 1261.90 the bottom; target of 1328 on June 21-23.
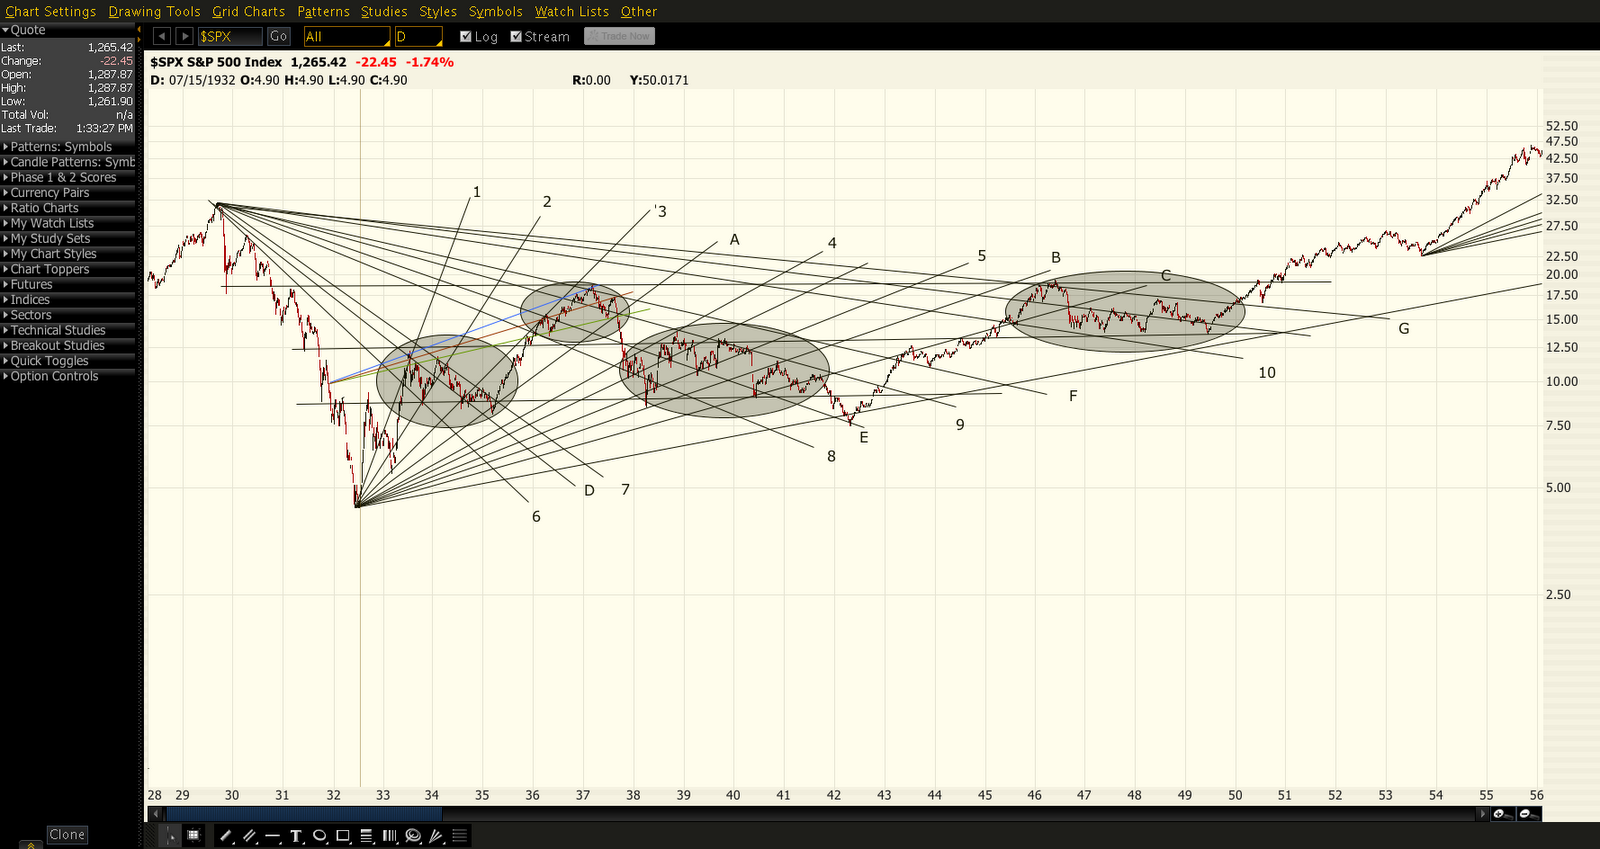
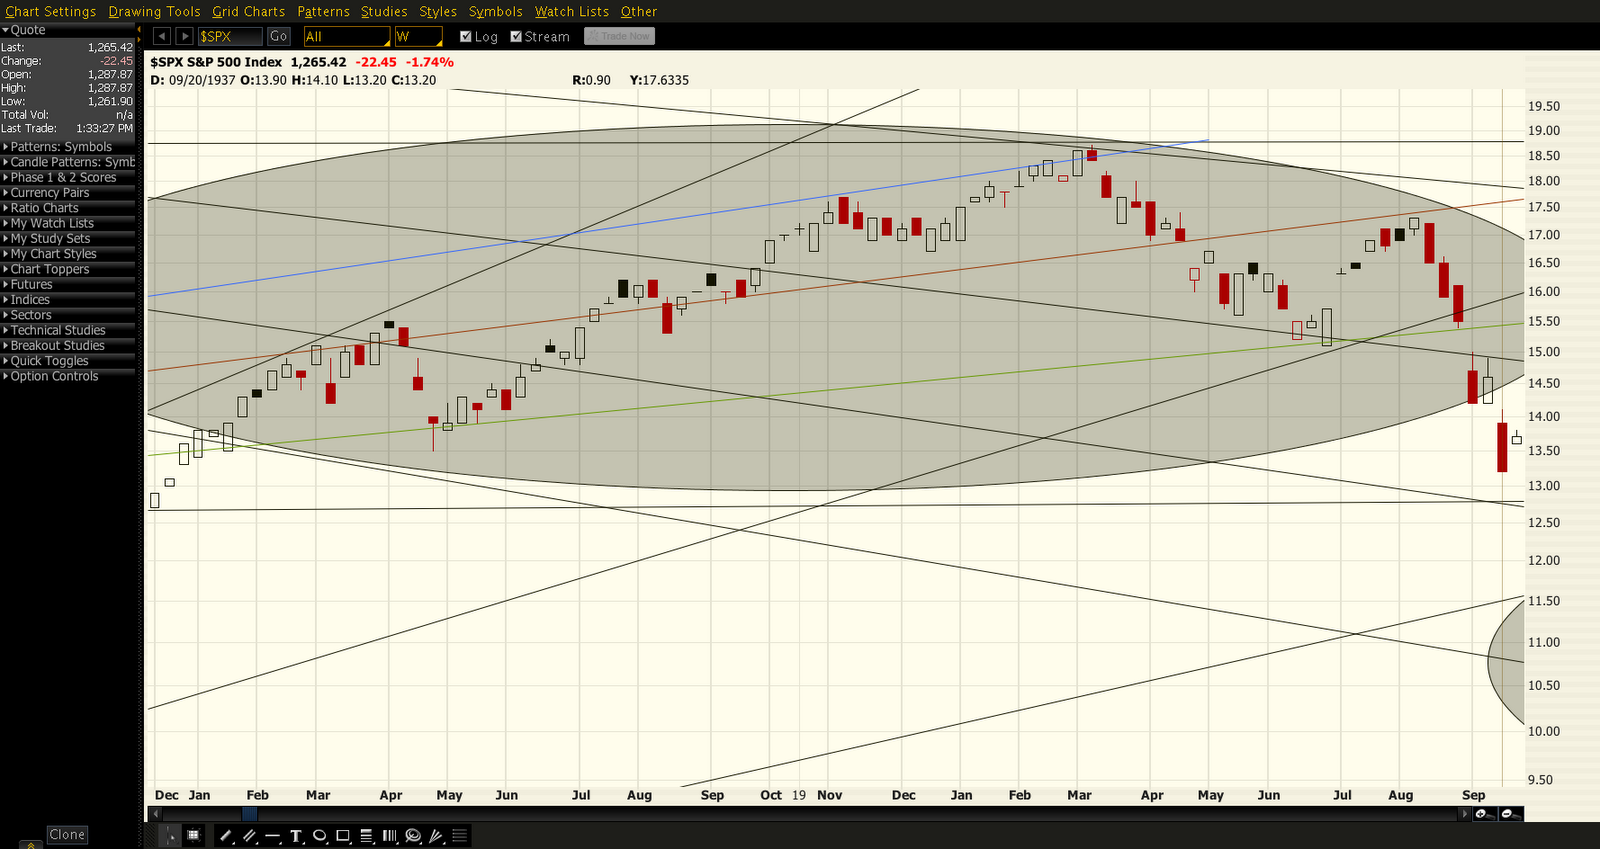
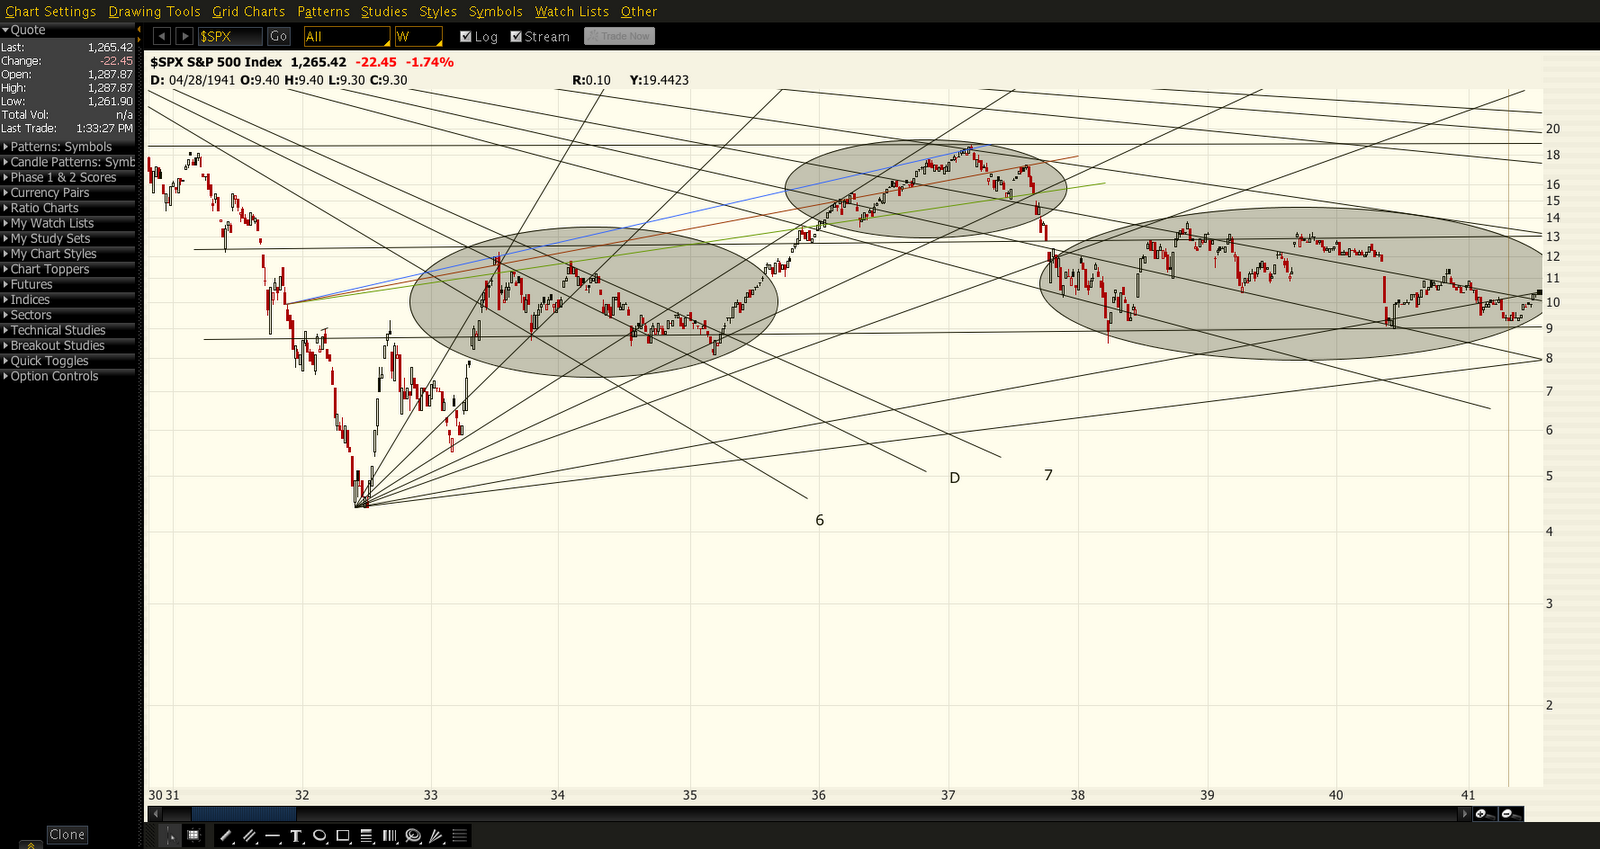
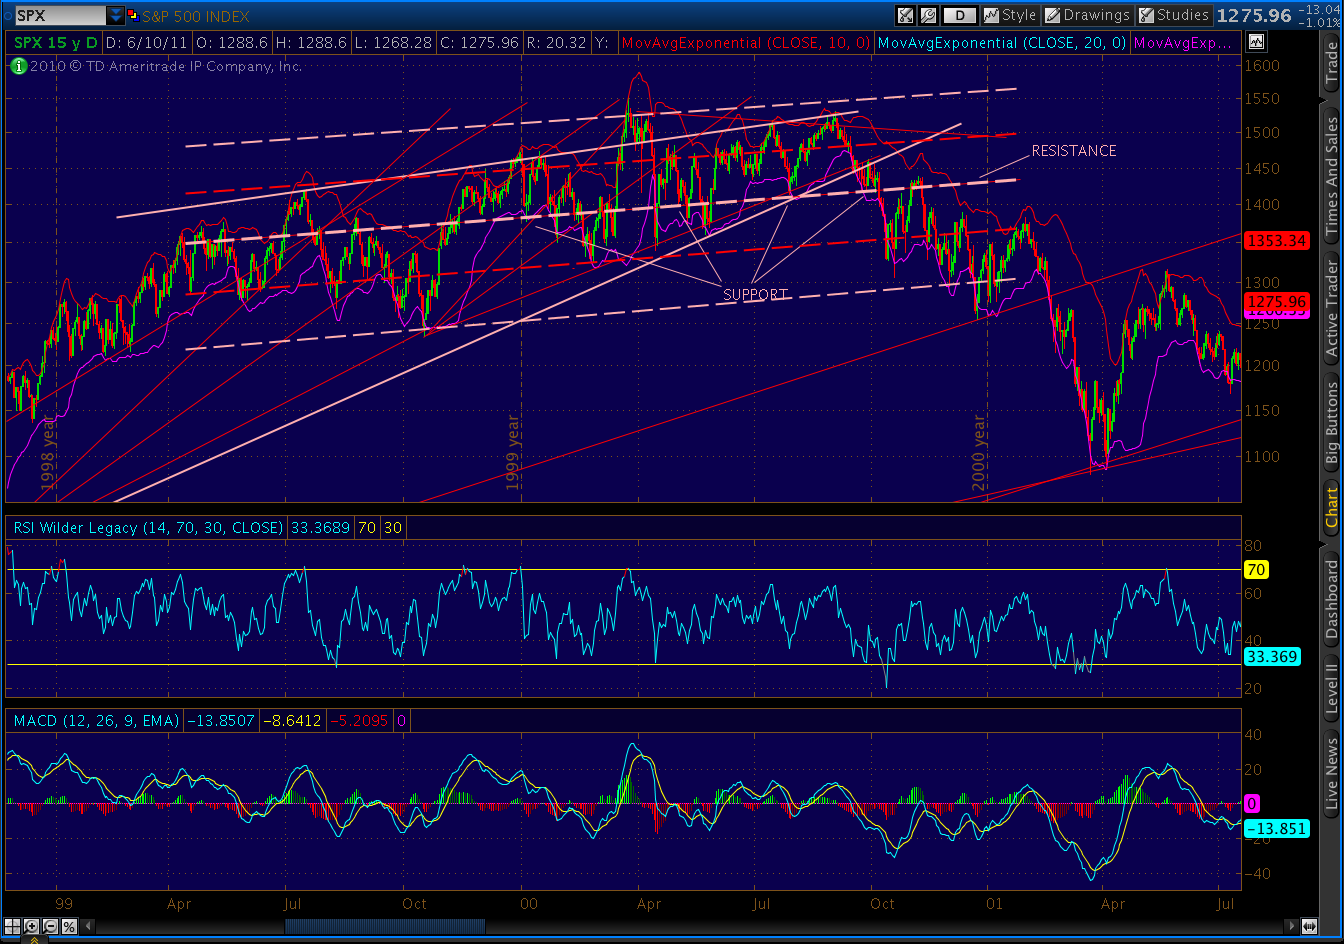
June 16, You’ve Got a Fan: Compared and contrasted 2011 top to previous (2007, 2000, 1938); constructed the fan lines and trendlines guiding the pattern, replaced the concept of 2-std dev channel.
June 16, Intra-day: VIX Butterfly pattern indicated 19.12 first stop, ultimate target below 15.
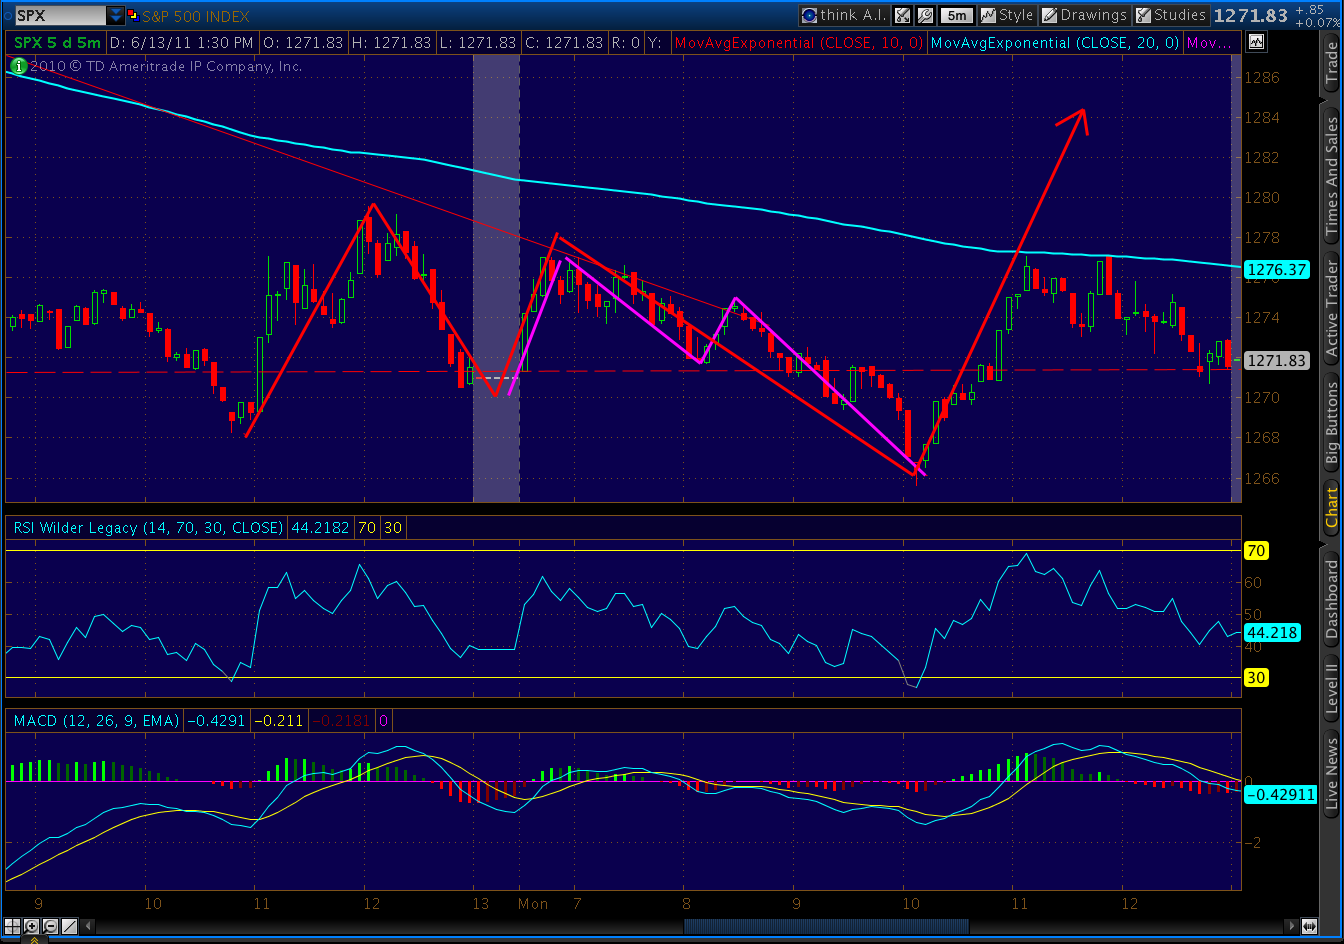
June 17, Intra-day: Inverse H&S; developing on SPX indicated 1300+; H&S; developing on VIX indicated 17.30.
June 21, Different Perspective: Expect pause at 1295, pullback to 1289-1290 to fan line, possible pullback at 1310 to 1285, on way to 1320.
June 22, Intra-day: Pullback should be contained at 1287, might take place of pause expected at 1295.
So, how are we doing?
We obviously dropped through the bottom of the rising wedge since Mar 2009 (log scale), signifying the beginning of the end for the bull market. My 1261.90 bottom call came close; the recent low was 1258.
Since then, we’ve made it just shy of 1299, so the Inverse H&S; worked out nicely.
Yesterday’s pullback to 1286.79 is a tad lower than the 1287 I expected, but close enough for government work. BTW, I consider this action merely a backtest of an important trendline — more on that below.
VIX beat my 19.12 target, is close to my 17.30 target, touching 17.72 both yesterday and today. More below on whether 15 is in the cards.
What’s next?
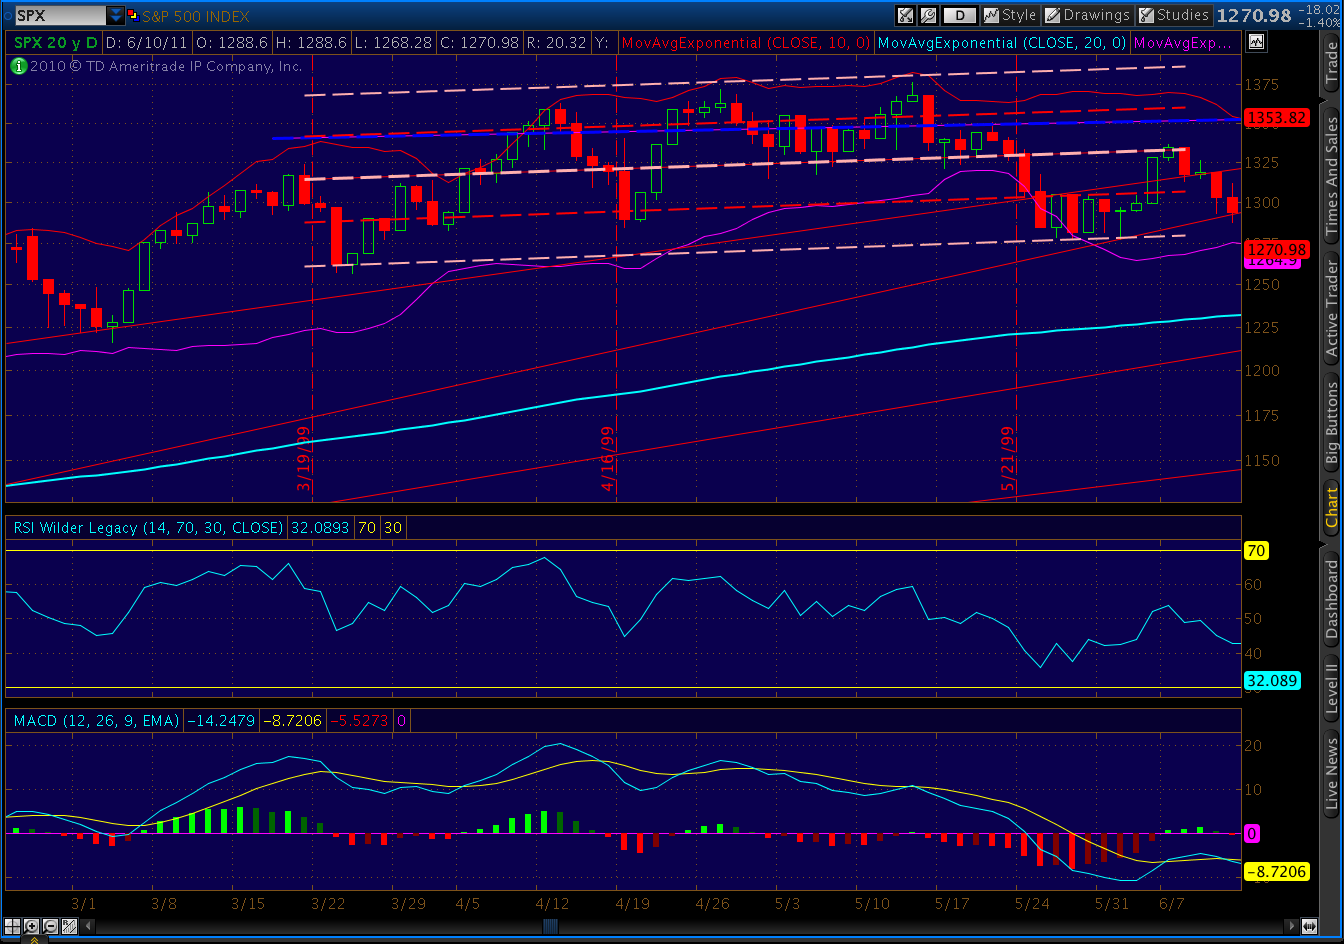
The huge Crab Pattern discussed in Matryoshkas is still unfolding. It targeted 1329, which is within spitting distance of my target. The Inverse H&S; pattern I was tracking completed, and in so doing formed the head of another, larger IHS that’s in the works. This one, also with a rising neckline (white, dashed line) indicates an upside of 1328. I’m also watching a developing rising wedge, indicated below as the red dashed line.

From a technical standpoint, the daily MACD has turned positive and the histogram is back in the black. The RSI is around 45, plenty of room for upside to run. All the other indicators I watch (McClellan, bullish percentage, summation index, etc) are all turning bullish.
I’m still expecting this pullback we saw today (and is continuing overnight) to be contained at 1287, meaning the futures will have to snap back before the open. The hourly futures MACD looks like it’s bottoming (@ 12 am, PDT) and the histogram bottom is in. The RSI is back to the mid 30’s.
We reacted off the 20 SMA, but more importantly, we hit an important resistance line that I’ll discuss below. The more important 50 SMA will be more problematic. It currently stands around 1320, but should increase a few points over the next few days.
Volume has been light, which indicates to me that the masses aren’t fully on board the rally just yet. A strong push tomorrow should take care of that.
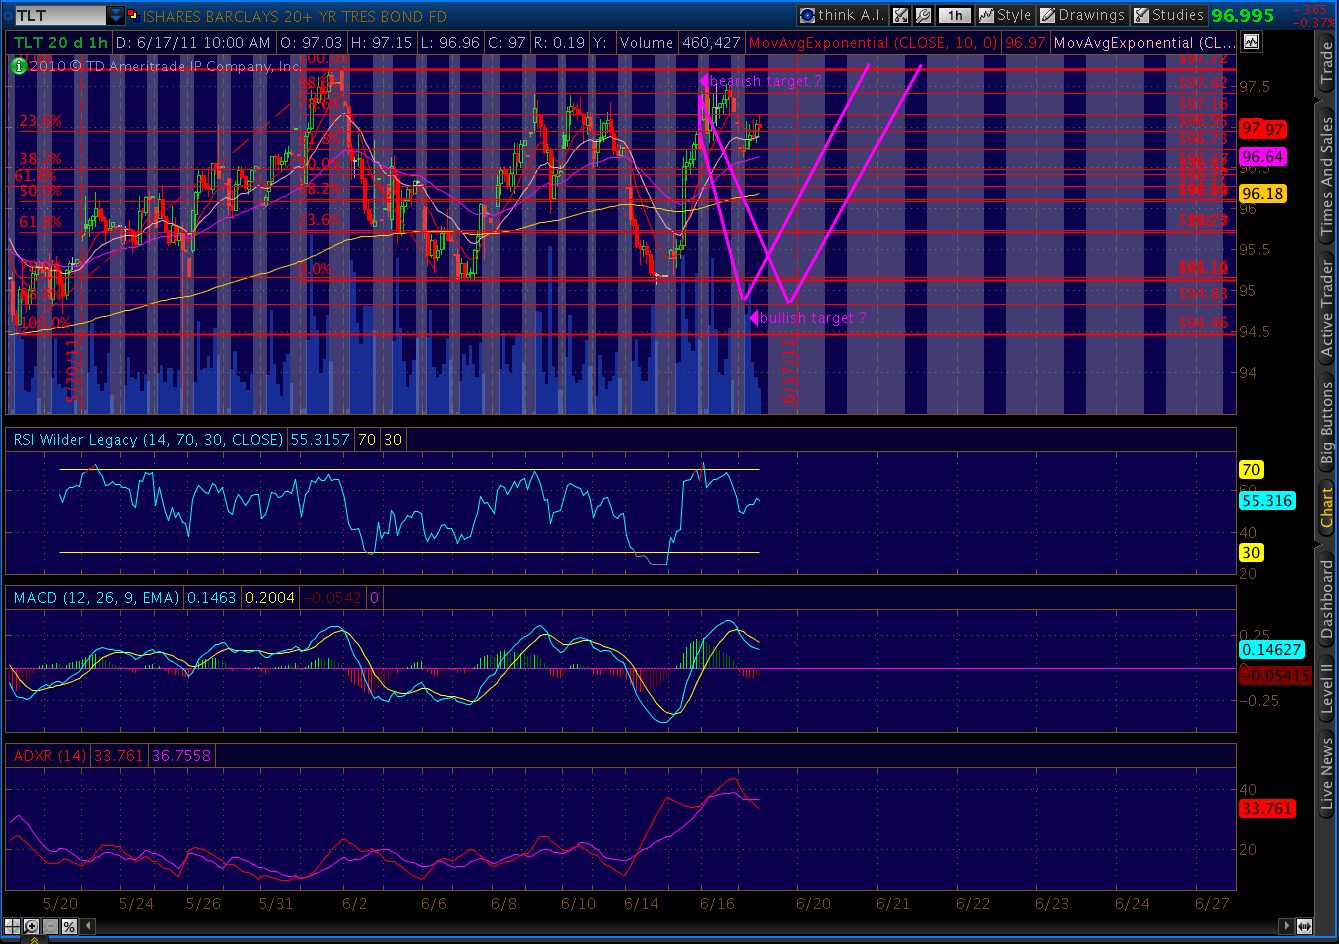
If VIX bumps up at bit in the morning (possible given the futures’ action tonight), then a drop back to around 18 would complete another, larger H&S; (since 6/10) with an indicated downside of 11. Not terribly likely, as we haven’t seen those prices since 2006; but, it’d sure get folks’ attention…

From a fundamental standpoint, nothing in the FOMC announcement or BB’s press conference changed the expectations picture. My biggest takeaway is that BB seemed particularly nervous. His voice quavered like that of a child telling a whopper of a lie. Makes sense, since he no doubt knows that things are much, much worse than anyone’s letting on.
CBO, for instance, announced that our national debt will reach 101% of GDP in just ten years. To put that in perspective: without any improvements, in 2021 we will be where Greece is today. Scary thought, indeed.
Tomorrow morning, we get initial claims and new home sales numbers. I think they’ll either look good, or be spun as looking good. Either way, expect happy, smiling faces on CNBC.
Okay, this post is officially getting too long. I’ll put up some interesting charts in the 2nd installment.