Month: October 2021

  • Charts I’m Watching: Oct 29, 2021

    Futures are off this morning on disappointing earnings/guidance from market leaders (AMZN, AAPL and SBUX) and a significant miss on Personal Income (-1.0% vs -0.3% consensus.)  Meanwhile, the PCE deflator rose to a new 30-year high at 4.4% YoY (core: 3.6%.) More fuel for the stagflation fires…

    continued for members(more…)

  • Stagflation: One Step Closer

    Q3 GDP disappointed, coming in at 2.0% versus 2.7% consensus and Q2’s 6.7%. Not to worry…bad news is good news, right?  Not so fast. With inflation well above target, additional Fed stimulus is on the way out, no matter how much the economy sputters.  According to the Atlanta Fed, that might be quite a lot.

    Because today is a day ending in a “y,” VIX immediately fell following the news, giving bulls a little hope. But there’s no getting around the fact that the GDP slowdown, when paired with high inflation, means stagflation is right around the corner.

    continued for members(more…)

  • The Big Picture: Oct 27, 2021

    Equity markets rarely fail to rally into the end of the year.  But, there have been several noteworthy Q4 exceptions over the years, each of them marked by VIX’s bounce off well-established trend lines.

    Note that SPX’s yellow channel has been rising at a compouned 12.2% per year since the 2009 bottom – historically a very decent rate of return.  With SPX currently testing the channel top as VIX tests the rising purple trend line, SPX is at a critical juncture where it must either correct or break out.

    continued for members(more…)

  • VIX’s Quandary

    Keep a close eye on VIX, which has been humming “Should I Stay or Should I Go” for the past week. The algos are laser focused on this factor above all others, as it will determine whether or not stocks have additional upside potential in the near term.

    continued for members(more…)

  • Charts I’m Watching: Oct 25, 2021

    Futures are up moderately this morning, with algos responding to the continuing meltup in oil and gas.

    continued for members(more…)

  • VIX’s Journey

    Determining what the charts say is usually pretty easy. Determining when central bankers will hit the panic switch is considerably harder.

    When the markets melted down in Feb-Mar 2020, some very important support levels were tested. The Dow, for instance, was propped up precisely as it arrived back at post-2016 election levels — fortunately for Trump.One of the most consistently effective tools in propping up stocks has been hammering vol into submission. The algos and everything which keys off them – about 90% of daily trading volume – pay very close attention to VIX. It’s not an overstatement to say that VIX is the tail that wags the market’s dog.

    VIX had soared from the low teens in late 2019 to 85 by Mar 18, 2020. On that day, two days before stocks bottomed out, it began a punishing journey back to its former lows which continues to this day.

    The falling white channel below is testament to its precision, particularly once the Jan 27, 2021 high was in place. The subsequent highs all represented turning points, with VIX collapsing at the top of the channel each and every time — until Sep 20.

    This time VIX not only poked above the channel top, but remained up there for 13 of the 17 subsequent days. Not only that, but its chart supported/signaled a rise to 32.

    The move was logical in that SPX’s rapidly rising 200-day moving average was almost within 10% of its recent highs and was aligned with the bottom of a channel which had guided the index higher since mid 2020.

    Since SPX had fallen through its SMA50 for the first time in a year, it seemed as though central bankers had tacitly agreed to allow an actual correction, a 10% drop to the 200-day moving average and channel bottom.

    On Sep 20, however, someone pushed the panic button. Since then, VIX has been sliced in half and has fallen back into the falling white channel from which it broke out. Furthermore, it is threatening to break down below a trend line of support dating back to 2017.

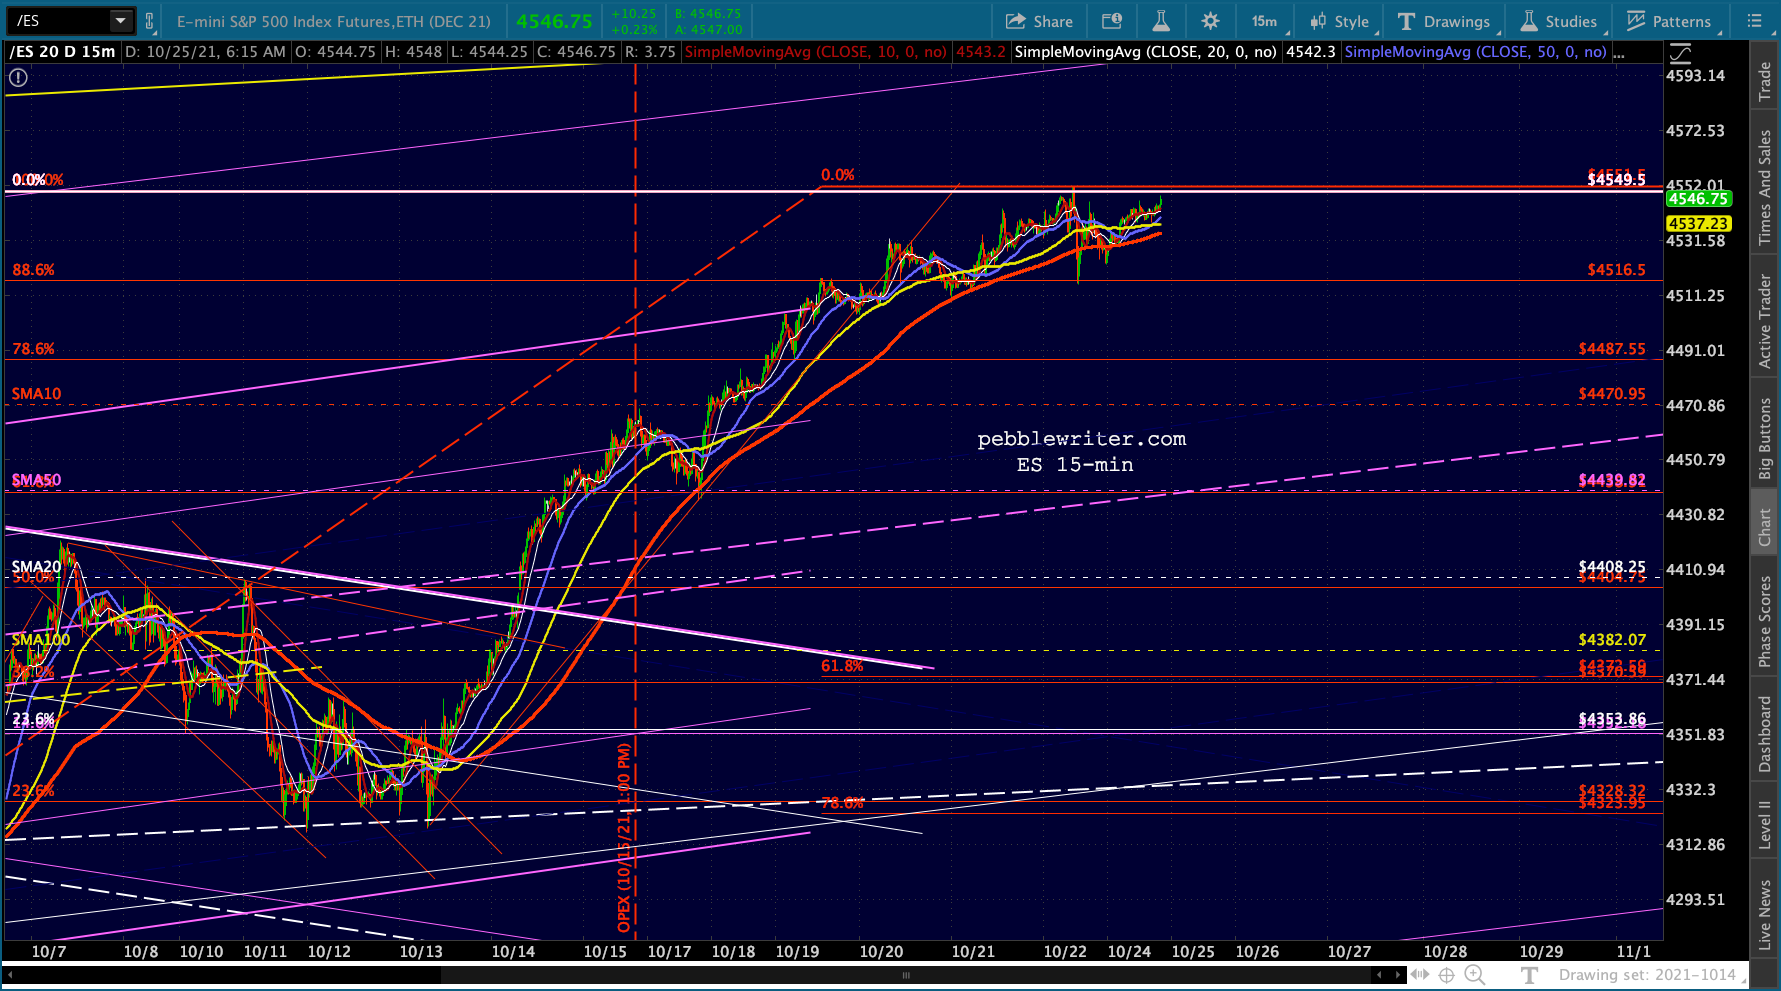
    As a result, SPX broke out of its bearish patterns and made a new all-time high yesterday.  ES joined it today. From a charting standpoint, this busts many — though not all — of the bearish scenarios. I emphasize this is merely a charting or technical analysis perspective. There are obviously a number of fundamental and arguments for higher prices, not to mention TINA, FOMO and BTFD.

    continued for members(more…)

  • Charts I’m Watching: Oct 21, 2021

    Futures are off slightly this morning, passing on the opportunity to make new highs in the after-hours.

    continued for members(more…)

  • Judging the Fed

    In an excellent interview on CNBC this morning, Paul Tudor Jones echoed what many on Wall Street have been thinking and we have been writing for the past year or so.

    Has the Fed committed a policy mistake? Most certainly. Even more outrageous, it did so deliberately.

    If yours truly, sitting in his home office with a Mac Pro and a public school MBA, can accurately forecast soaring CPI long before the convenient supply-side disruption pretext came along — then the Fed’s brain trust of MIT grads with supercomputers certainly saw it coming even sooner. How did they respond (besides protecting their own portfolios)?

    1.  changed their inflation target language to accommodate higher inflation
    2.  lied about their expectations of it being transitory
    3.  continued to pour $120 billion per month into fixed income markets
    4.  manipulated interest rates lower with said injections of QE
    5.  thereby eliminating price discovery in bond markets, potentially permanently
    6.  reinflated bubbles in virtually every financial and real asset market
    7.  reduced housing affordability to 13 year lows
    8.  enriched the top 10% of Americans by $17.5 trillion
    9.  subjected the bottom 50% to contracting real discretionary income

    The kicker is that they are still pouring $120 billion into the markets every month, even though they have publicly admitted that inflation has “surprised” to the upside and is not transitory. This is in stark contrast to Powell’s assurances that the Fed would use its “tools” to prevent such an occurrence.

    Now, I don’t for a minute believe the Fed is an evil cabal bent on ruining the middle class and subjecting the poor to unbearable hardship. I believe they entered into the latest round of QE with the intention of staving off an economic collapse and saving financial markets from crashing even further. They successfully accomplished this.

    But, somewhere along the way, probably in June 2020 as SPX fell below its 200-DMA for the second time, the conversation turned to making sure the rally continued. It took almost 10 weeks, but on Nov 4 SPX rose above 3393 for the last time.  It hasn’t looked back, bouncing on its 50-DMA over and over until last month when it finally backtested its 100-DMA – registering a meager 5.9% decline.

    The Fed has demonstrated the astounding power of its tools: ever-increasing oil prices, currency manipulation, interest rate manipulation, and the periodic crushing of vol. But, it has caused, not moderated, higher inflation.

    continued for members…
    (more…)

  • Netflix’s Big Day

    I love charting NFLX. It’s one of those stocks whose chart almost always makes perfect sense regardless of the fundamentals or the news of the day.

    The last time we discussed it on this website was Sep 10 when it looked vulnerable to a pullback.

    I’ve had a couple of inquiries about NFLX. The charts are not positive at the moment – not since it topped out in the rising white channel after seeing its huge rising wedge break down.

    It was a bit of a gimme, and the stock slid almost 8% before stabilizing. Several other reversals have been just as easy to pinpoint [HERE, HERE and HERE.]

    Since the company is releasing earnings today and seemingly everyone is watching it closely, let’s see what the charts show.

    The gently rising white channel was broken out of on Oct 5 and NFLX completed a nifty little Crab Pattern good for a 13.6% gain from its Sep lows.The breakout and backtest, combined with a very deliberate and carefully constructed rising wedge [thanks, no doubt, to timely share repurchases] makes for a very bullish looking chart.Does that mean it’s destined to continue higher?  We could go ’round and ’round regarding the news/controversies (Dave Chappelle, Squid Game, etc.) and its overly aggressive (IMHO) production slate, and its considerable competition.

    But, at the end of the day, NFLX’s chart tells us all we need to know. In this made-to-order market of ours, buoyed as it is by central bank liquidity, share repurchases and zero interest rate policy, the company is likely to do whatever it takes to remain above the white channel top at 619ish – only 2.8% below current prices.

    Should it fall below 619, that rising wedge will have fallen apart and the Fibonacci Pattern targets would come into play, targeting the mid-500s.

    Stay tuned.


  • Charts I’m Watching: Oct 19, 2021

    The breakout is in full bloom, raising the question of whether it’s a deep retracement or the path to new highs. VIX’s recent breakdown and bearish (bullish for stocks) 10/20 cross would argue the latter…

    …though lower lows would be more convincing.

    continued for members(more…)