

Equity markets rarely fail to rally into the end of the year. But, there have been several noteworthy Q4 exceptions over the years, each of them marked by VIX’s bounce off well-established trend lines.
Note that SPX’s yellow channel has been rising at a compouned 12.2% per year since the 2009 bottom – historically a very decent rate of return. With SPX currently testing the channel top as VIX tests the rising purple trend line, SPX is at a critical juncture where it must either correct or break out.
 continued for members…The ability of VIX to drive equities higher is well established. So, bears are smart to be cautious when it lingers so close to a breakdown point…
 …particularly when its RSI supports the idea of a breakdown.
 We have taken a few stabs at identifying the point at which a backtest of its SMA200 might make the most sense, with the latest attempt dashed just last week when ES/SPX broke out of their falling white channels around OPEX.
 We often find that when ES/SPX breaks out of a falling channel, it backtests that channel at the original or a significant downside target.
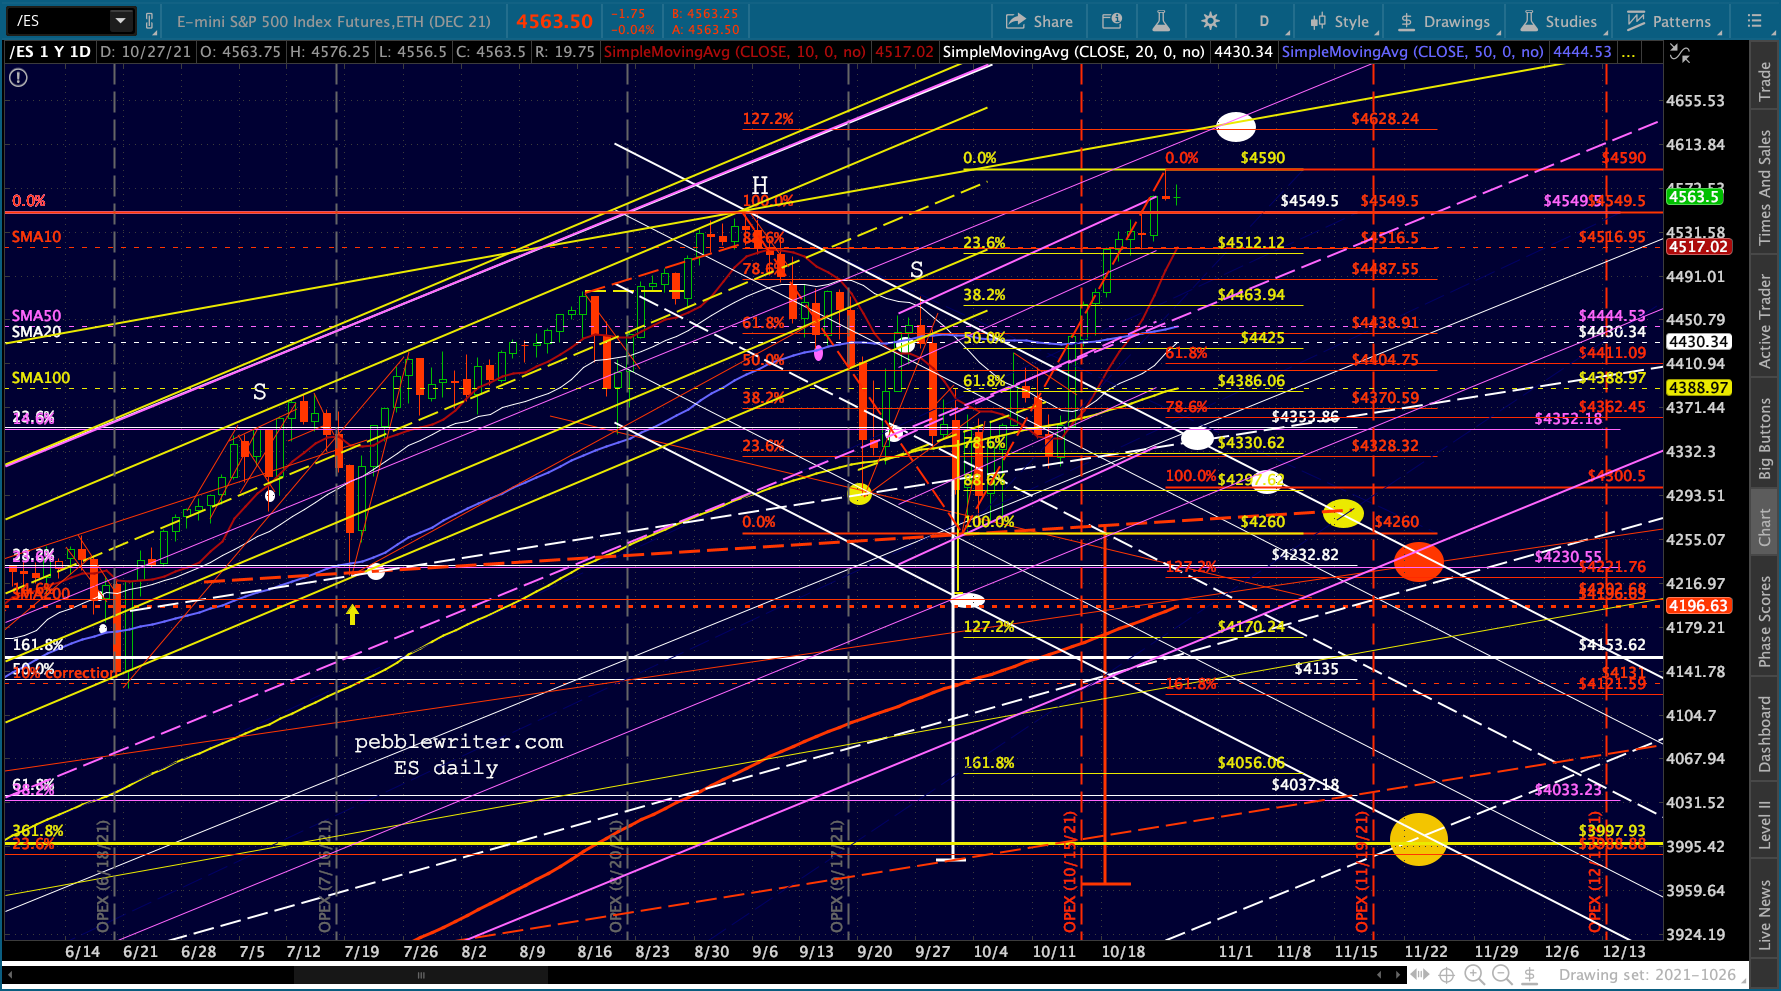
 The Sep 2 high seemed like a reasonable top, as it intersected with the yellow channel top. But, it would have required a breakdown of the rising white channel in order to reach the SMA200.
  But, that white channel is a bit of a cheat, as it fails to take into account the 2H 2020 lows.
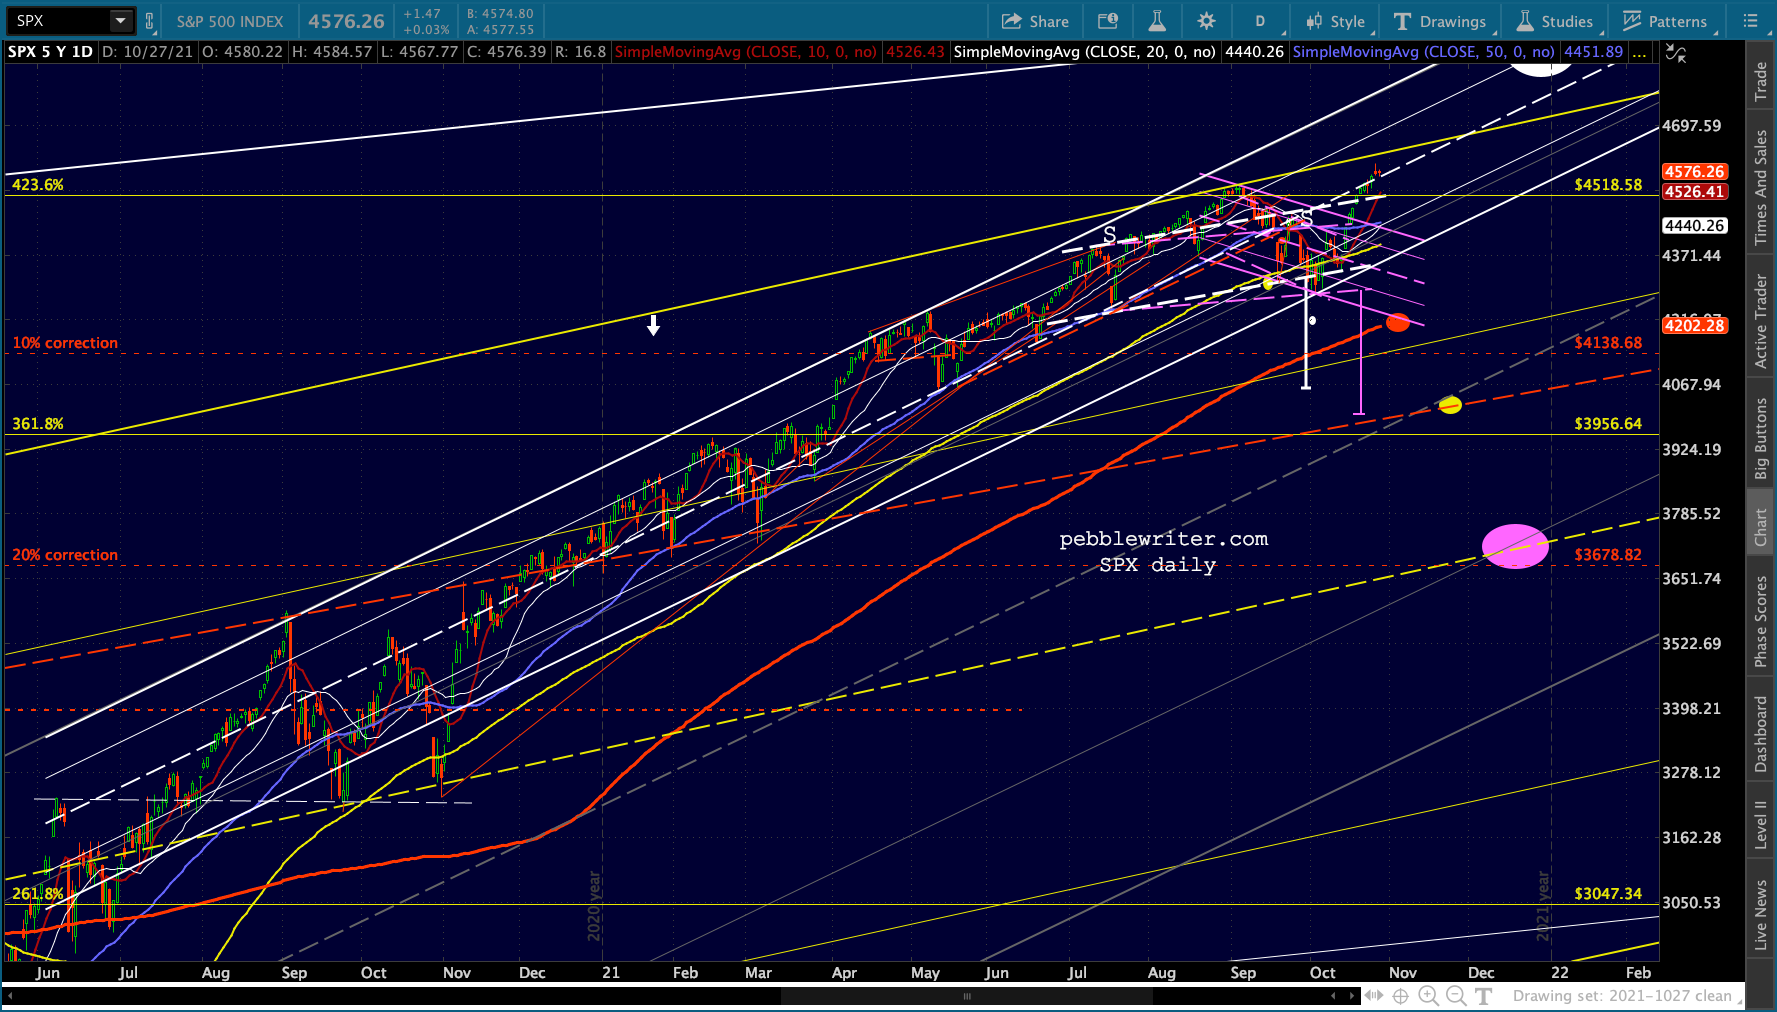 If we expand it to take those into account, we get an equally legit channel with more room for downside that, as it happens, would include the SMA200 if it were to occur in early November – ideally Nov 2-3.
 That leaves us with more logical rising channel which still slams into the yellow channel top and — is still not as wide as it could be.
 If we were to expand the channel to include the 2020 lows, we’d get something like the purple channel below. Note that the midline of this larger channel intersects with the dashed red TL and the yellow 3.618 Fib (which was never backtested) in mid-November.
 If that that support were to fail, the next support would be a 20% correction which marks the intersection of the white .382 and the yellow channel midline at 3678. This is a reasonable target as the yellow channel is primary channel from the 2009 lows.
What do the factors suggest?
We talk a lot about inflation, but what that really boils down to is interest rates. The 10Y charts are a little difficult to decipher up close… …but if we back out and compare them to SPX, they communicate quite a bit. TNX’s rallies to the top of the purple dashed TL all corresponded to equity rallies. Reversals off of it corresponded to equity tops. In 2000 and 2007, the resulting declines were huge. While in 2018 the drop was limited to 20%.
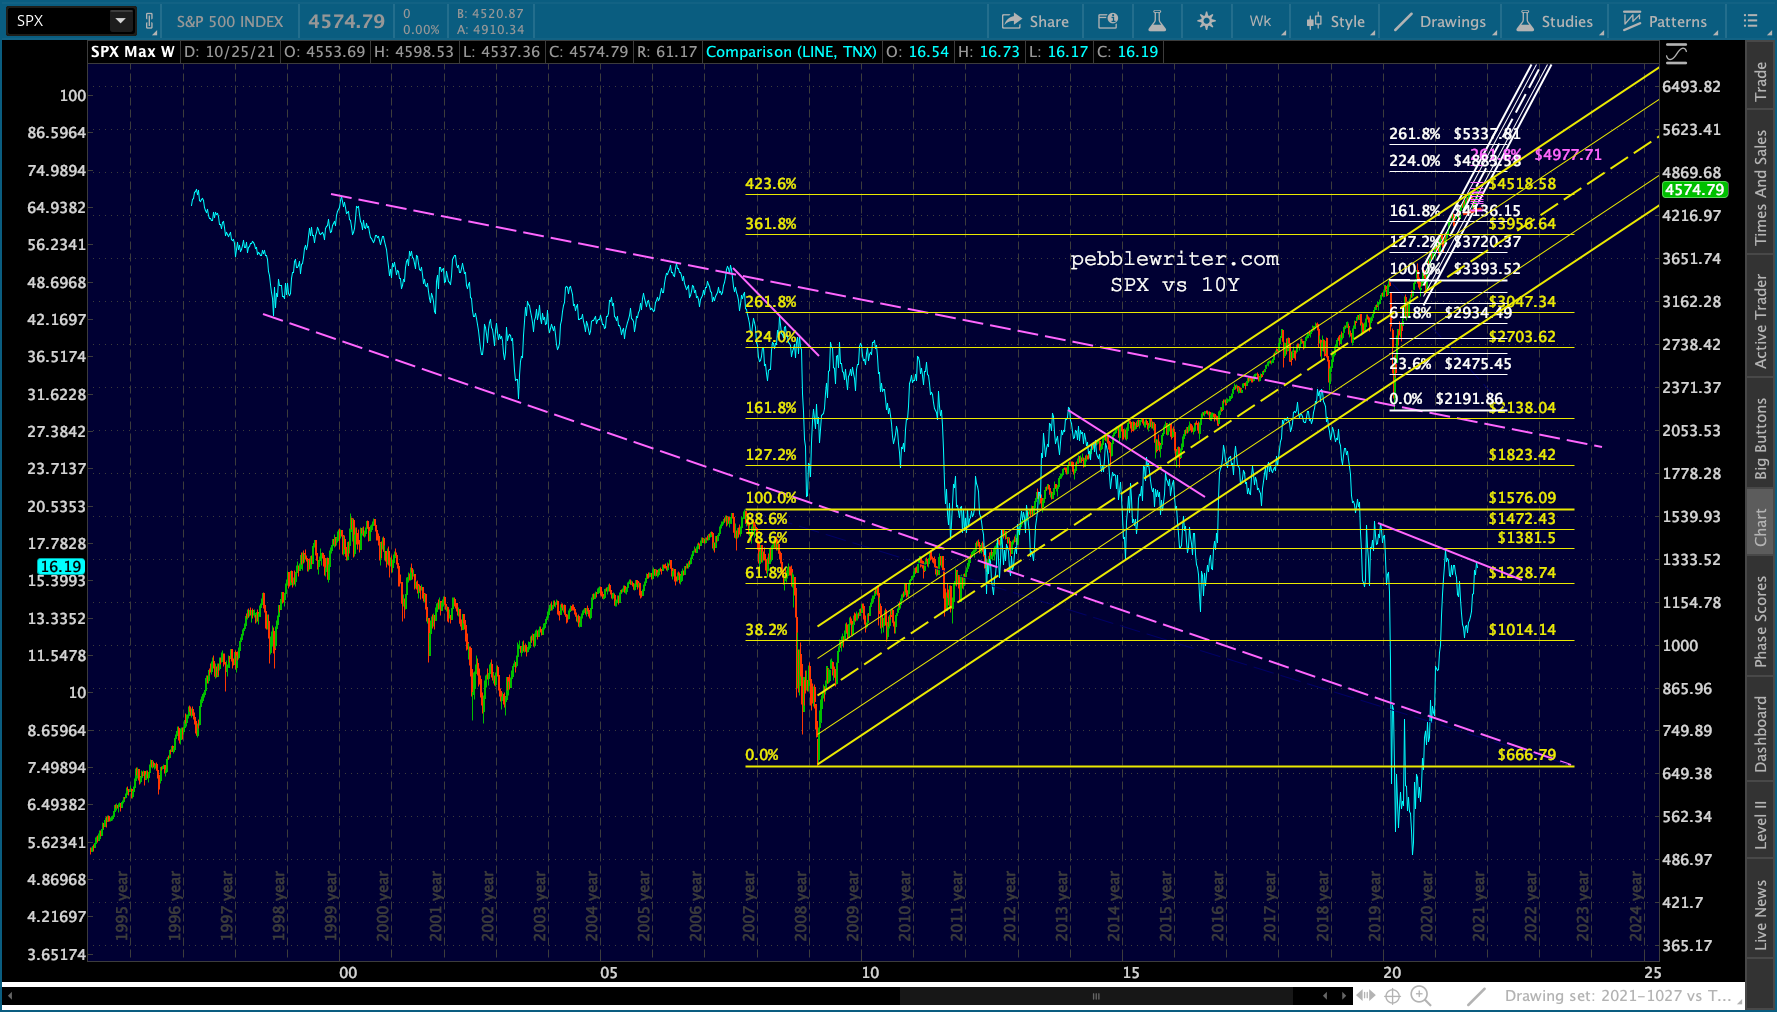 We’ve beat this drum many times, but remember that the TNX peaks are highly correlated to peaks in CL.
 Unlike its 2008 and 2014 reversals, CL’s plunge following its 2014 reversal was interrupted by a 14-month bounce. When it finally petered out in Jan 2020, that’s when TNX and CL both plunged to historical lows.
In short, rates have always reversed when they were faced with the prospect of a major breakout. And, oil prices have always reversed shortly thereafter. What, then, are we to make of CL’s recent breakout – the Sep 27 pop above the red channel top in the chart above?
Bottom line…it is an unfortunate situation that is now recognized as a problem. Reflation was considered a good thing for quite a while. It was a sign that the economy was recovering and that dangerous deflation was no longer a threat.
But, the “recovery” went too far. As we’ve been discussing for many months, the pressure that excessive inflation put on the bond market was fine as long as the Fed was able to keep interest rates under control. Controlling interest rates isn’t that difficult when you have $120 billion to sink into bonds every month.
But, all that bond buying was also a form of QE, swelling the money supply to the point where stocks, bonds, real estate and commodities all became overpriced. Bubbles everywhere.
Despite the Fed’s insistence that inflation was transitory, the Fed’s actions themselves ensured that inflation initially confined to oil/gas soon spread to a wide array of goods and services. The only way to bring inflation back under control is to get those prices back down where they were. That means taking the punch bowl away (an aggressive taper, at the very least) and allowing all those bubbles to deflate. If that doesn’t work, look for a more forceful approach.
If the 10Y pushes above the current TL shown on the chart below, it would mean that CL is still advancing sharply and inflation is very much out of control. The 10Y could easily reach 2%, with the attendant damage to the real estate market and highly leveraged corporations.
Central banks lucked out in Oct 2018 when the Saudis had journalist Jamal Khashoggi killed and dismembered. Crown Prince MBS became an instant pariah and needed a friend. Enter Donald Trump, who had been complaining to no avail of high oil/gas prices for months. Trump shielded MBS and, in return, oil/gas prices nosedived. Inflation, which had recently reached nearly 3%, was back below 2% in a jiffy. Interest rates also nosedived. Problem solved.
Now, gas prices have continued to climb. In Oct 2021, the YoY increase came in at 54.03% – near the Apr/May all-time highs. Unless gas prices drop dramatically in November, the YoY change will be over 58%. If prices were to remain flat through July, the YoY change would remain over 50% through December before finally tumbling lower.
 This would mean at least a couple more months of 5%+ CPI – which the Fed has discovered is problematic in many ways – not the least of which is those other categories of expenses which have joined energy in nosebleed territory. There are only two categories featuring inflation of less than the Fed’s 2% target.
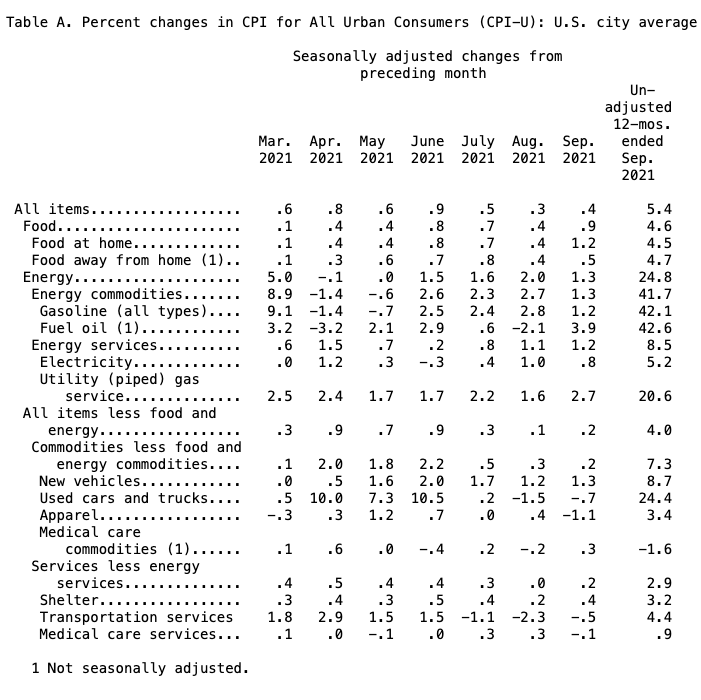 I don’t know how in the world the Fed can put the brakes on all those categories at once. It’s hard to short apparel or food prices into submission. So, they’re stuck with the traditional way of attacking inflation – raising interest rates (starting, of course, with tapering the amount of money they’ve been flooding the markets with.)
Taking strong action would, of course, put the hurt on stocks. It would also, as we learned in March 2020, knock interest rates down by quite a bit. How bad would it be?
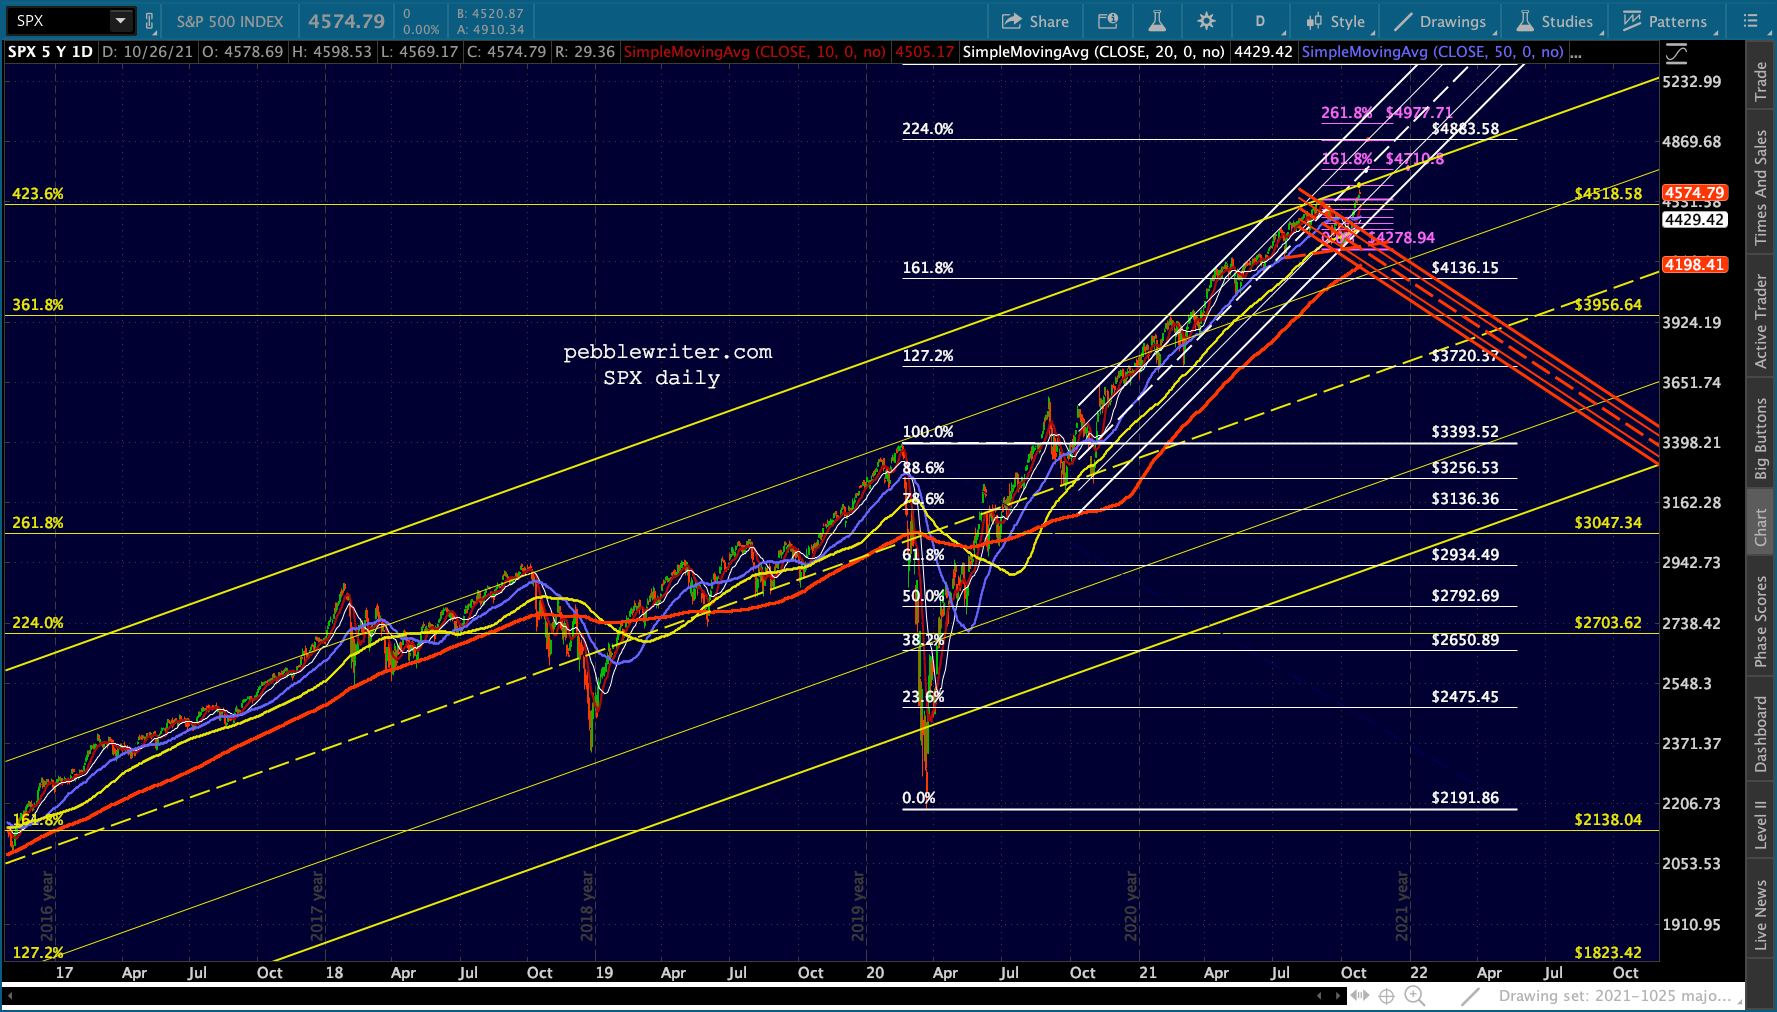
I suspect ES will top out around 4615 and SPX around 4596. A 10% correction in both would put them back at their 1.618 extensions (of the Feb-Mar 2020 drop) of 4153 and 4136 respectively. It would also likely result in the 10Y being knocked back to the .236 line of the rising purple channel at 1.08% or even the bottom at 0.92%.
 It wouldn’t solve the inflation problem, but it would solve the interest rate problem temporarily – at least until the YoY price picture self-corrects – as long as oil and gas prices at least level off. If they don’t, then CPI will remain high and interest rates will break out about the 1.7% threshold that has been an impediment thus far.
Remember, the only way the Fed was able to hold it to those levels before was by pumping $120 billion monthly into markets – no longer an option.