

Futures are up moderately this morning, with algos responding to the continuing meltup in oil and gas.
 continued for members…
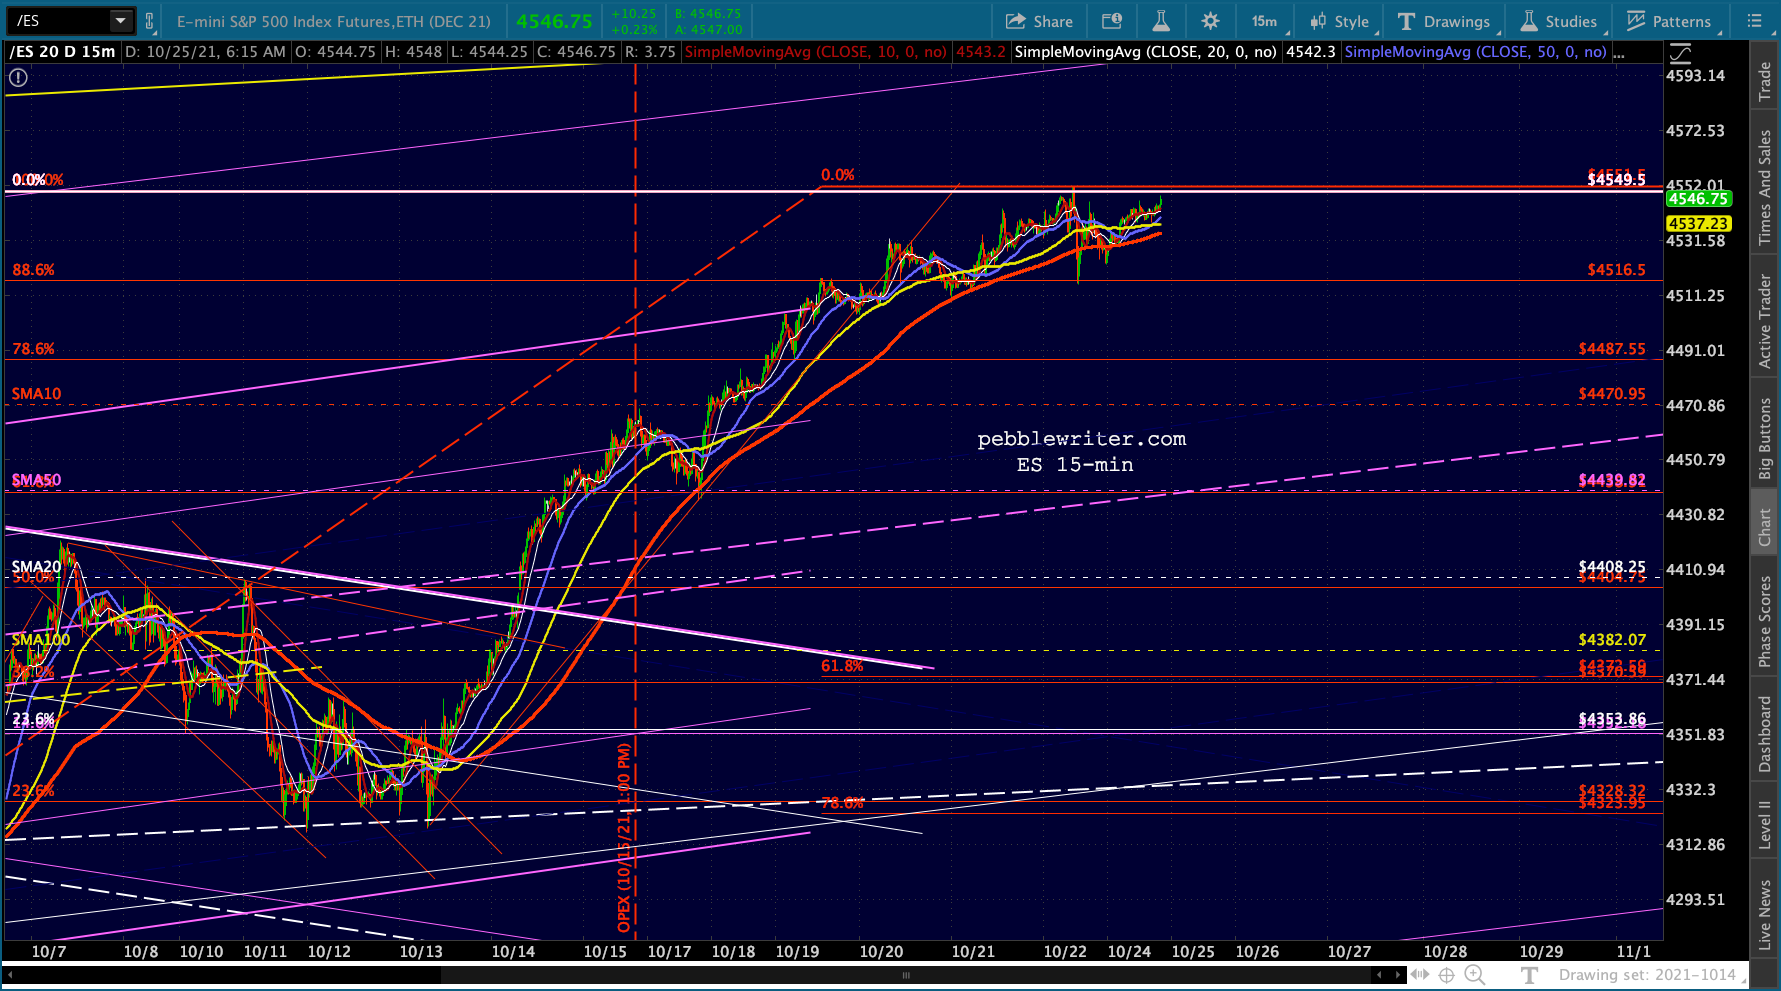
Though ES has yet to move decisively above its former highs… …SPX already has.
 Since ES is the one which pays more attention to chart patterns, I’m more interested in its failure to break out than I am in SPX’s apparent successful breakout.
Given VIX’s proximity to its channel bottom…
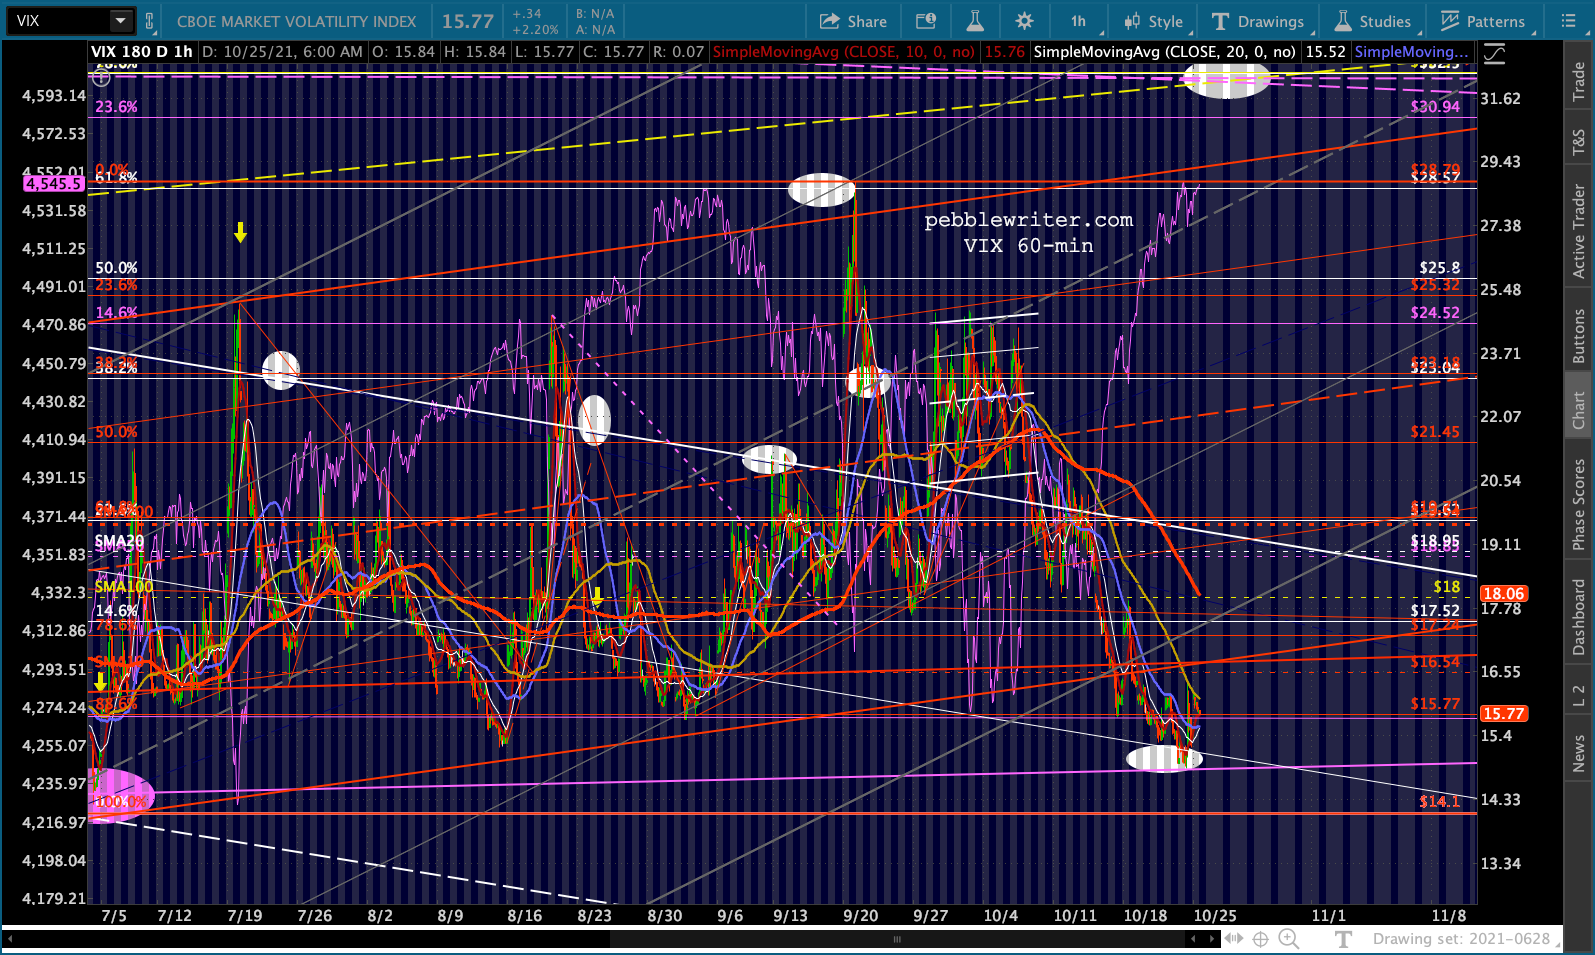 … ES/SPX’s position leaves them in a place where it would be quite easy to make new highs. But, until VIX breaks down, it is more likely that SPX/ES are biding their time, waiting for their SMA200s to get to a point where they can backtest without damaging the uptrend.
SPX came very close to completing a nice little IH&S, but the left shoulder was slightly too low. Either way, a backtest of the potential neckline (SPX 4380ish) would make sense. The equivalent in ES would be 4350ish (also the neckline of the white H&S) with a secondary downside target at 4280ish (the red H&S neckline.)
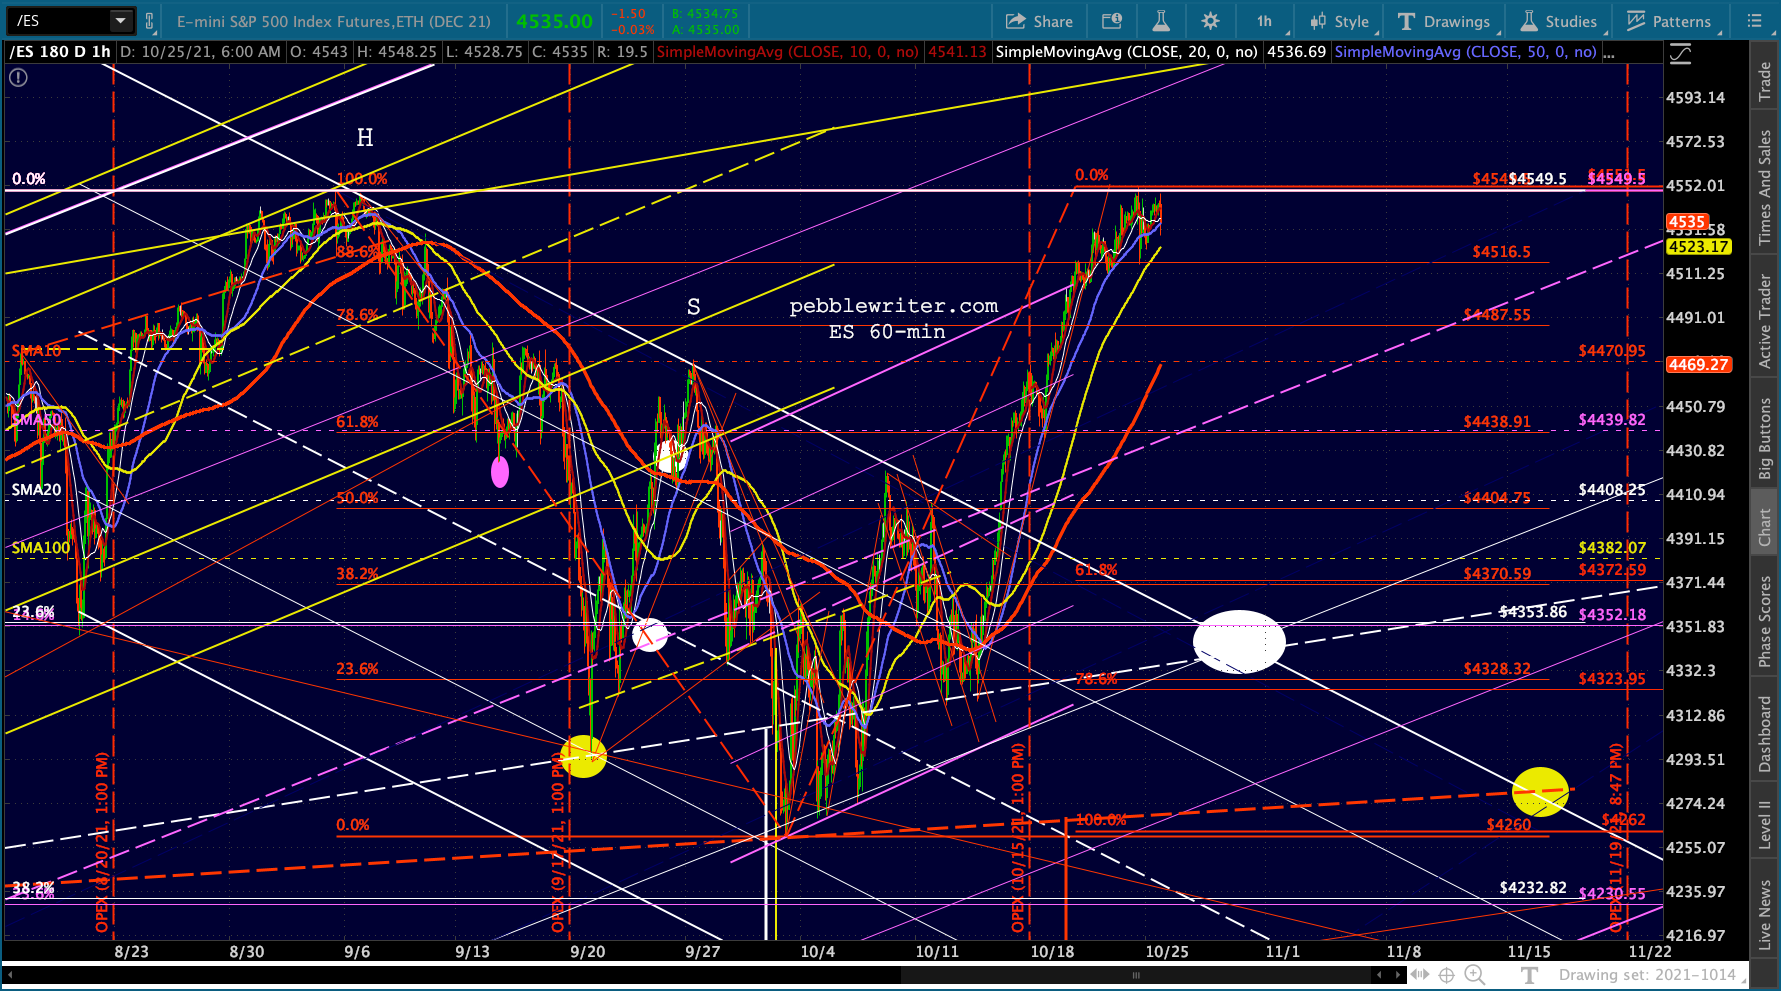 I like the lower of the two targets from the standpoint that it would correlate time-wise with a potential backtest by DJI of its triangle.
 Other arguments for a reversal here…
USDJPY’s ongoing reversal, presumably to backtest its SMA200 or one of these recent TLs. DXY’s potential breakout remains a threat to stocks…
 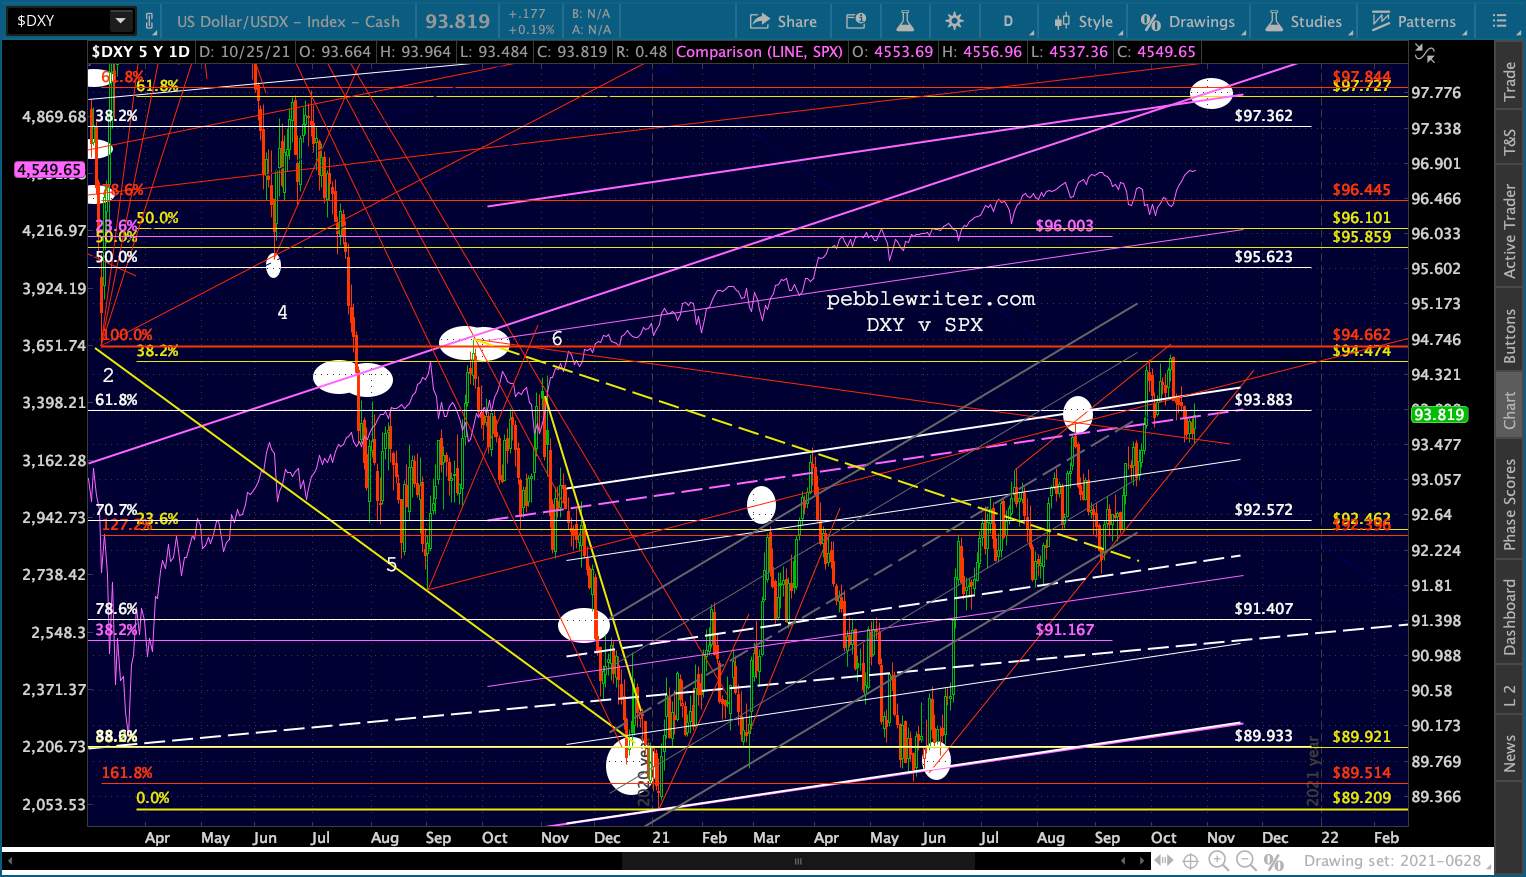 …though EURUSD’s sideways chop has kept it from doing so thus far.
 CL is coming up on the top of its rising white channel – a potential turning point. It’s probably close enough to be shorted here at 85.23.
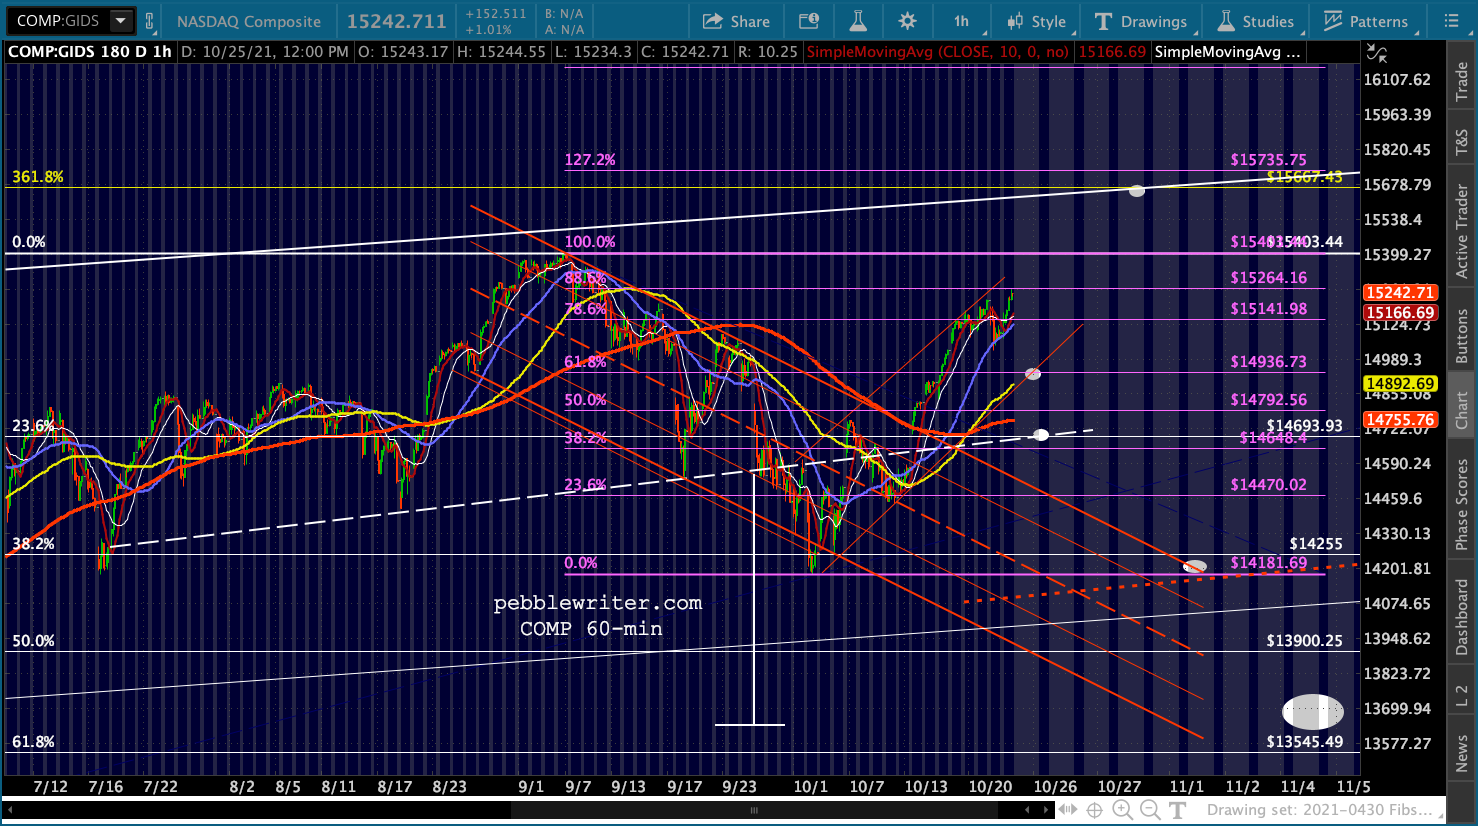
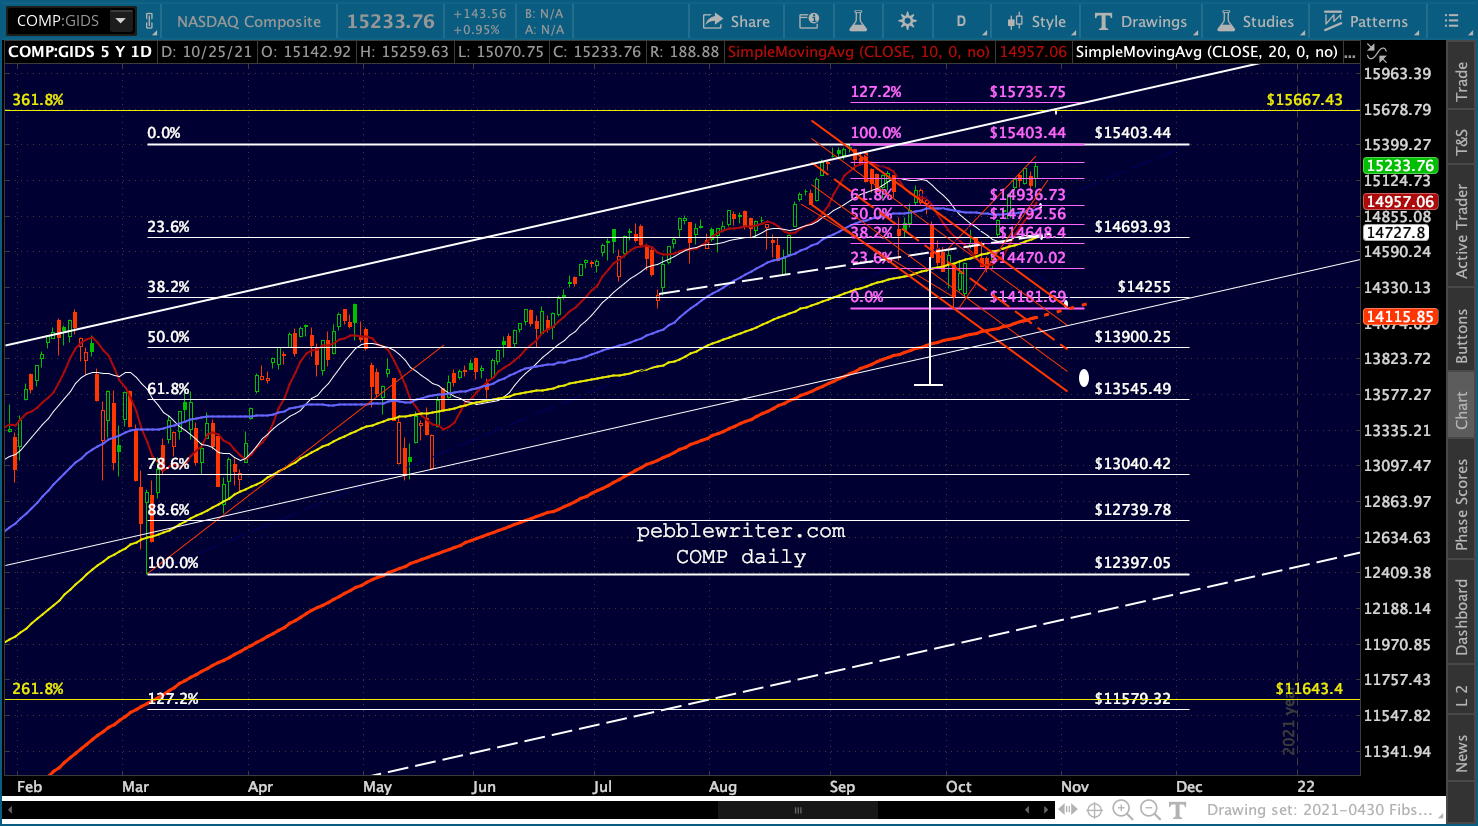
While RB already topped last week. My last argument for downside from here is COMP. Note that it brushed up against its .886 today, with the H&S Pattern still in force. A decline to the SMA200 (the dotted line) would take it back to horizontal support around 14180. While a 10% drop would land it very close to the original H&S Pattern target at 13,700.
* * *
If we don’t get a reversal here, what is the upside potential? There are two important Fib grids to consider: the yellow one set up by the 2007-2009 crash…  …and the much smaller white one set up by the 2020 crash.
 The yellow channel top is perhaps at least as important – perhaps more so. If we examine intersections, we get lots of potential upside targets with the yellow channel top acting as a dividing line between modest and strong gains.
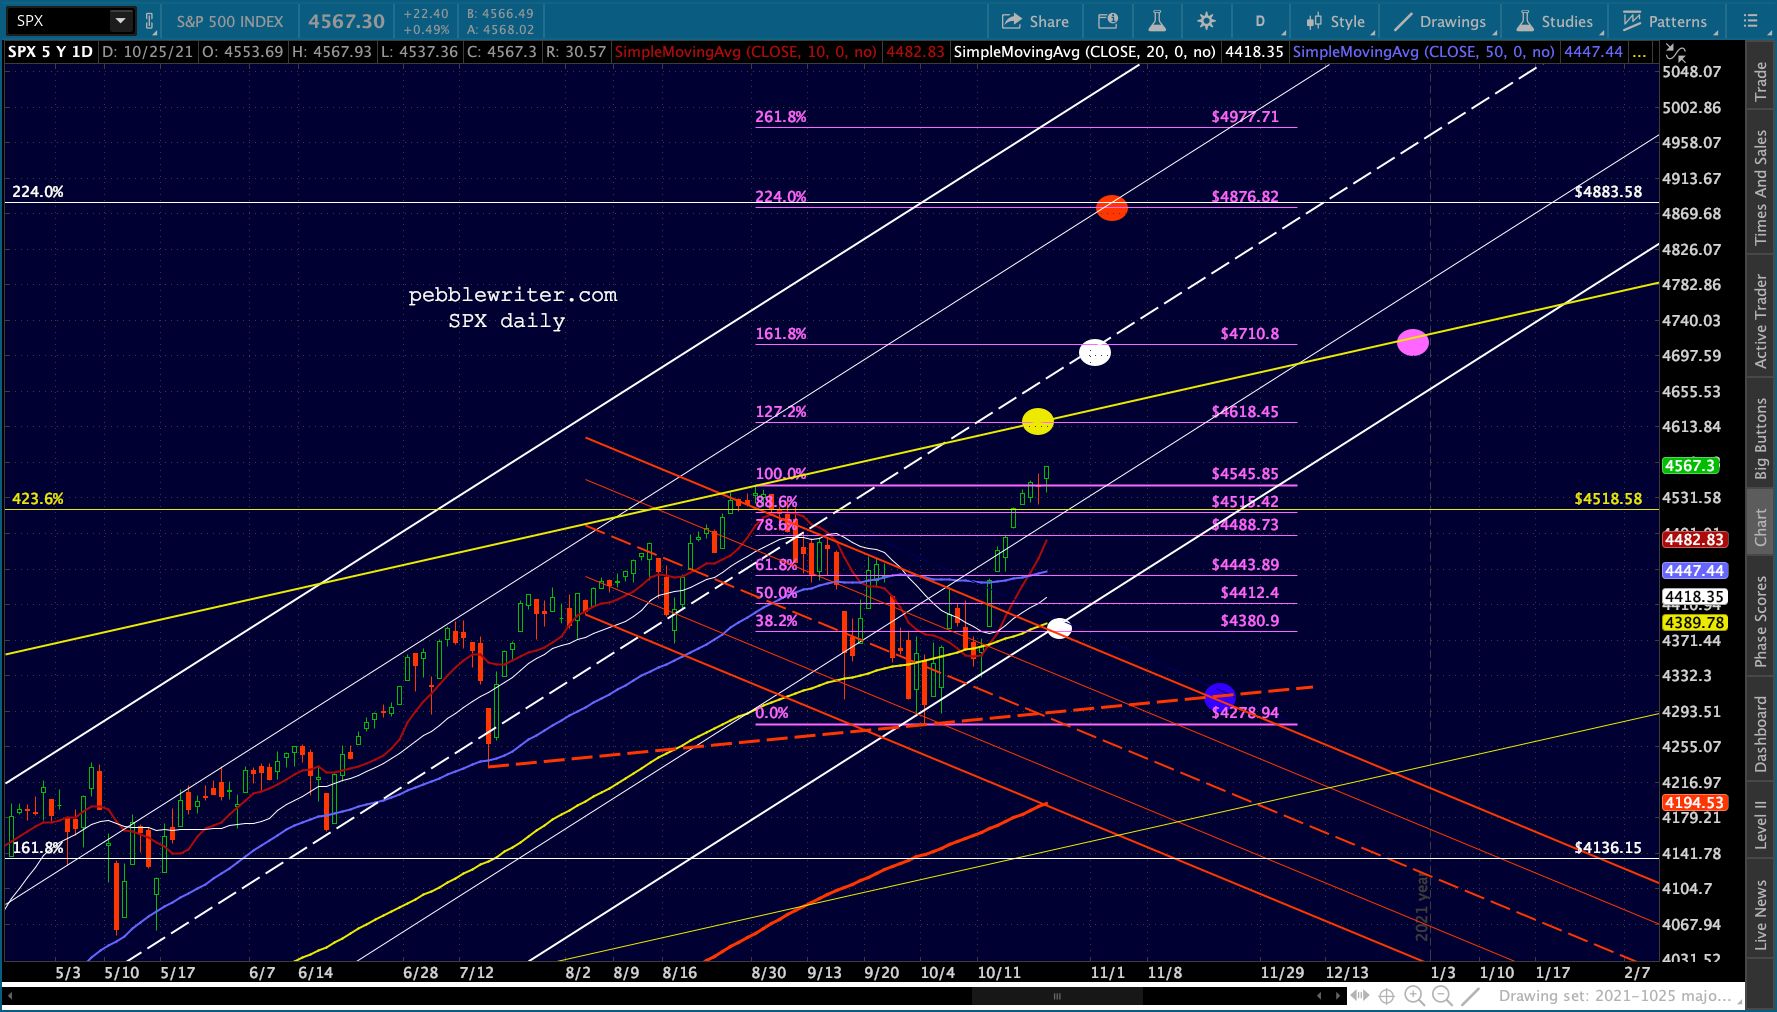 The yellow channel top rises at about 11.75% per year, a pretty good long-term RoR for stocks. But, that’s no guarantee that TPTB will be satisfied with that upside. The ball buster would be a rising wedge into the purple target at 4710 in December.
* * *
Going into the close, ES has stalled here at 4564. Note that a C=A pattern would put it back at the red H&S neckline.
 GLTA.
GLTA.