

I’ve been a little mystified as to how DXY could take a dive as per our forecast from two weeks ago [see: The End is (Probably) Near] while accommodating our forecast pop in both EURUSD and USDJPY. We discussed this in our analog details back on Feb 7, wondering whether the comparable drop had already taken place.
…things are further complicated by the fact that both the white channel bottom and the red TL already broke down before the VIX breakout — that first white dot on Jan 26. In fact, this breakdown was a big factor in the VIX breakout.
The puzzling aspect of the puzzle was that USDJPY is so integral to propping up stocks that it was hard to imagine a continuing rally without USDJPY’s help. And, it seemed unlikely that EURUSD’s target could be reached without USDJPY faltering too.
So, here we are — with DXY declining right on time… …and USDJPY dipping toward the 106.50 target we had in place prior to the analog. Is this the time shift we had contemplated or something more?
continued for members…
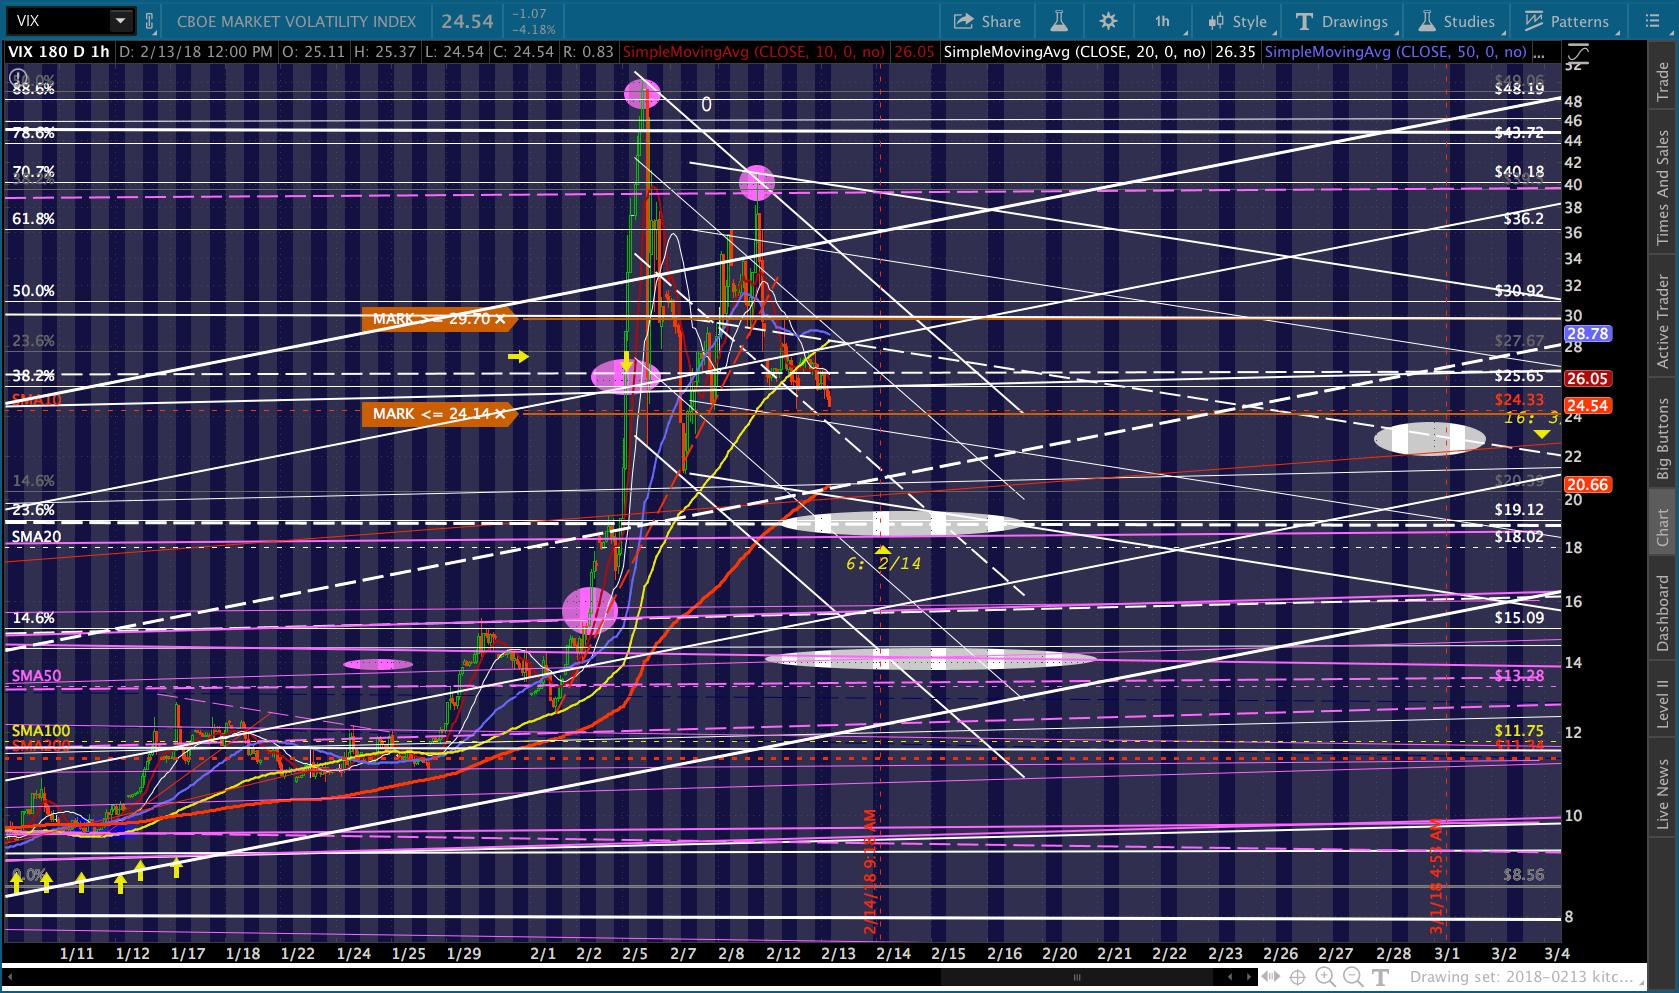
If Day 0 was in fact the initial drop on Jan 26, then everything has been moved up. If this is the case, then the 106.50 tag will be the Day 16 drop and a subsequent rally will take place from that support. This gets a little complicated, so I’ll be giving it more thought throughout the day.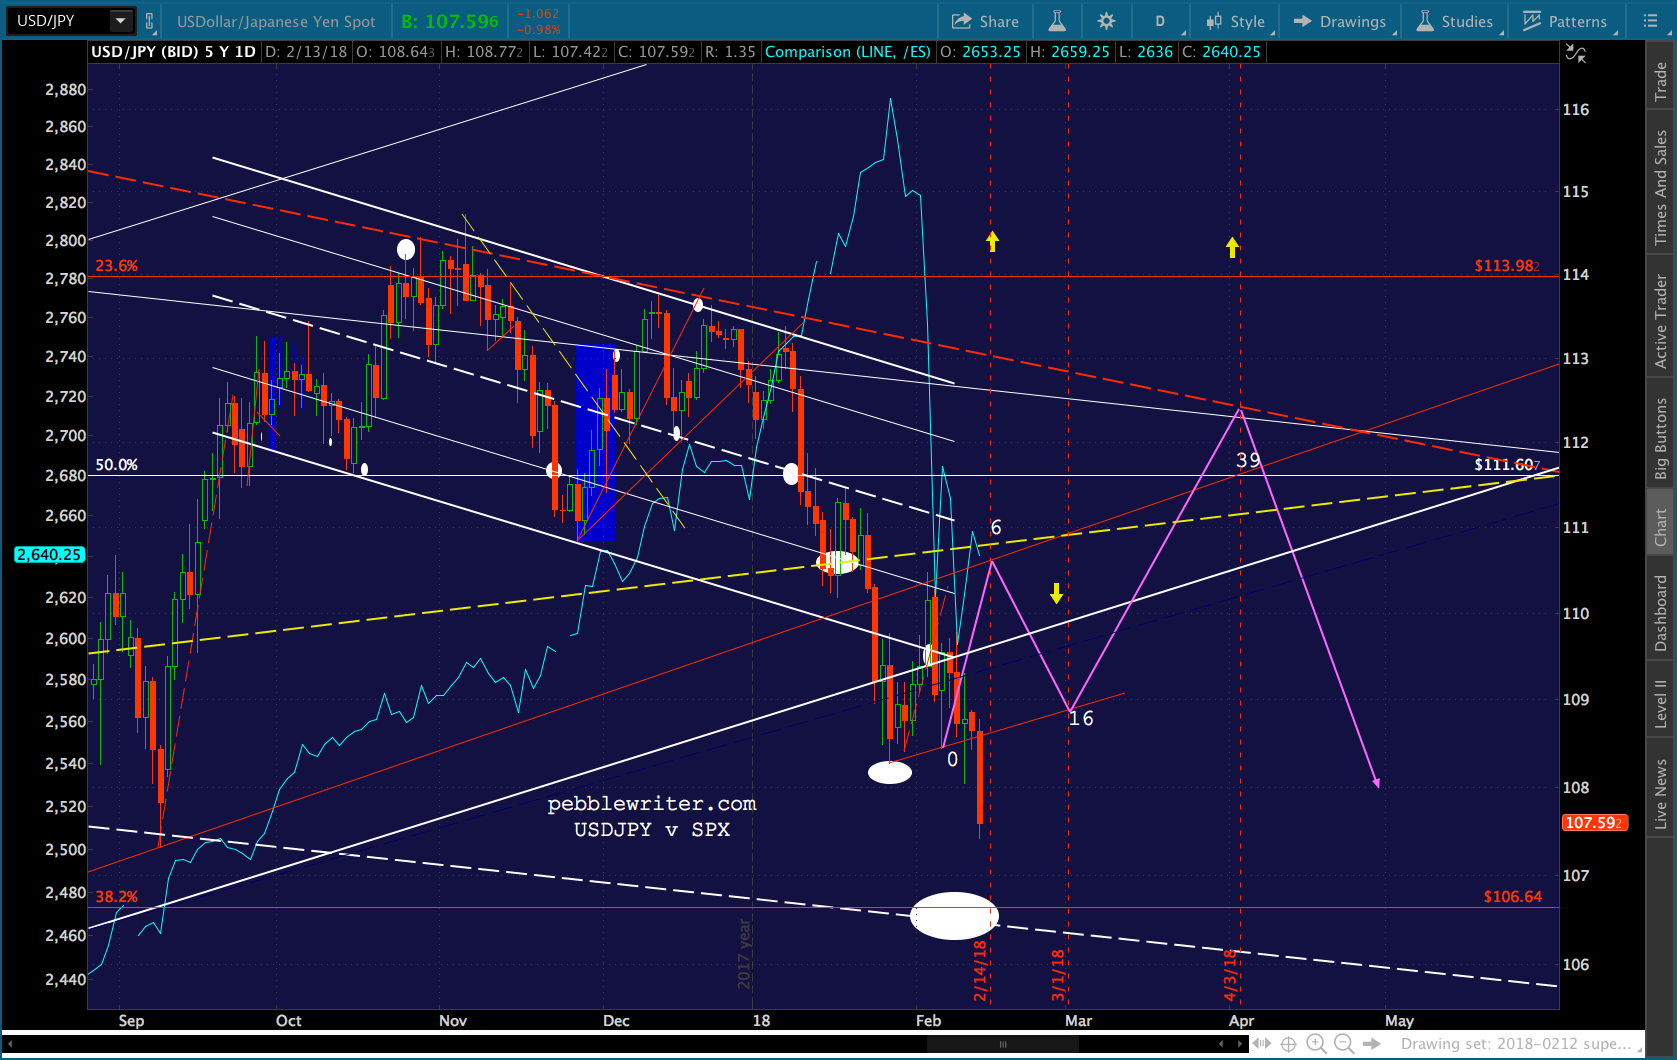 To further complicate things for equities, CL and RB are continuing their declines. RB dropped through its SMA200 and is close to testing its Dec 13 lows at 1.644. A drop below would be bearish.
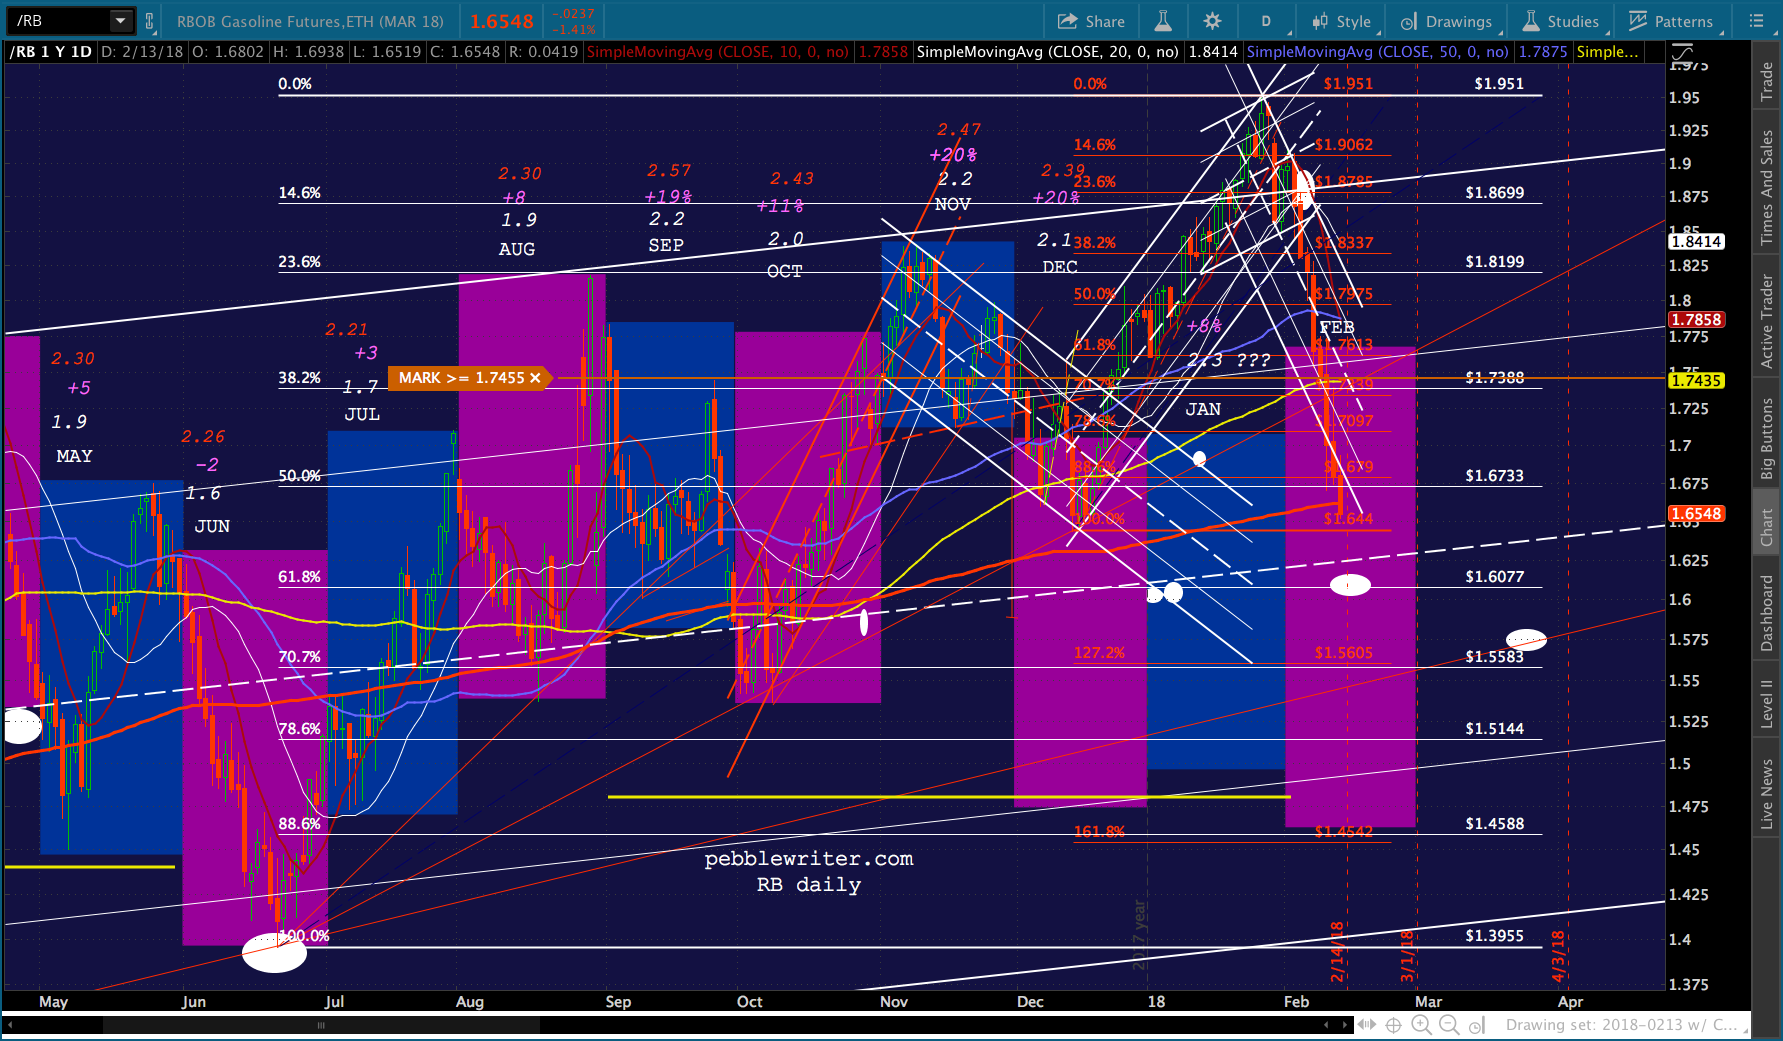 While CL looks likely to at least backtest its SMA100, with the red .618 or .707 at 55.81 and 54.25 being solid secondary targets. A drop below its SMA100 would justify switching sides and re-shorting.
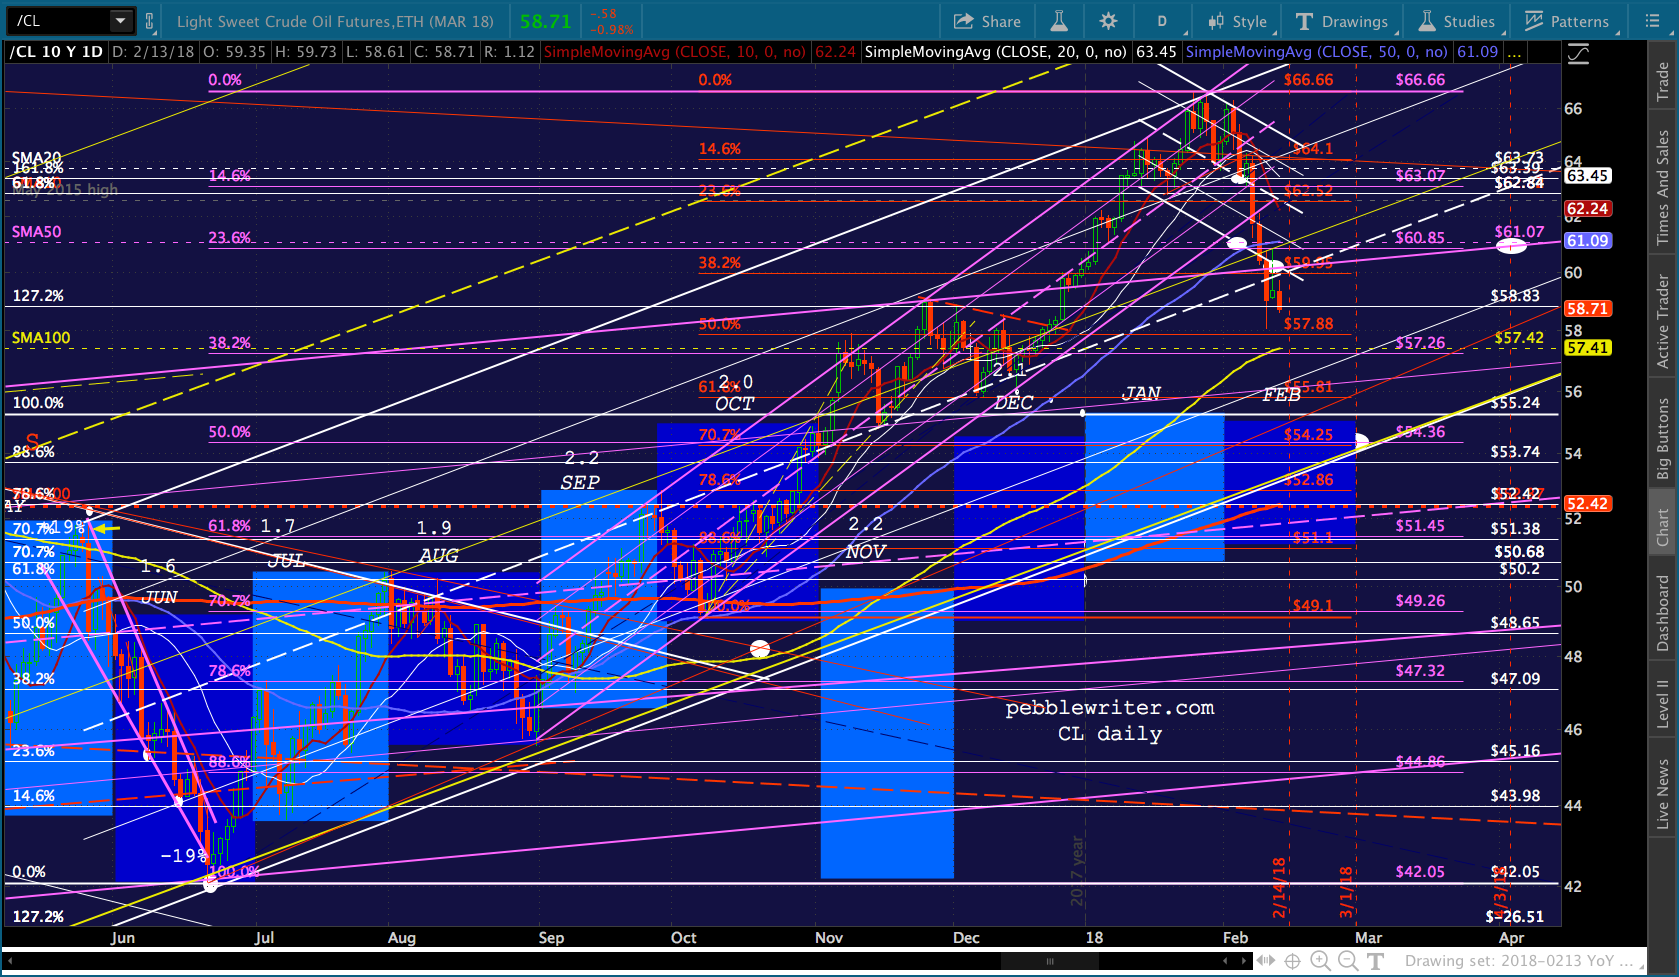 Futures have not taken all this negativity well. ES is clinging to support…
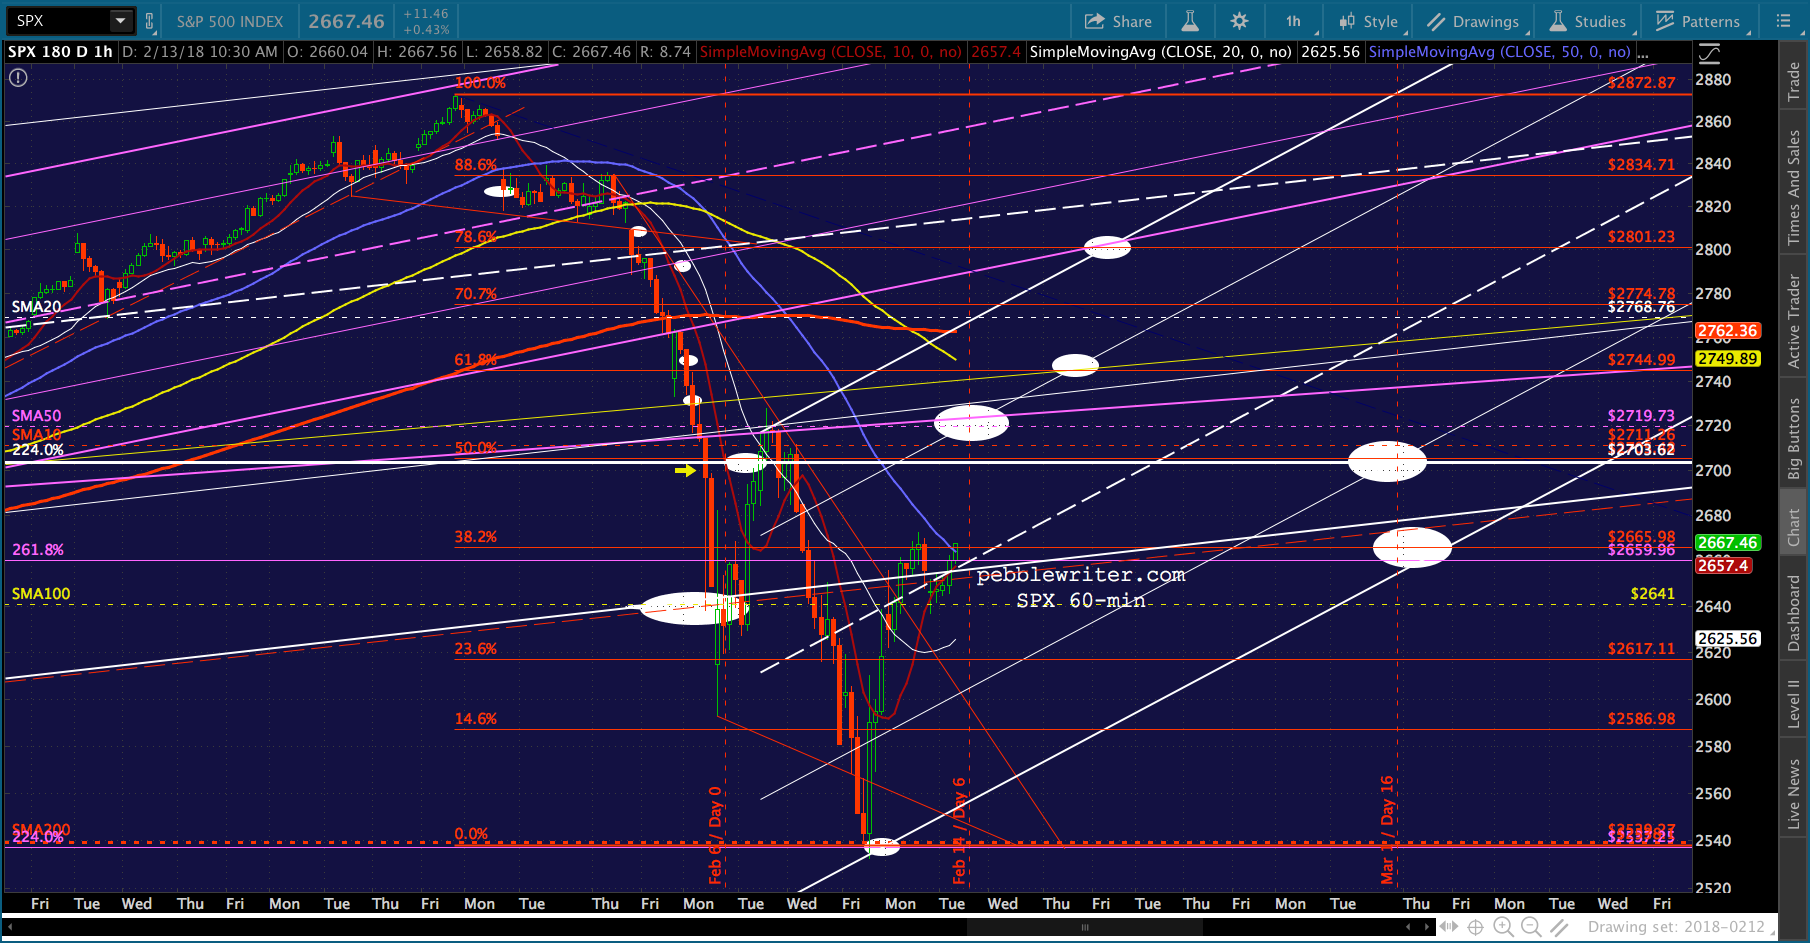
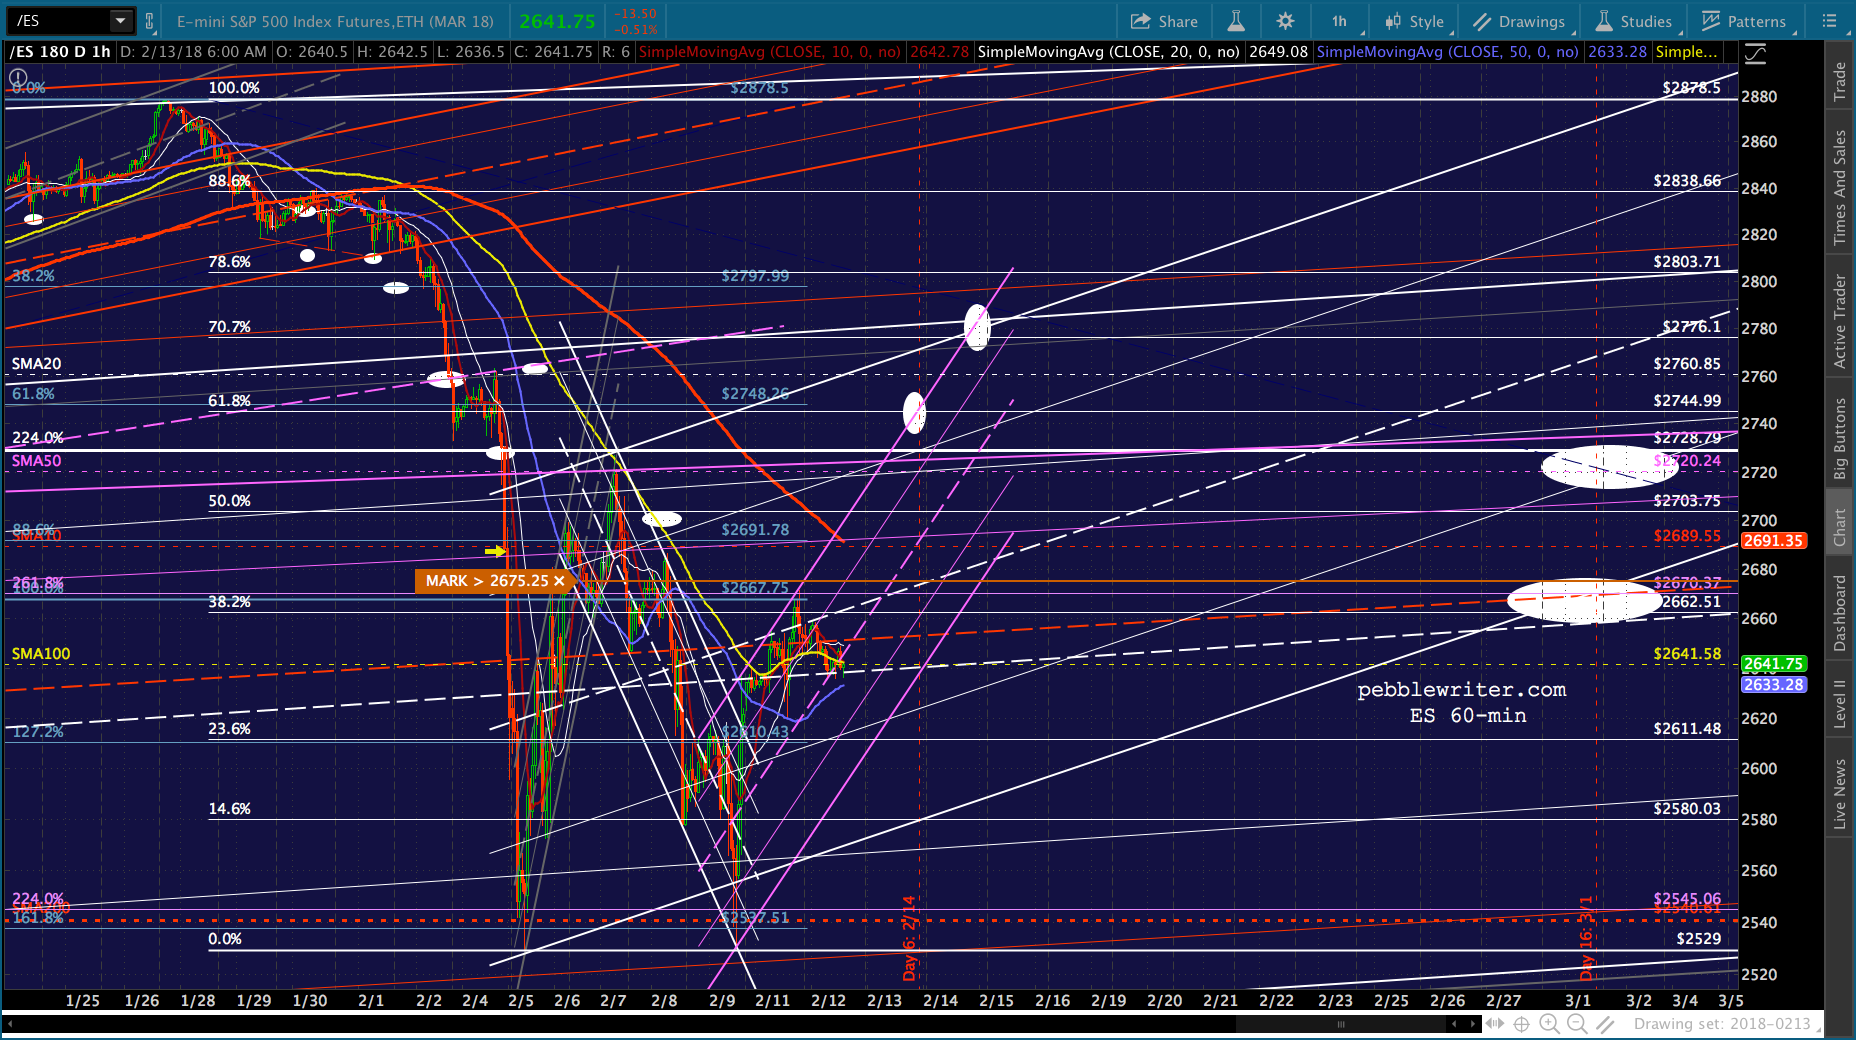 …while SPX is going to test its SMA100 — at least initially.
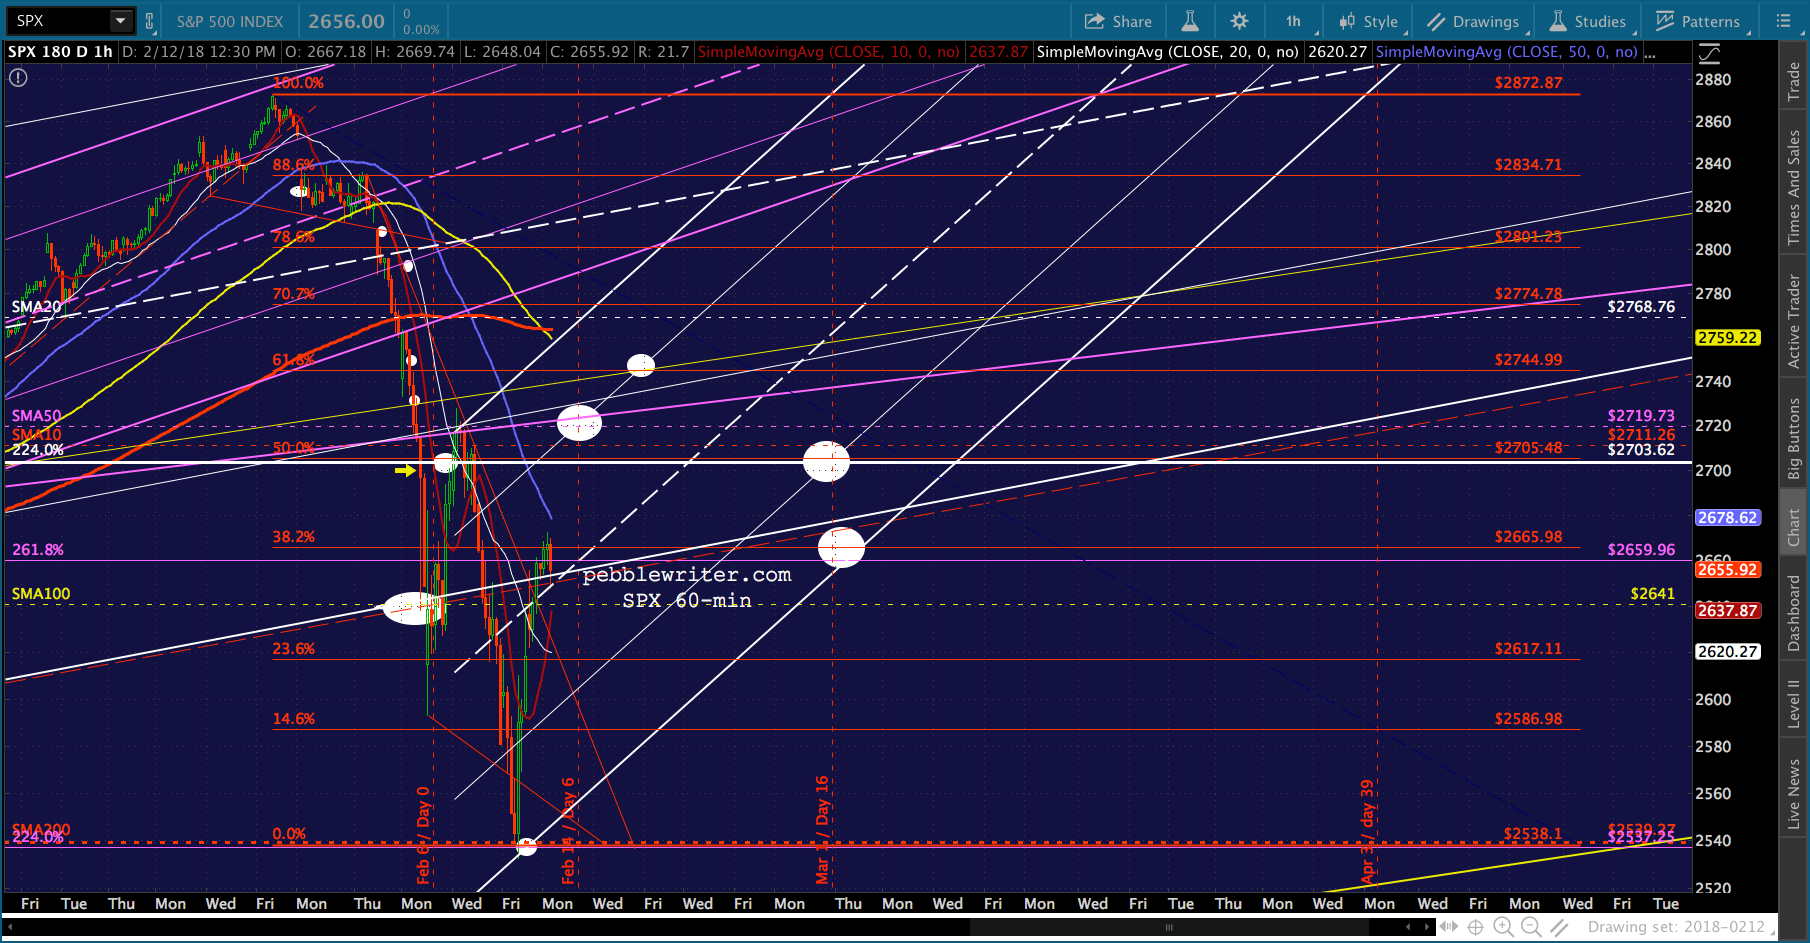 As yesterday, it’s all up to VIX. The bulls need it to break below the SMA10 at 24.33.
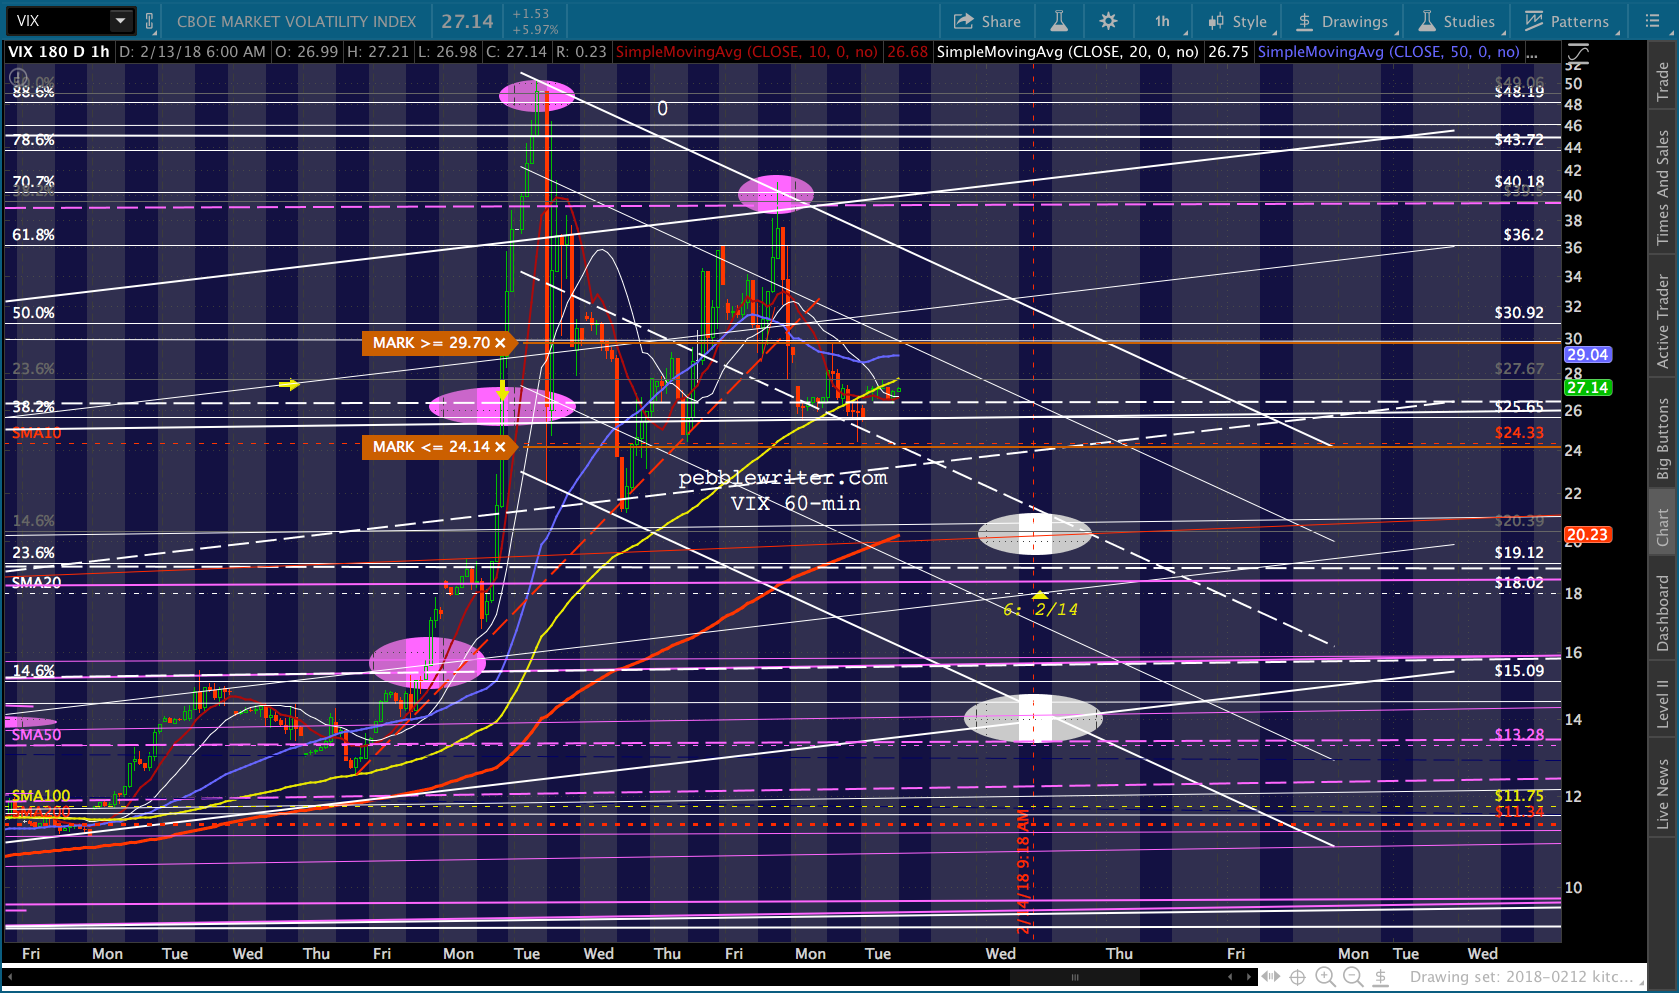 And, it would help if DXY could hold at its SMA10 at 89.704 and USDJPY could bounce sharply off that Fib line.
The bigger picture shows that the white channel has clearly broken down. This is a negative for stocks, but as long as VIX can keep dropping and CL/RB can bounce here, then the impact should be offset.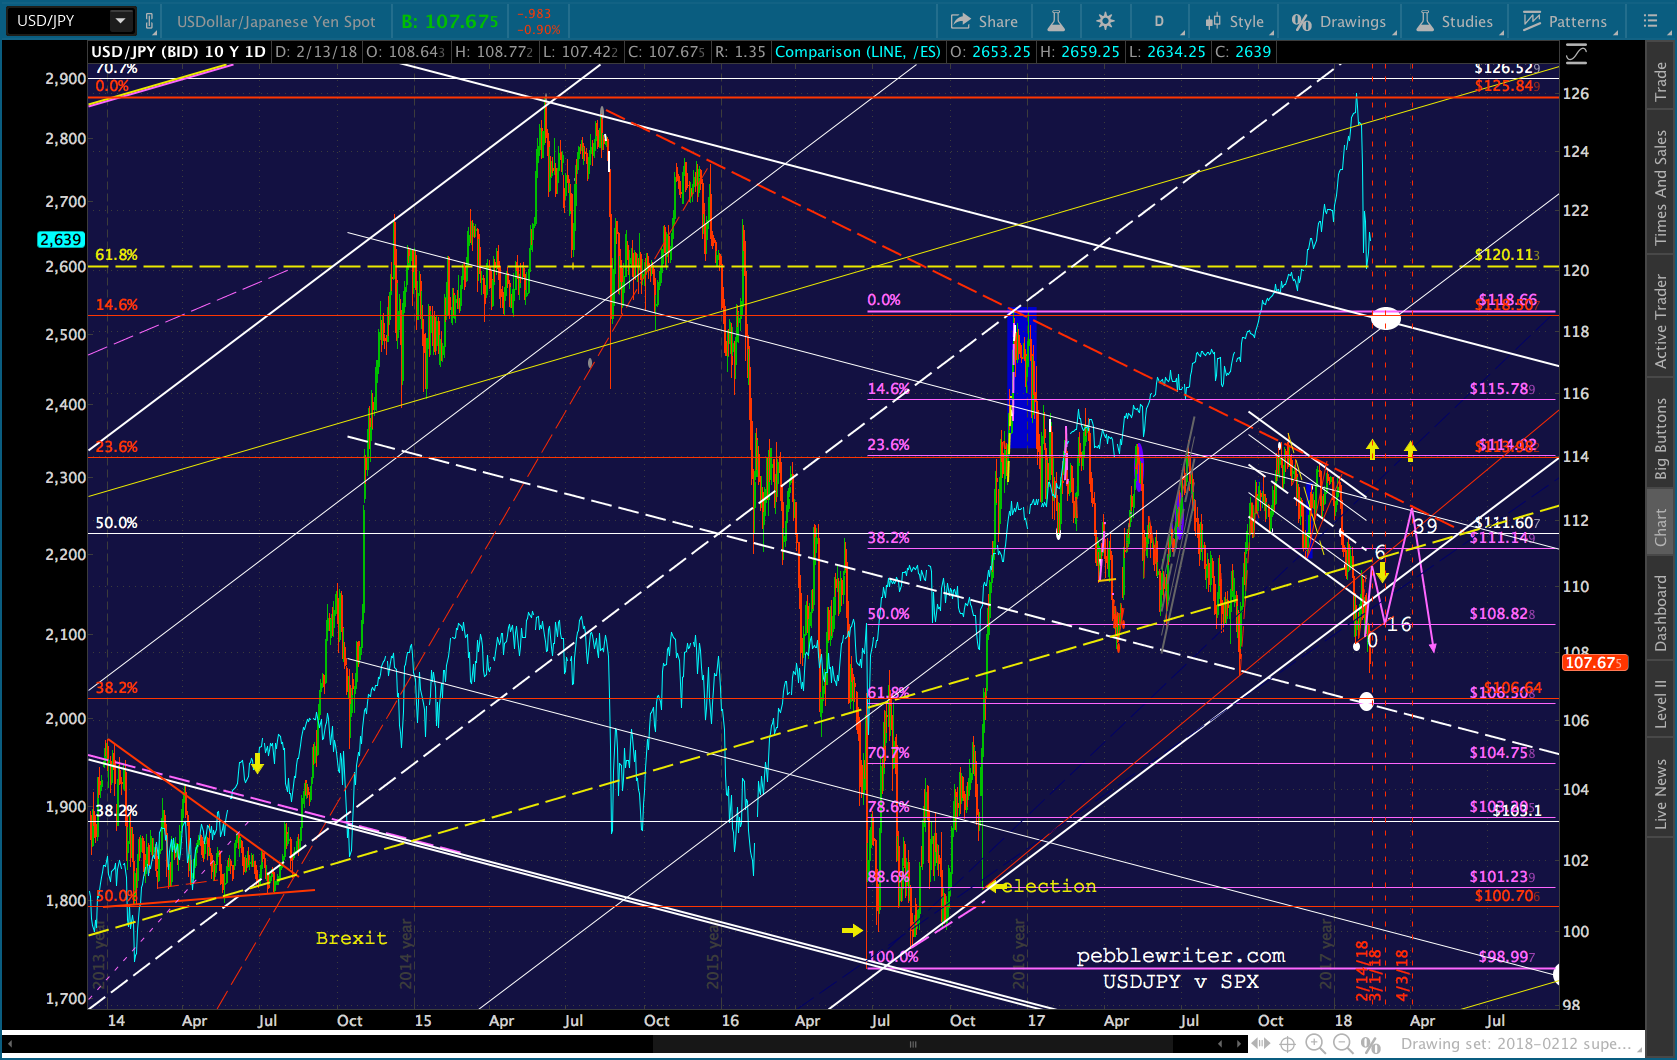 And, if USDJPY can get a hard bounce off the purple .618 at 106.50, then it might be successful in mitigating any further EURUSD strength. It could pop up and backtest the white channel and/or yellow midline around 111.14, helping stocks considerably.
Since CPI comes out at 8:30 am tomorrow, we could get some big moves in currencies before equity markets open for the day.
UPDATE: 2:15 PM
Quick update on things…SPX has rebounded nicely from its earlier lows and is about to break above yesterday’s highs. If VIX drops through its SMA10, that should do the trick.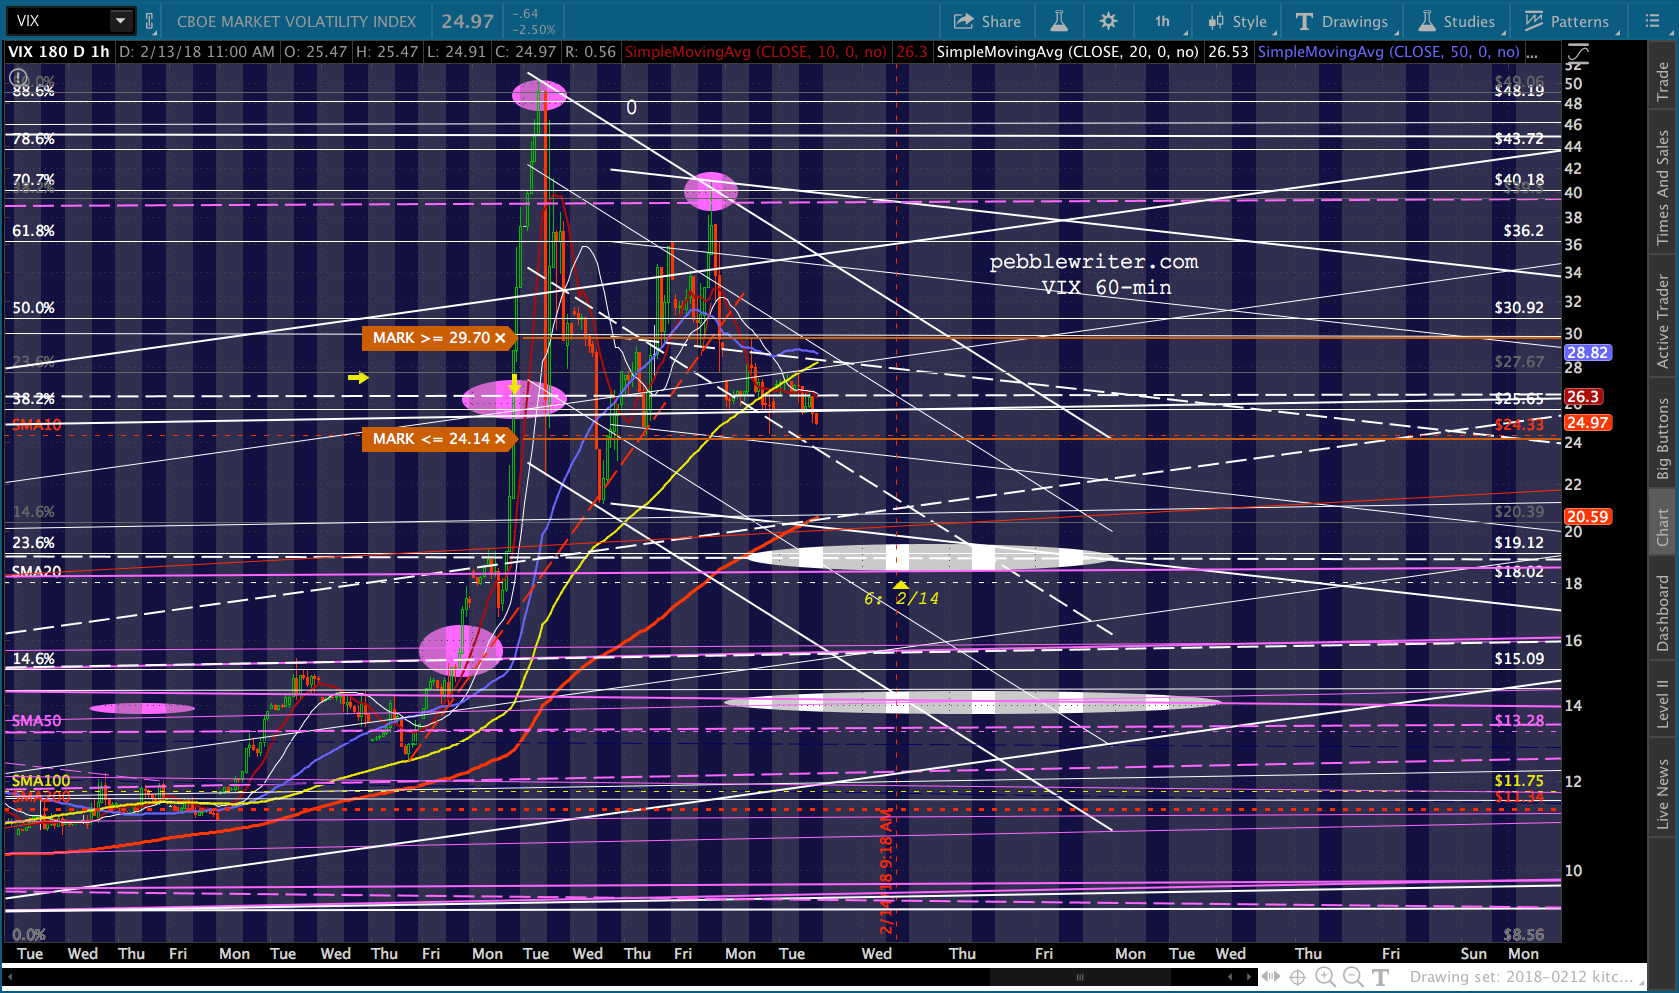
 Note the placement of VIX’s downside targets. The higher target is 18.64-19.12 — a backtest of the rising purple channel, white midline and white .236 Fib. The lower target would be around 14-14.10 — the top of the falling purple channel from Nov 2015.
 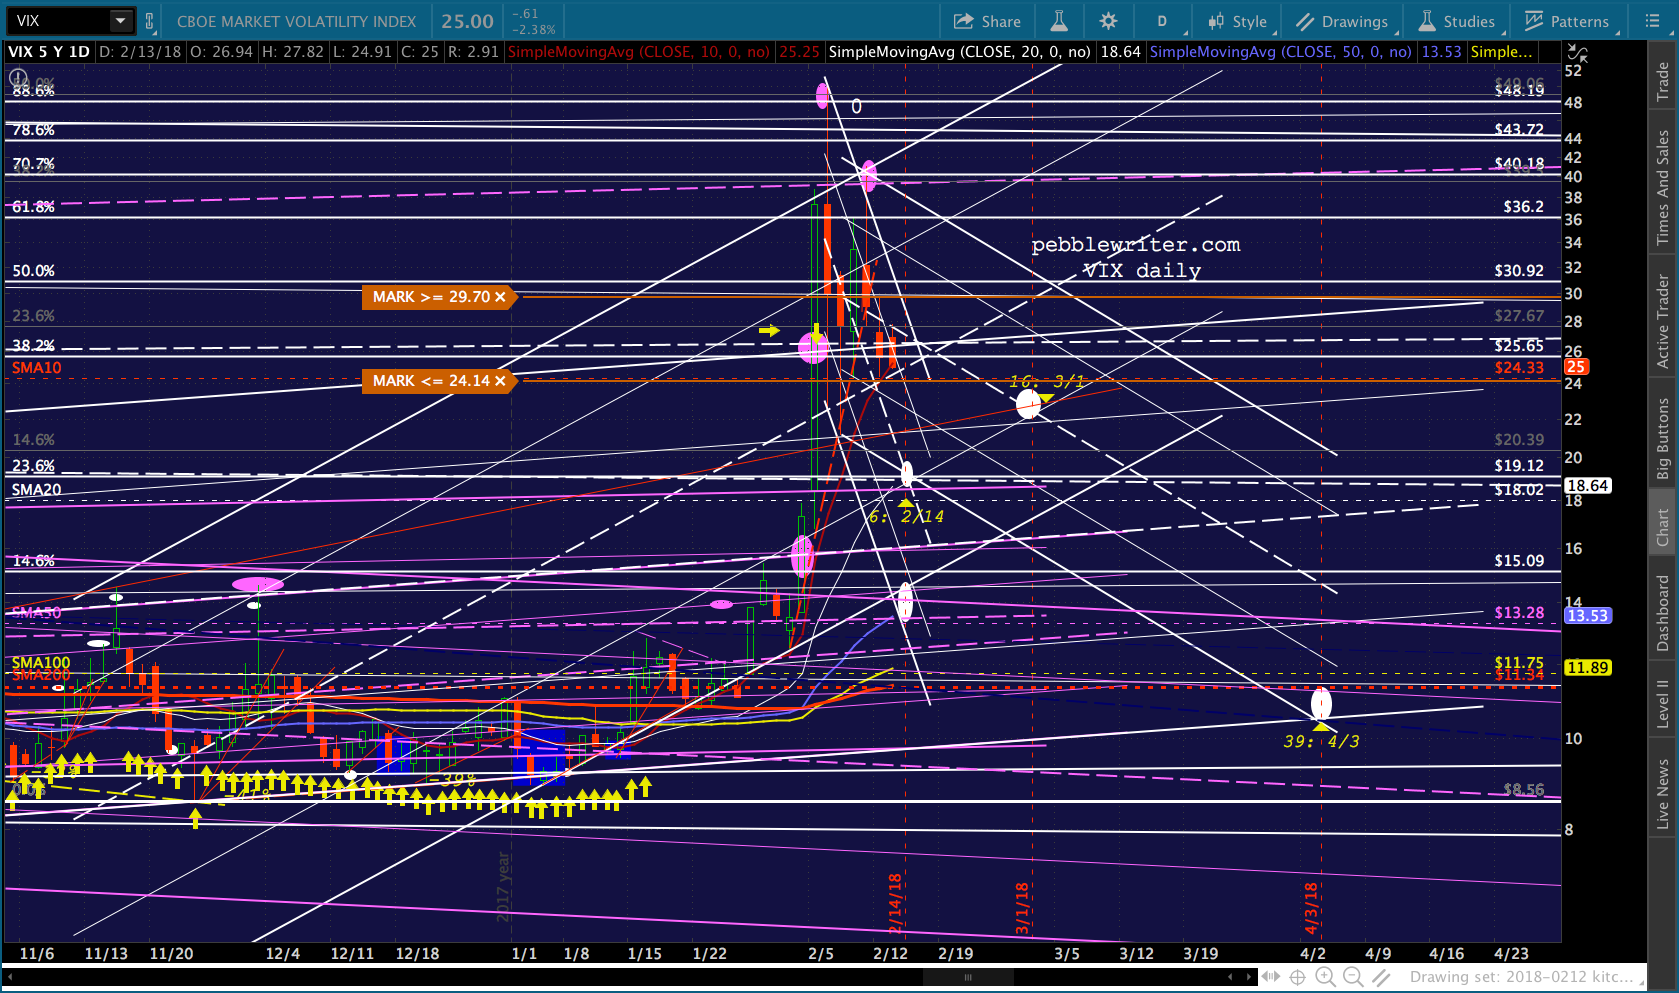 The big win, of course, would be a drop back into the falling purple channel. But, I have a hunch that will wait for the next leg up into early April. I show it as being around 10.46 on Apr 3.
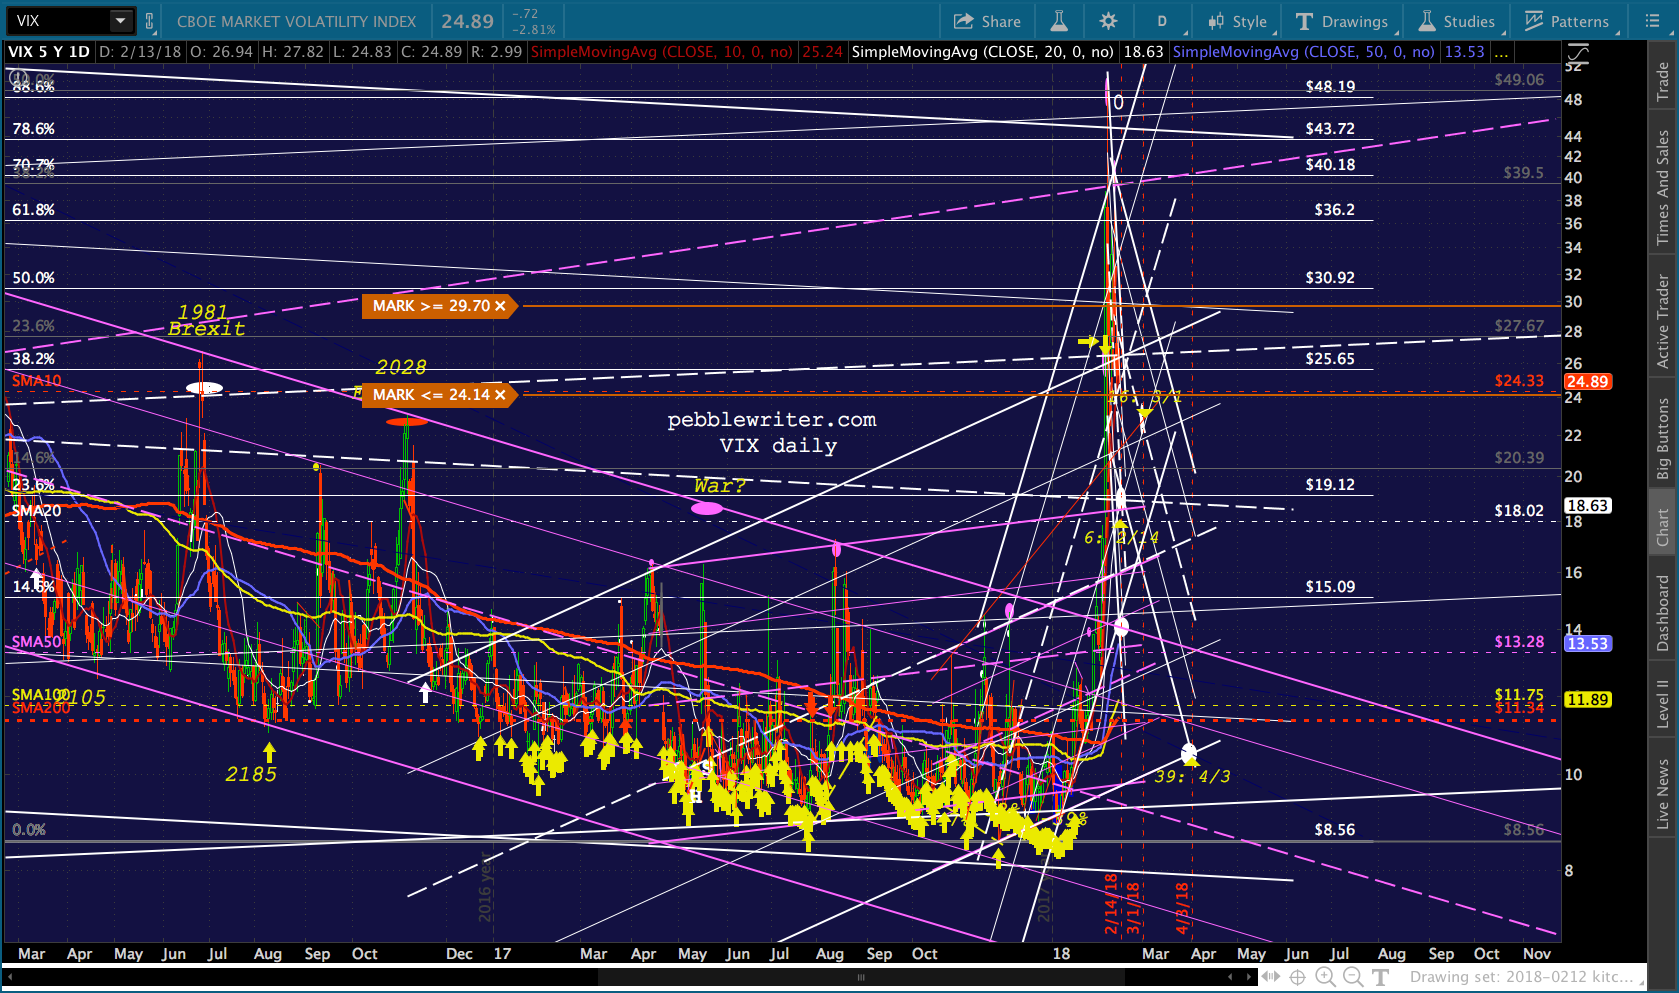 UPDATE: 3:40 PM
VIX is almost to the SMA10, and SPX is coming up on yesterday’s highs.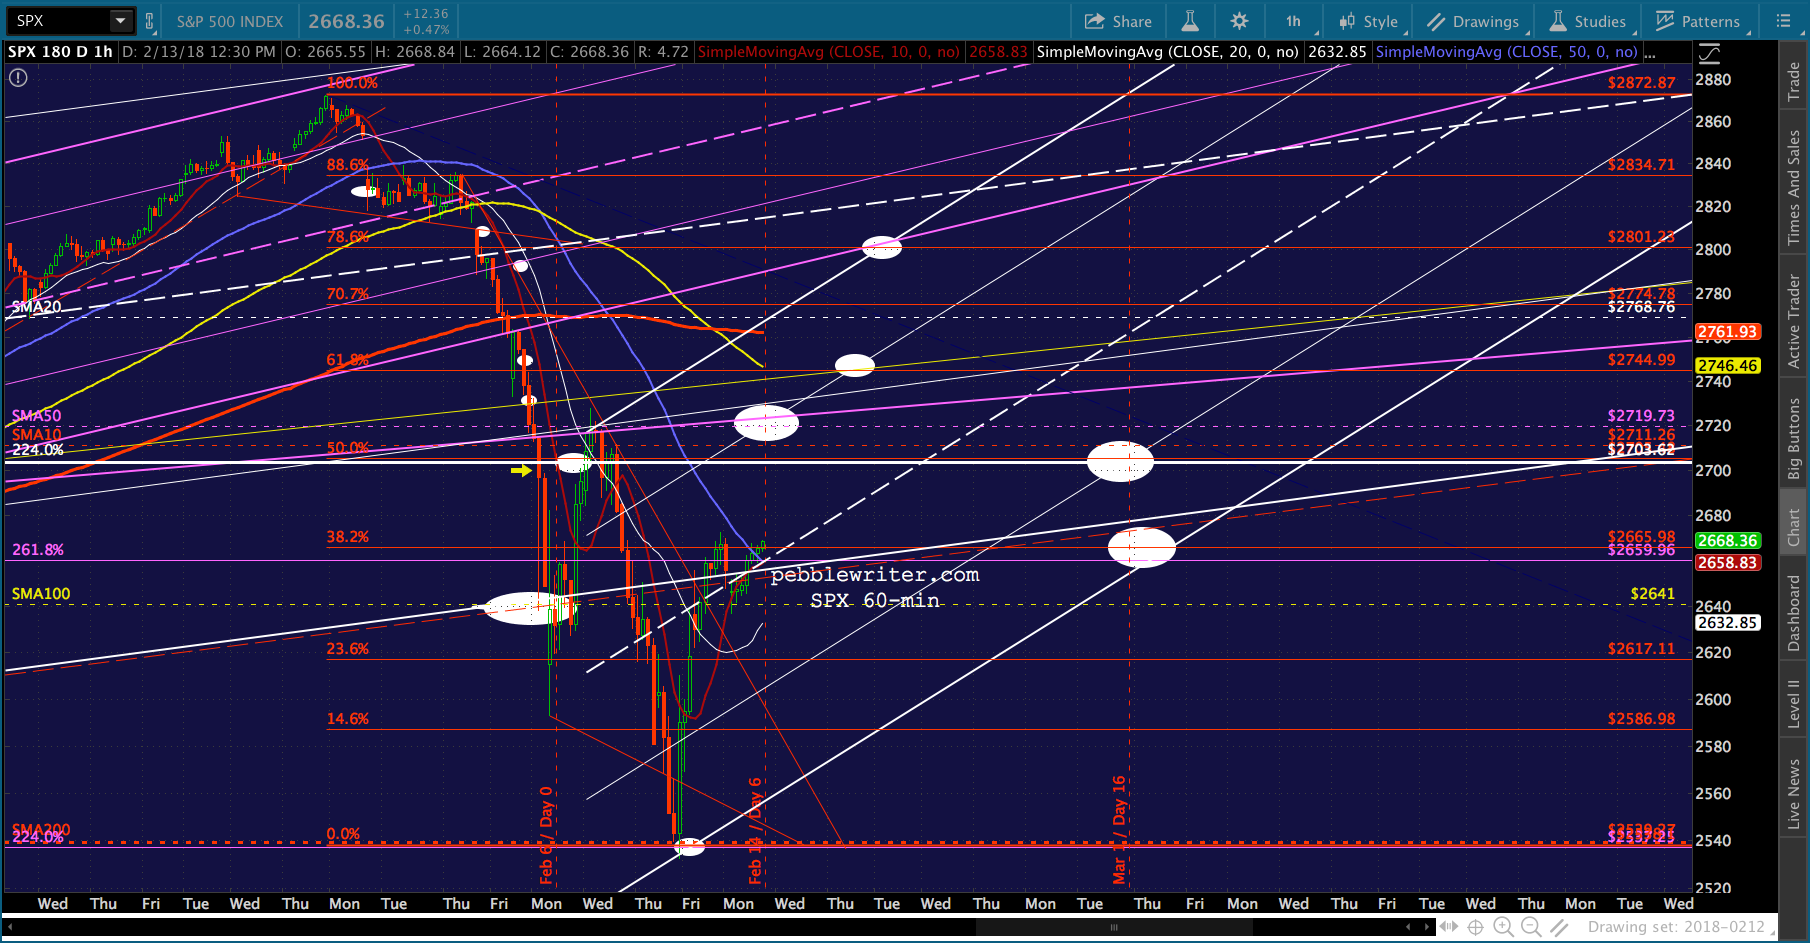
 CL is hanging out just below the purple channel top, getting closer and closer to the SMA100.
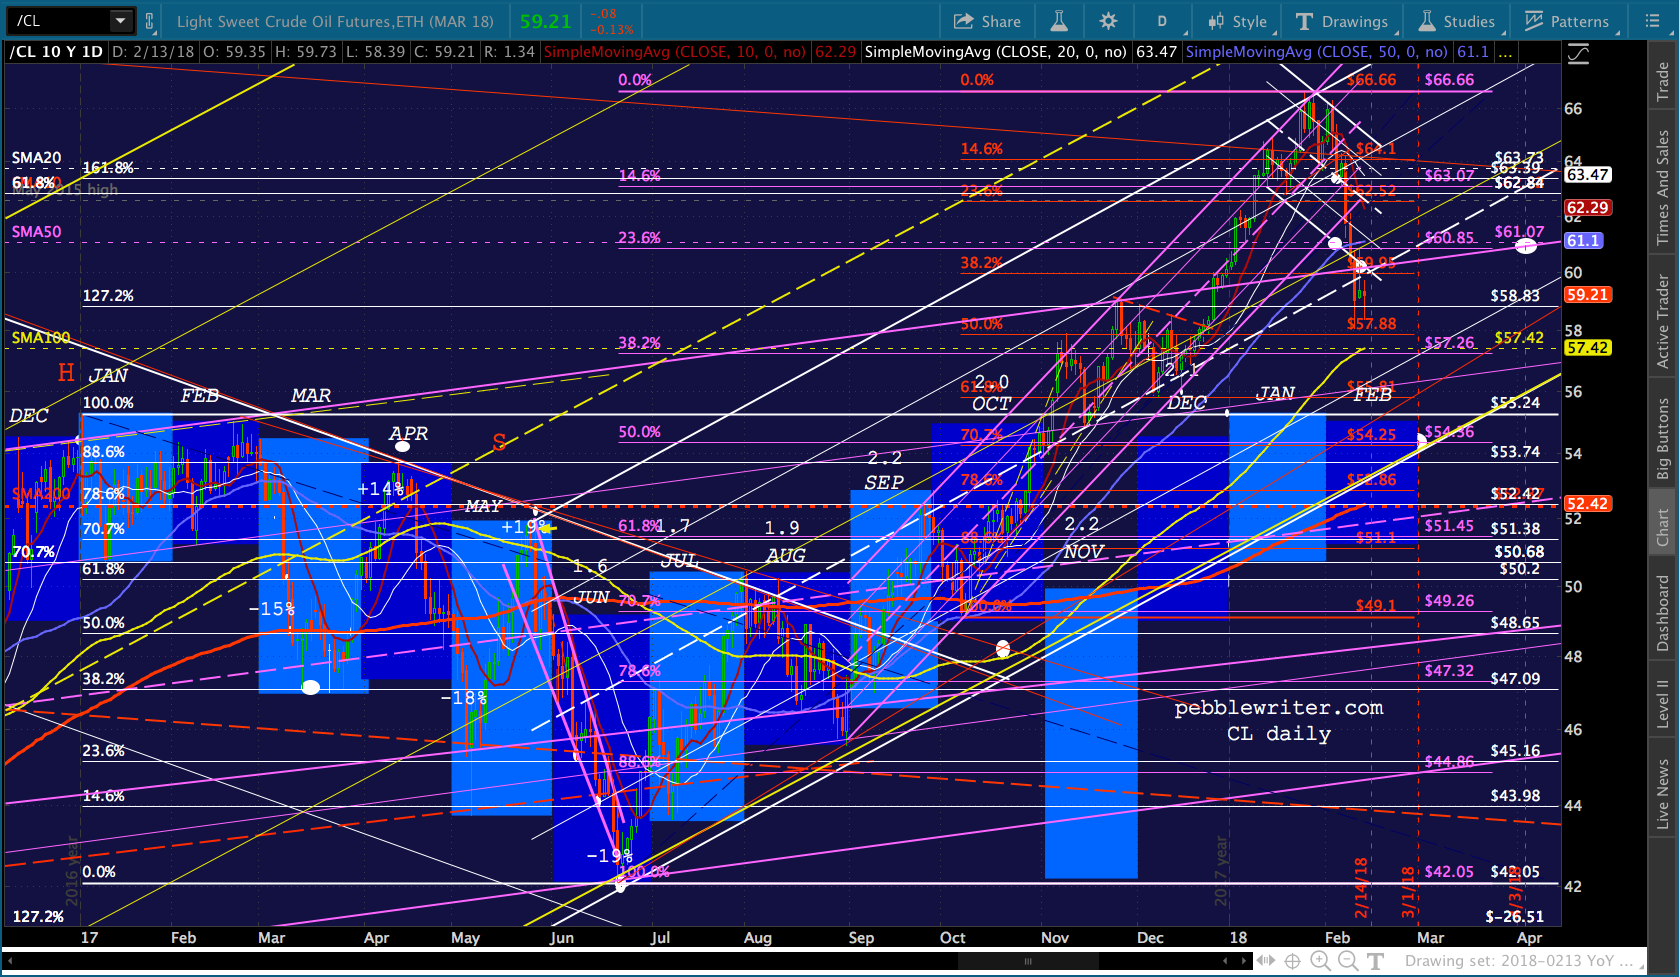 I’ve spent most of the past few days thinking about inflation. Everybody is probably assuming a strong CPI, as oil and gas prices were substantially higher than Jan 2017.
You can see it in the gap between Jan 2017 and Jan 2018 oil prices above. And, you can see it in gas prices below.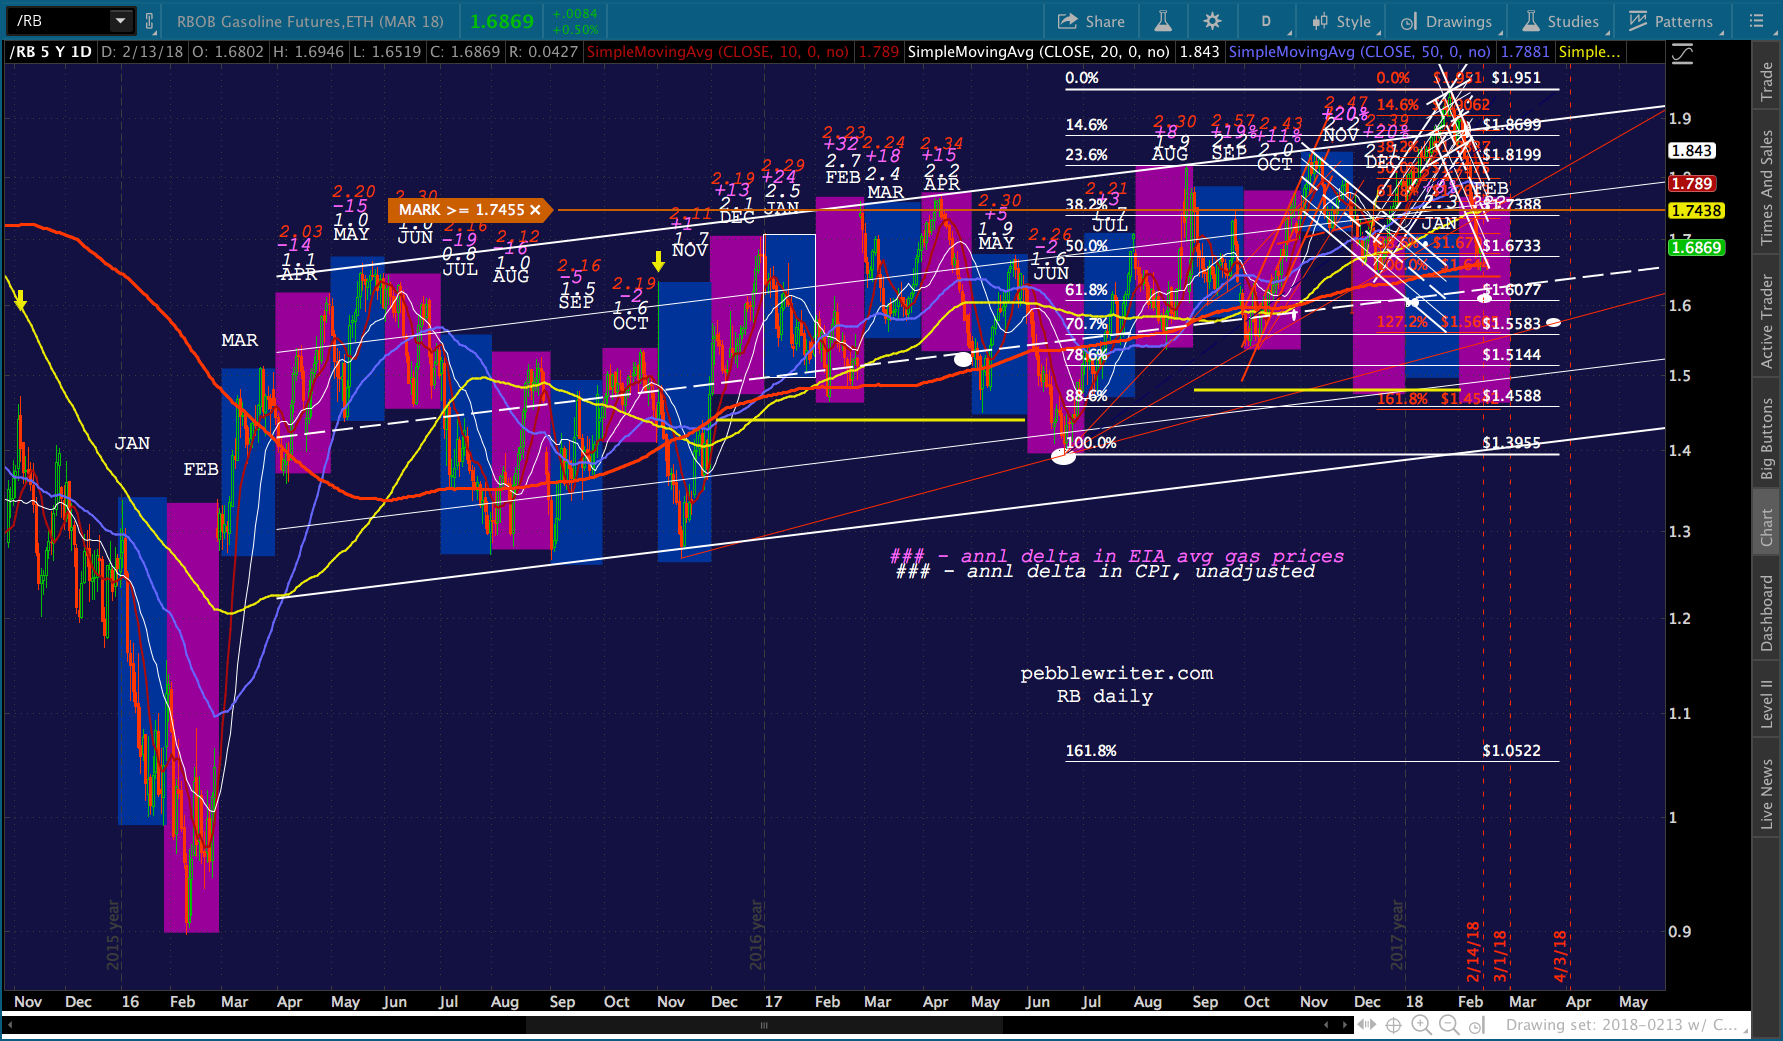 January’s was the biggest YoY overshoot of the previous year’s range in quite a while. Just eyeballing it, I’d say the average price in Jan 2017 was 1.60, with an average in Jan 2018 of around 1.85 — a 15.6% increase.
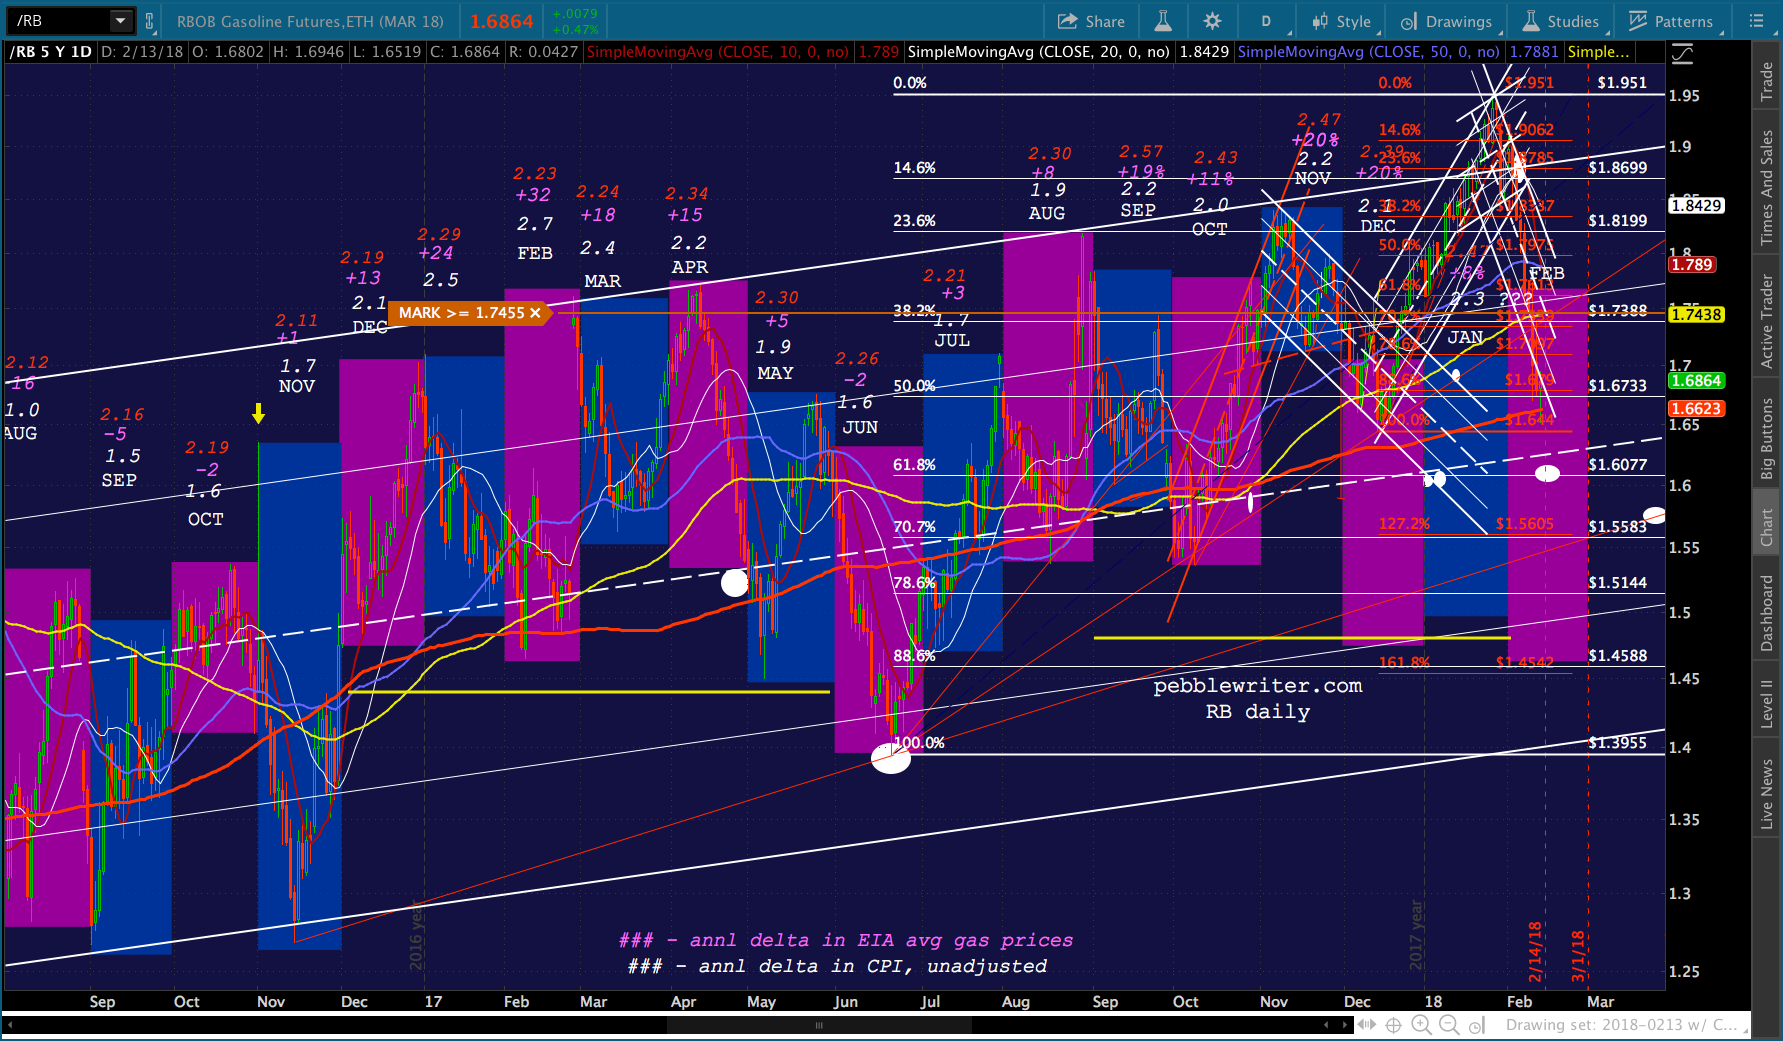 A slightly more scientific way of evaluating it would be to look at the average of the closes for each session and compare those from Jan 2017 with those from Jan 2018. The increase was actually more like 17.8%. The chart below shows that the gap grew as the month wore on.
 Guess what the EIA reported? Keep in mind that while the BLS uses EIA data, they often come up with their own, even more massaged number. The official rate of increase YoY was 7.96% — less than half what RB saw.
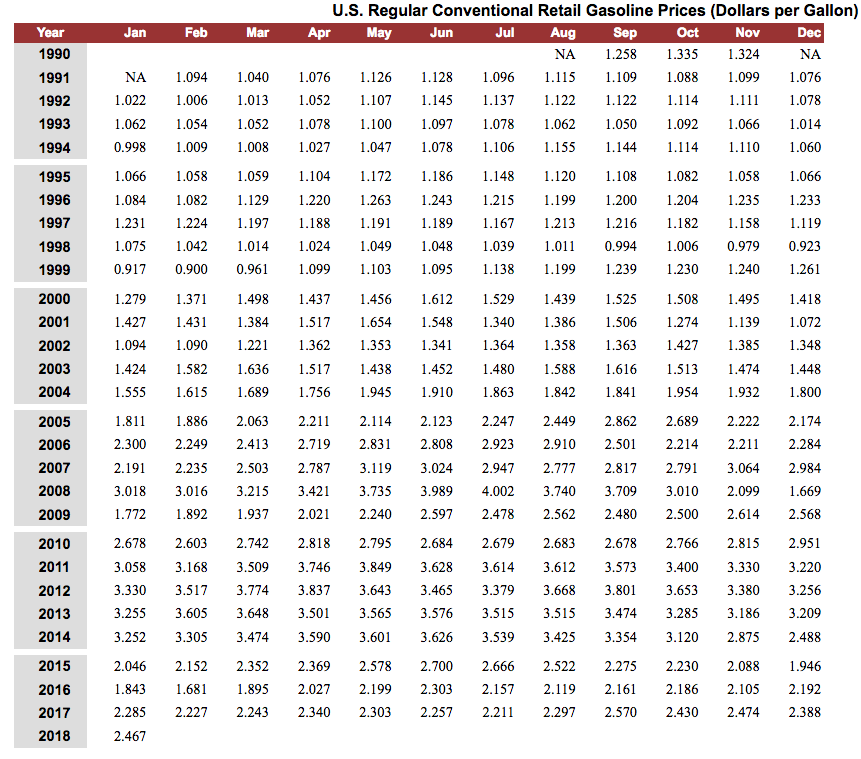 We’ve been down this path so many times before. What impact might it have on tomorrow’s CPI report? And, how might it affect interest rates, currencies and oil and gas themselves?
Stay tuned for a post on just that.