

On January 3, SPX reached a potentially important Fib level: the 2.24 extension of the drop between 2007-2009.
Now, it doesn’t matter whether or not you believe in harmonics — the application of Fibonacci ratios to price forecasting. But, you’d have to be blind to not see that plenty of people (or, at least the machines) do. Why begin a post on oil and gas with an SPX chart? Because, as has happened so frequently the past several years, oil (CL) and gas (RB) were instrumental in a plan to get SPX up over resistance.
For nearly two years, CL has followed a well defined rising channel, shown below in purple. It bounced back and forth between its top and bottom with some regularity until it broke out — you guessed it — on January 3.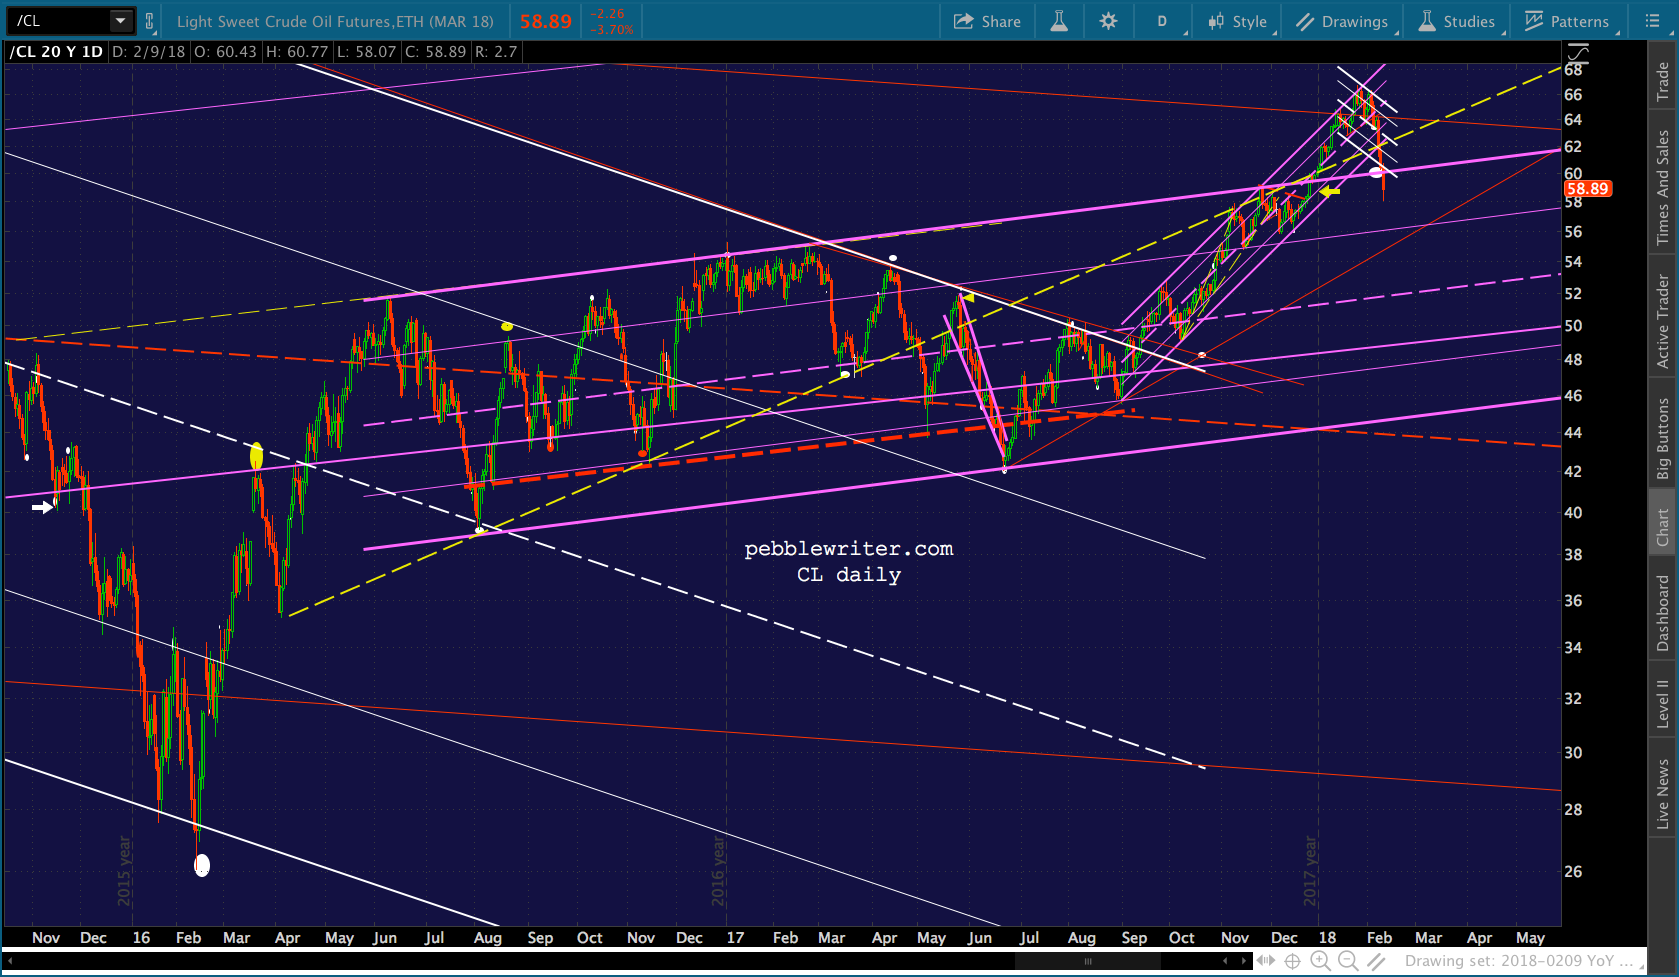 Fibonacci ratios and chart patterns can tell us a lot about future price movements. But, we must also consider ulterior motives — particularly for oil and gas, which are integral to telling algorithms when to buy and when to sell. I mattered when we called the bottom in Feb 2016 [see: USDJPY Finally Relents] and it matters today.
When CL and RB both reached our next downside targets from Jan 17 [see: Targets!] this morning, we had to stop and consider whether stocks had yet done what was desired of them. 
 With SPX still 50 points away from its SMA200, it seemed they weren’t quite done. Turns out they weren’t.
continued for members…
By the time SPX reached its SMA200, RB had fallen on down to its .886 at 1.679 — our next lower target.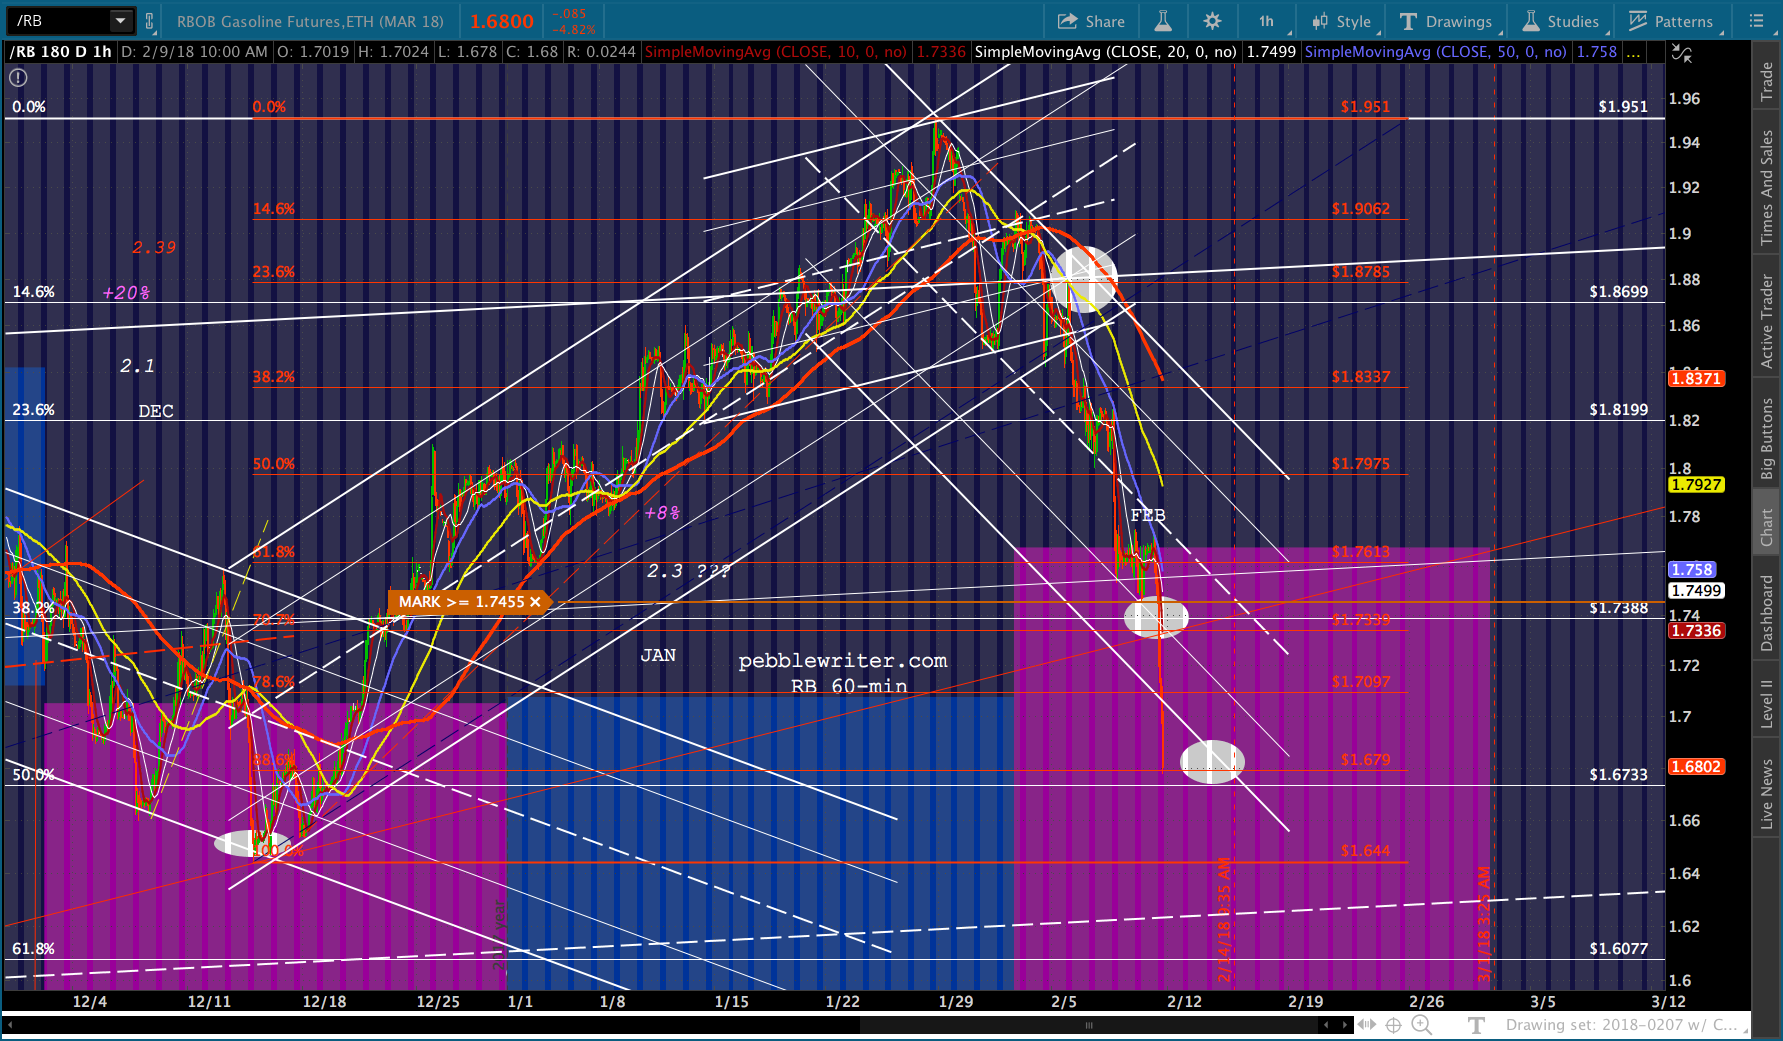 And, CL just plain overshot its channel top — obviously, more than a backtest.
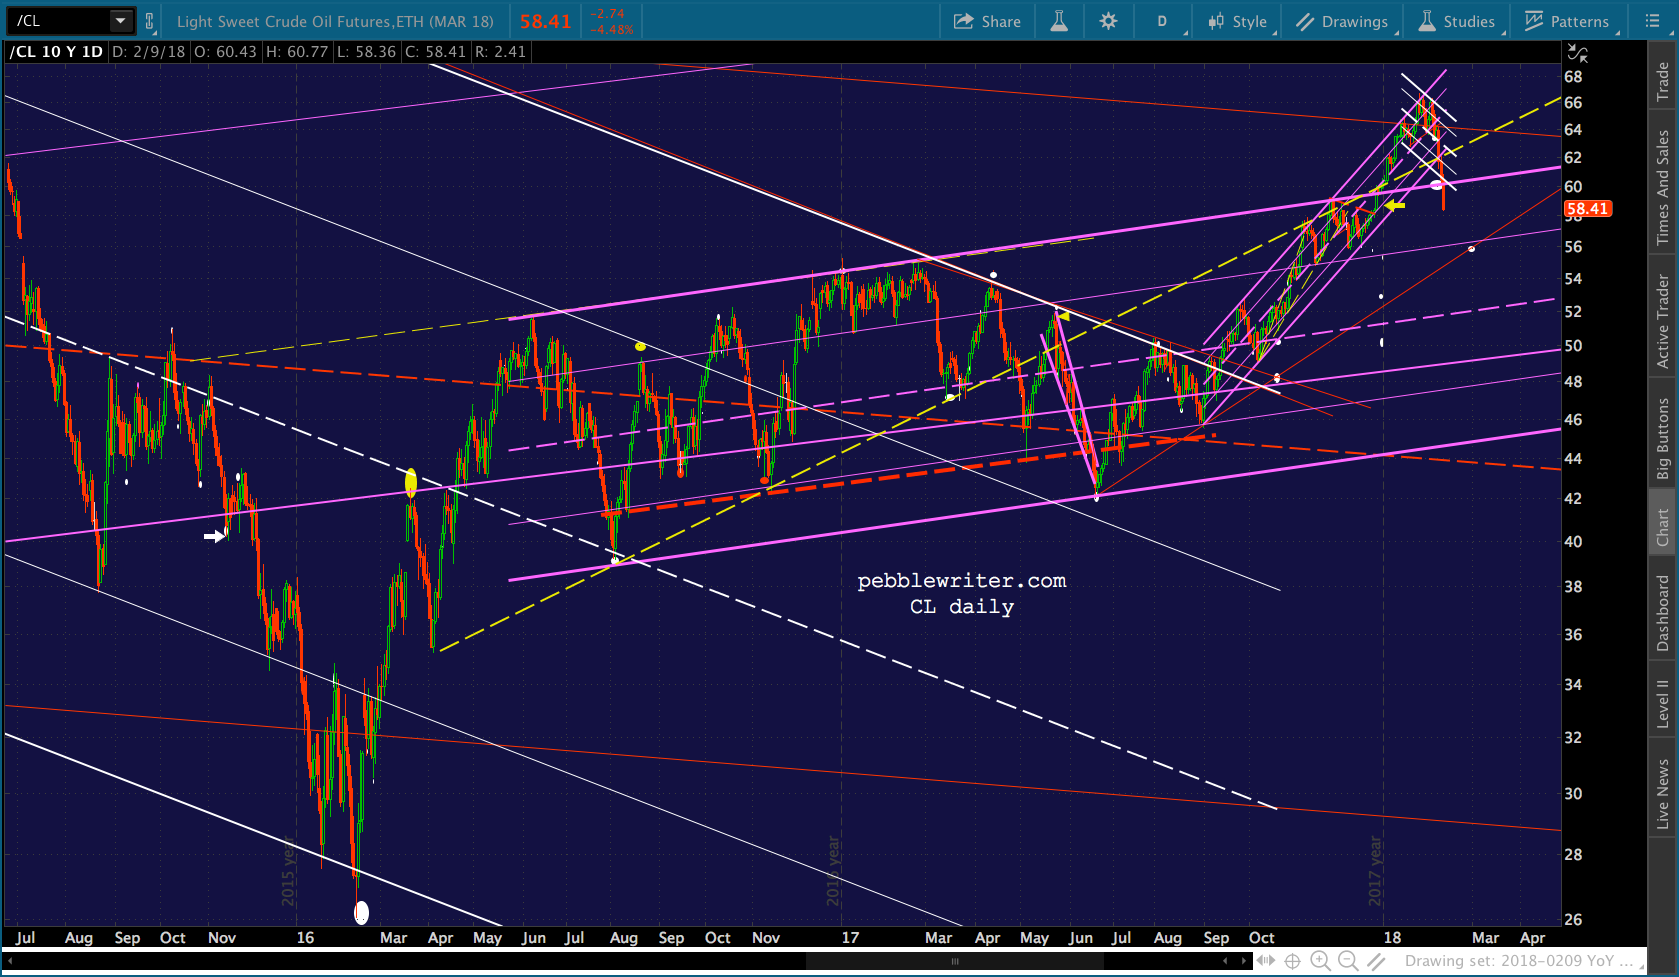 So, what other chart patterns might be at work? Looking at the big picture, recall we have a rising yellow channel that was established by the Feb 11 2016 lows (lows that completed a .886 retracement on the white grid.)
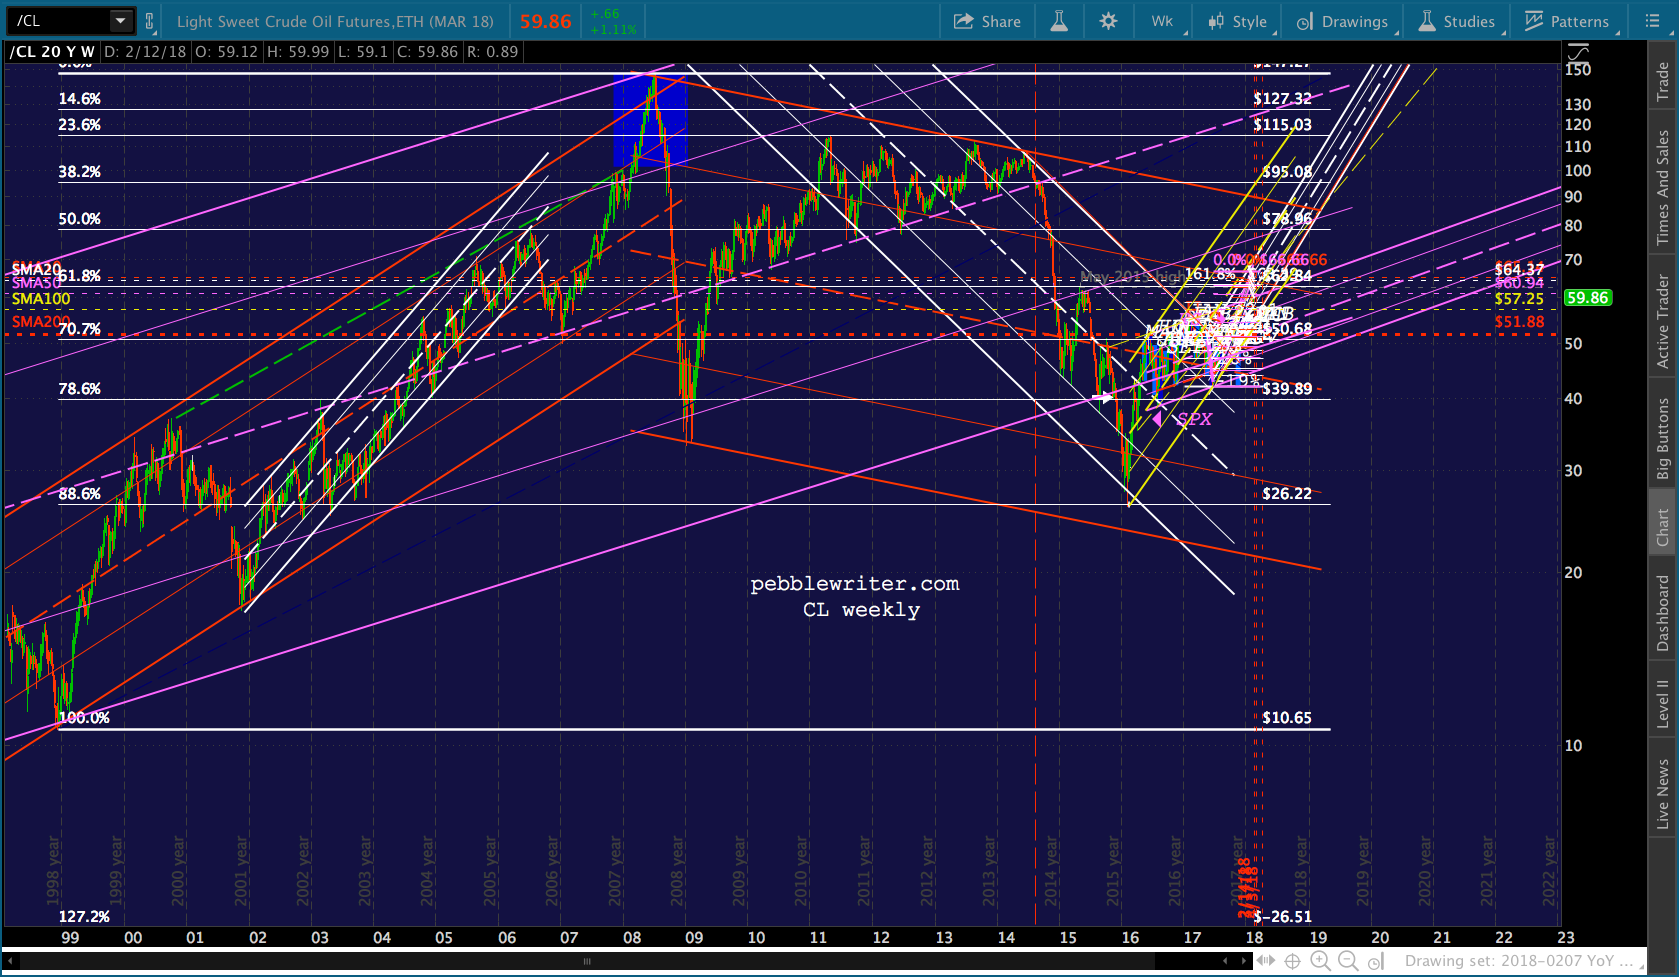 The yellow channel guided CL higher until it broke out of the channel illustrated at the top of this post, and subsequently reached the white .618 at 62.84.
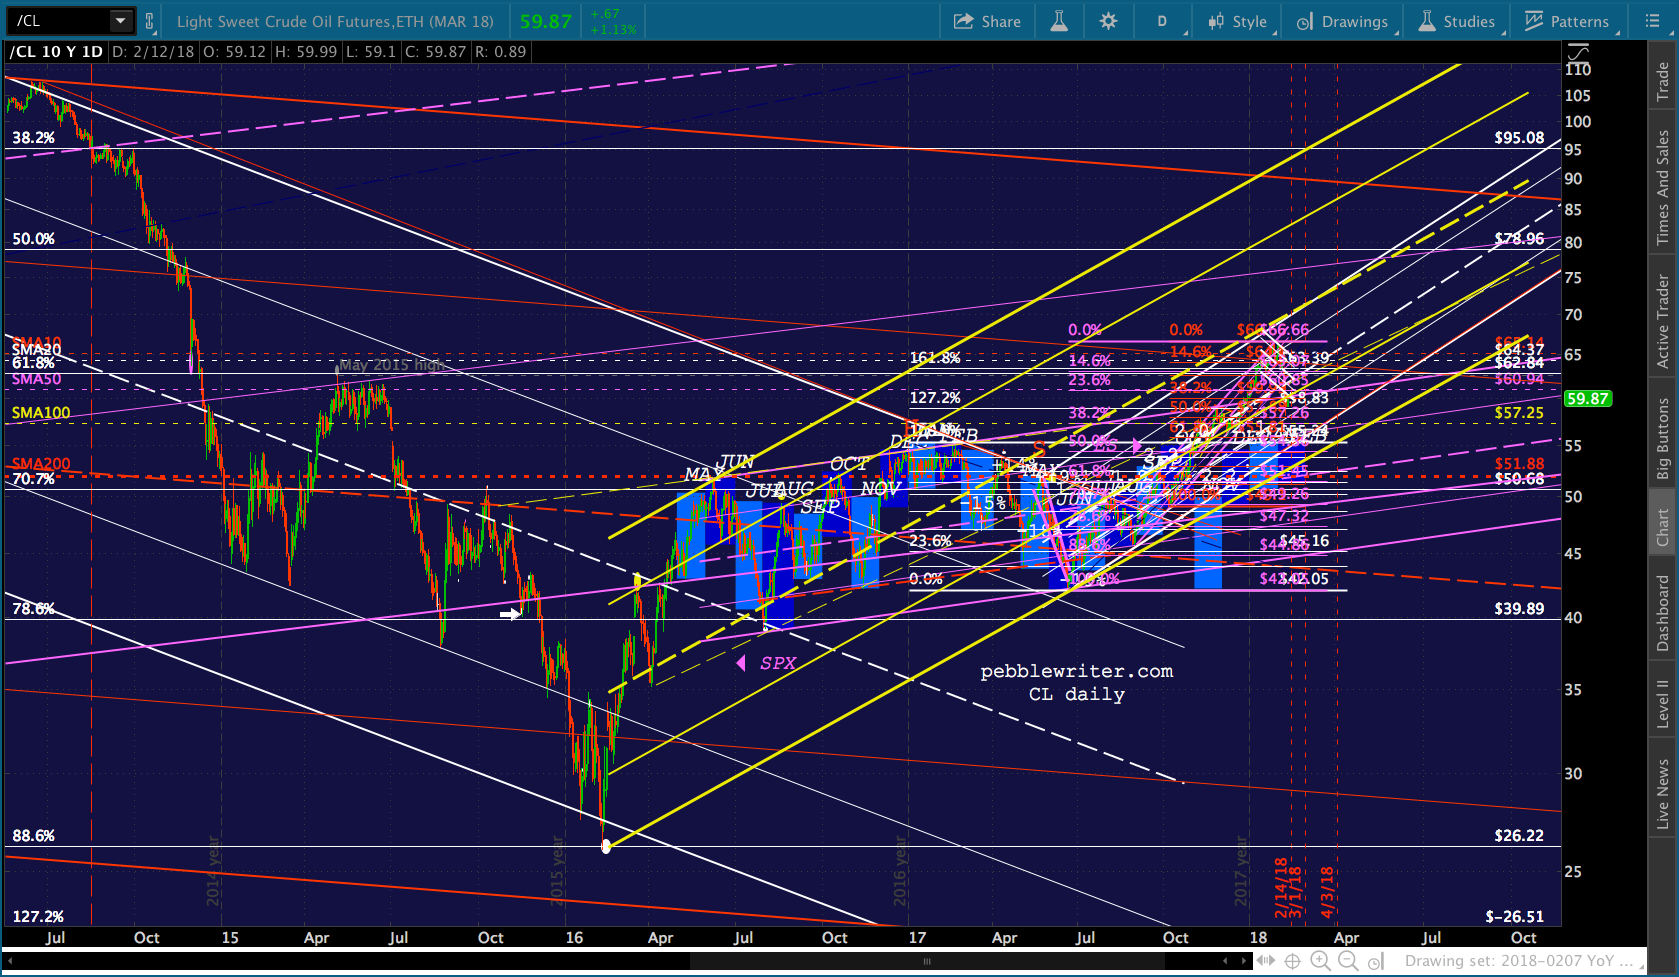 At this point, CL had also reached the 1.618 extension, the top of the rising purple channel dating back to Aug 2017, and the May 2015 highs. Naturally, it ignored all that resistance and punched higher.
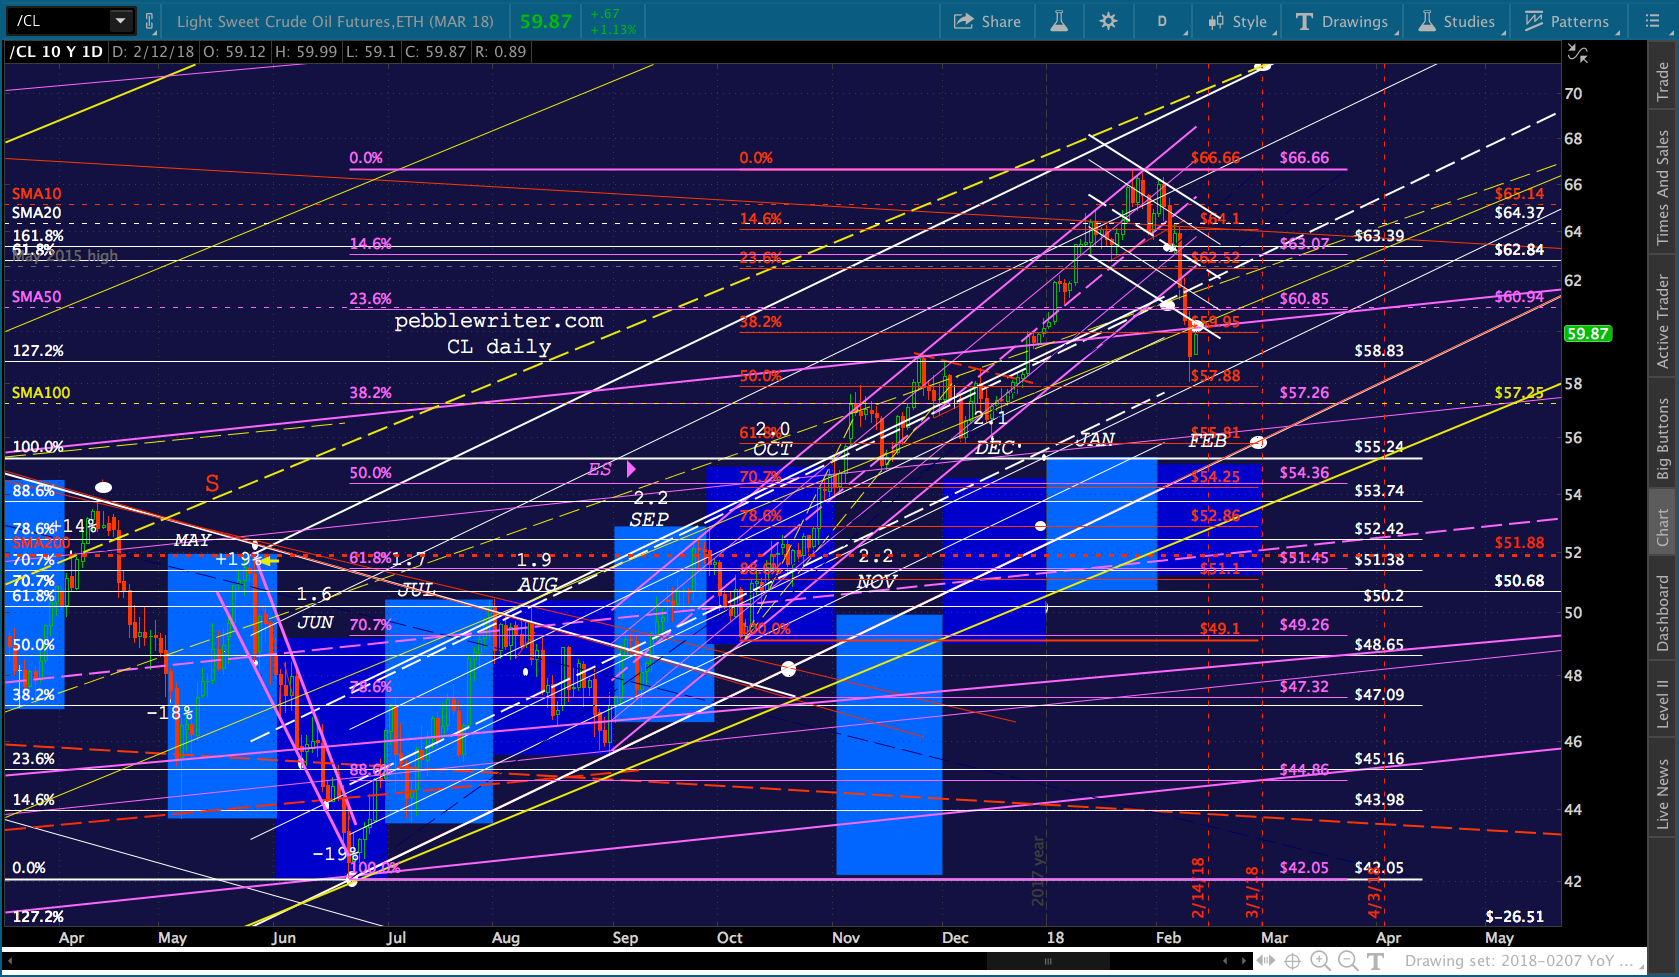 None of this made any sense — especially the channels, each of which was steeper than the last one. Now that the small purple channel has broken down, CL is back below the .618, and has reentered the larger purple channel, I think we’re going to see the channels normalize and align with the large yellow one it should have followed in the first place.
Here’s what I mean. By re-drawing the rising white channel to parallel the yellow one, we can see that the latest drop fell through its midline — though its on its way to backtest that midline — in addition to the purple channel top.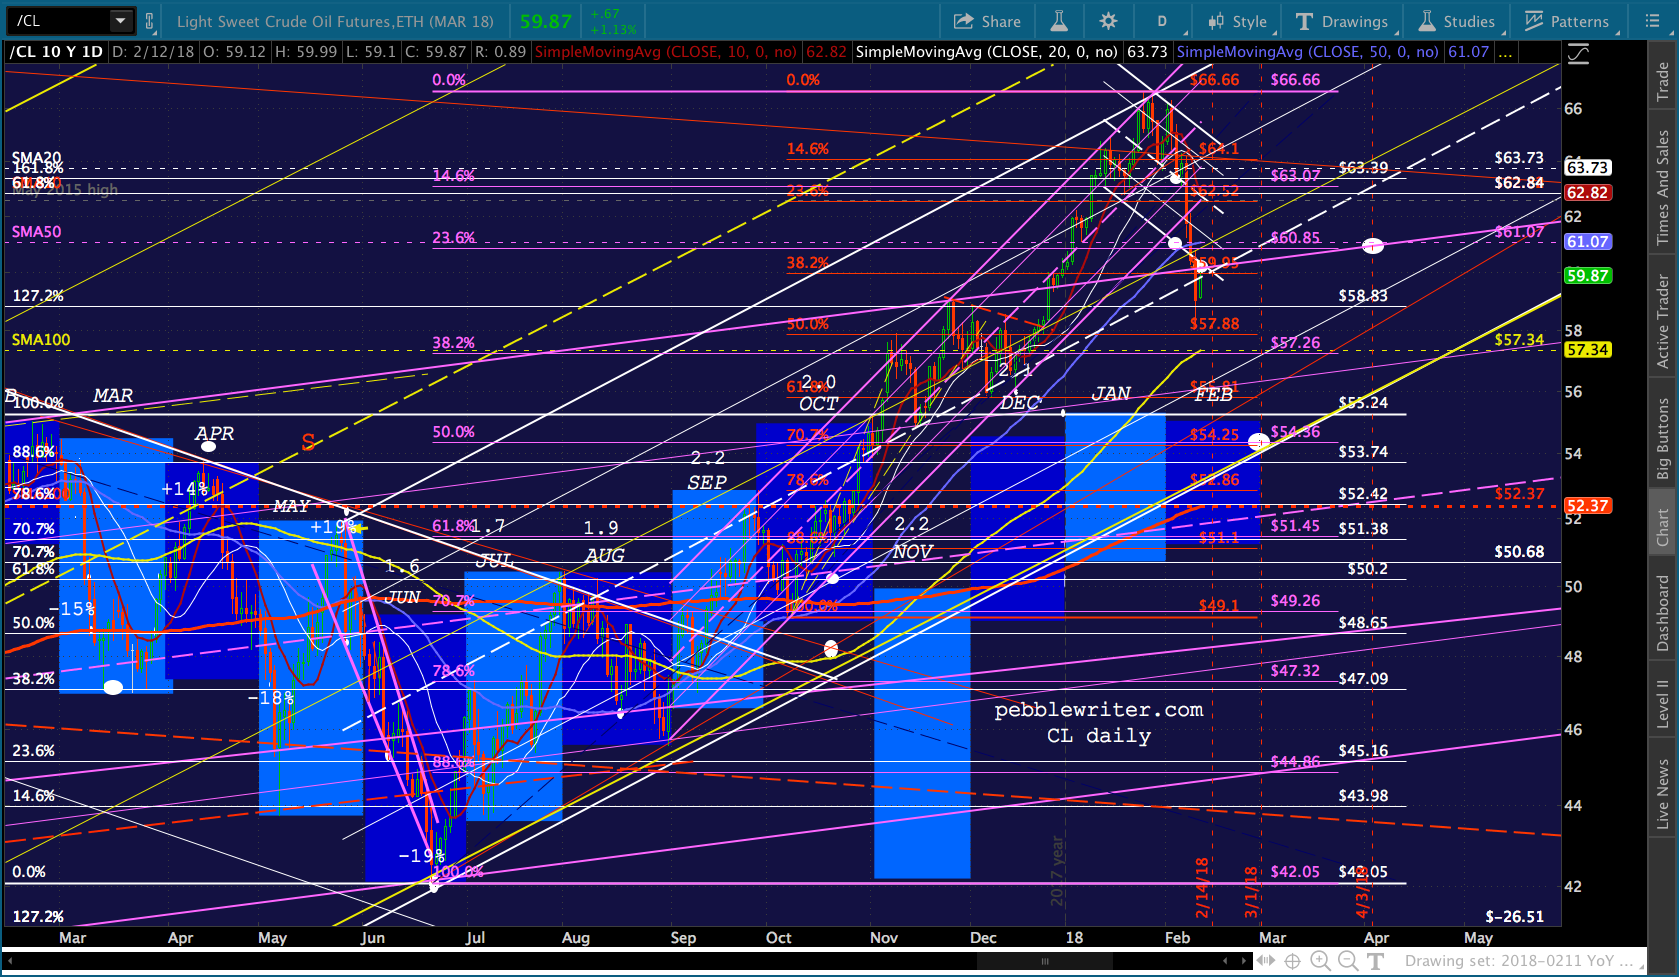 So, after an overshoot…we have a pretty obvious undershoot. If CL is unable to make it back over 59.85ish, then it will almost certainly tag the SMA100 at 57.34, and potentially a cluster of Fibs at 54.36.
If it can punch through 59.85ish, then we’d be facing a backtest of the broken purple channel at around 62.50-62.84. After that, the 66.66 highs should fall easily enough.
The problem with gains above 66.66 is that there isn’t much in the way of overhead resistance until 78! Frankly, I can’t imagine the Fed allowing such a dramatic rise in inflation. It’s going to be bad enough already for January – released Wed., Feb 14.
I’m doing some inflation calcs that might help shine a light on the next moves. But, suffice it to say that this drop during February should put things back on a more acceptable glideslope.
More later…