Year: 2016

  • What Goes Up…

    ES’ levitation off its election night lows has drawn very little attention.  But, as we discussed yesterday, it was a stark reminder of the ability and willingness of the central planners to do “whatever it takes” to keep stocks on track.2016-11-15-es-60-0600Frequently, though, these stick saves are more than was necessary, and they’re left with the question of how to back fill a rally without panicking the masses.  Such is the situation this week.

    continued for members… (more…)

  • The Big Picture: Nov 14, 2016

    In our last Big Picture post on Oct 26, we focused on two key drivers of equity values.

    The problem, as noted in Welcome to Peak Oil, is inflation….  CL peaked [October 9, 2015] at 50.92 and plunged to 26.05 over the next four months.  If it doesn’t do the same thing now, we’ll get year-over-year inflation.  Since this past Feb, CL has been the primary factor in stocks moving higher.  If it can’t maintain that role, then TPTB will need to find another algo engine — or stocks will fall.2016-10-10-cl-daily-big-pictureThe yen carry trade worked from 2011 – 2015, but can it be resurrected? USDJPY has certainly changed its tune since CL’s top first became a problem.  Note that it broke out of a very well-formed falling channel dating back to Oct 2015 at the very moment that CL was testing its yellow neckline.

    Oil has now fallen 18% since our Oct 10 top call [see: Welcome to Peak Oil], and USDJPY, has risen a spectacular 6.9% since last Tuesday night’s election lows.  That’s all well and good.  But, the big surprise in preparing this post was that the analog  [what’s this?] I first advanced 3 1/2 months ago [see: A New Analog: Aug 3, 2016] continues to play out relatively well.

    continued for members(more…)

  • Update on NYSE: Nov 13, 2016

    In our last update [see: Aug 23 Update on NYSE] we noted that the index’s difficulty in pushing above the .786 Fib at 10759 would likely result in a dip to test the SMA200 near the .618 at 10369.

    The subsequent bounce has, in my opinion, been overdone.  NYSE has criss-crossed the .786 at 10,759 15 of the past 30 sessions — not a great sign for the bulls.  I think it’s more likely to break down from here and (at least) backtest the .618 at 10,369.

    It wouldn’t be a big move, but it would jibe with my views on SPX of mostly sideways action through the election.  Note that the SMA200 should continue trending higher, arriving at the .618 (also, proximate to the 2007 highs) around election time — providing additional support in case it does break down.

    As it turned out, NYSE did run out of steam shortly after that post.  After Aug 23 (the yellow arrow below) it danced back and forth across the .786 for two weeks before finally breaking down on Sep 9.  Even then, it held on for another month before the rising white channel finally broke down.2016-11-13-nya-daily-cu-2229

    As expected, the selloff was mild.  It arrived at the 2007 highs a few days before the SMA200 reached the .618.  Like everything else that wasn’t nailed down, Nov 4 marked the bottom.  It has rallied strongly since then, almost reaching the .786 again this past week.

    So, it’s an excellent time to look at next steps, especially in light of our new big picture forecast for the next two months. (more…)

  • Update on RUT: Nov 11, 2016

    In our last update [see: Sep 2, 2016 Update on RUT] I noted that the index was approaching a key Fib level that should produce a sizeable drop to backtest an important channel.

    …with the .886 within a few points, we’ll find out.  We should get a pullback at 1255.77 that would start by backtesting the broken purple channel…If it happens, the purple channel top [1174] will likely hold.

    RUT went on to test 1255 on Sep 7 and again on Sep 22 before reversing. Because the 2nd attempt to break out delayed the reversal, the channel backtest produced a slightly greater drop: an 8% drop to 1156 rather than the 1174 I originally forecast.

    As expected, the channel top held.  RUT has since rebounded by 10.2% and is approaching new highs.  What’s next for this volatile index?

    continued for members(more…)

  • Which One is Lying?

    No, I’m not talking about politicians.  I’m talking about trend lines: the most basic of all chart patterns.  Let me explain.

    Everyone knows that VIX spikes when markets plunge, and plummets when they rally.  In point of fact, it used to work that way.  Increasingly, over the past few years, VIX spikes when markets plunge and plummets when central planners wish to support or drive stocks higher [if you have a hard time believing it’s a tool, just watch it dance around its SMA200 (15.6) today.]

    It’s one of the subtleties lost on most investors who don’t fully appreciate the degree to which central bankers and their functionaries intervene in markets nearly every day.  And, it’s one of the reasons S&P futures were able to execute a 152-pt turnaround Tuesday night.2016-11-11-vix-v-spx-clean

    Setting that aside for now, there’s a glaring discrepancy in the VIX charts at the moment.  The huge yellow channel dating back to 2010 has done a pretty good job of forecasting VIX’s lows, but a less than stellar job with its highs.

    The falling white channel, on the other hand, has done an excellent job with both highs and lows for the past year or so.  And, last, the rising red channel has worked well since its August lows, the tail end of its effort to save the world from Brexit.

    If we look at a closeup, however, we see a red trend line off the August lows that has done a very good job of providing support ever since.  We can construct a channel from it if we like, as seen below.2016-11-11-vix-v-spx-cu

    It clearly corroborates SPX’s decline since mid-August.  But, it’s in stark conflict with SPX’s breakout past the falling purple TL.  One of these TLs is correct; and, one of them is a liar.  The answer to which is which will determine whether the latest rally will last, or go down in flames.

    BTW, we remain short from 2177.60 yesterday afternoon.  Our downside targets remain unchanged.

    continued for members(more…)

  • A Good Crisis Pays Off

    With the S&P futures off around 100 points Tuesday night, I noted that if the selloff lasted, SPX had a very good chance of tagging the .786 retracement at 2034.97 the next day.  Instead, we got the biggest overnight turnaround since Mar 2009 and a breakout of the channel SPX has been in for the past three months.  What happened, and why?2016-11-10-usdjpy-daily-0605

    While most analysts were scratching their heads over the repercussions of a Trump presidency, central planners were busy ramping USDJPY for all it was worth.  Just this morning, it reached our next upside target — a rally of over 5% in about 24 hours.

    Was this merely a case of not letting a good crisis go to waste, or is there something more fundamentally bullish at work here?

    continued for members(more…)

  • The Fallout

    Just about everybody seems surprised, this morning.  Those who were rooting for Clinton are, of course, surprised that their candidate lost.  Those who were rooting for Trump are surprised that the election wasn’t more effectively rigged.  Those who didn’t vote are, no doubt, surprised that their vote might have mattered after all.

    The one thing there should be no surprise about is the degree to which the “market” was managed.  As we discussed on Monday in The Wheel’s Spinning:

    For the record, I consider it extremely presumptuous that the election risk is over and done with.  To repeat what I mentioned earlier, we saw the exact same thing happen with Brexit.  Knowing the downside risk, TPTB ran equities as high as they possibly could before the vote.  The subsequent downturn, thus, started from a much higher level.

    Monday and Tuesday were, obviously, an echo of the Brexit runup — with a runup that barely paused along the way to a 64-pt gain from Friday’s lows.2016-11-09-spx-5-0530It’s not such a big deal to lose 50-100 points if it’s from 64 points higher in the first place.  And, that’s exactly what we’re seeing this morning — except that TPTB learned another lesson from Brexit.  The damage control has been so effective overnight that the futures have already bounced 73 points off their overnight lows.

    One tool, VIX, is lower in the face of what is still a 25-pt drop in the S&P 500 futures.  As futures were plunging last night, VIX put in a preposterous 26% decline!2016-11-09-vix-60-0555The world has changed.  Investors will care.  The question is whether VIX and the other tools central banks have at their disposal will be enough to prevent serious fallout as they did with Brexit.

    With that in mind, we’ll take a look at the prospects of our downside targets playing out.

    continued for members(more…)

  • Election Day

    electionIt seemed like it would never get here.  And, of course, it won’t be over tonight. It’ll merely be on to the next chapter: the bickering, the legal challenges, the market fallout.

    The algos voted yesterday, with an incredibly strong push that exceeded three upside targets. The only silver lining for bears is that yesterday’s excesses are settling out, with backtests of that overhead “resistance” quite likely.

    continued for members(more…)

  • The Wheel’s Spinning

    Where it stops is anyone’s guess.  But, as with Brexit, the futures aren’t taking any chances. We’ve seen a broad advance in, well, practically everything over the weekend.  If a fall is coming, it’s going to be from higher.

    With SPX having reached our next downside target last week, we’ll take a quick look at our post-election targets.

    continued for members(more…)

  • Peak Oil: A Follow-Up

    Oil just tagged our next downside target at 44.10.  It’s been almost four weeks since we called the top on CL [see: Welcome to Peak Oil.]  CL has since fallen over 14%.  And, while it’s been a great short, its influence on SPX has been almost as impressive: a 4% drop (the thin purple line below.)2016-11-04-cl-v-spx-0600Unfortunately for equities, oil’s drop isn’t finished — not by a long shot.

    continued for members

    For starters, there’s a SMA200 down below at 43.31.  And, that doesn’t even begin to resolve the inflation problem.  2016-11-04-cl-daily-0600As we detailed in Watching and Waiting, the follow up to Peak Oil, CL must get back down below 30 in order not to have a big impact on headline inflation figures.  Using a back of the envelope calculation, if a 14% drop in CL produces a 4% drop in SPX, then another 32% drop in CL could produce a 190-pt drop in SPX.

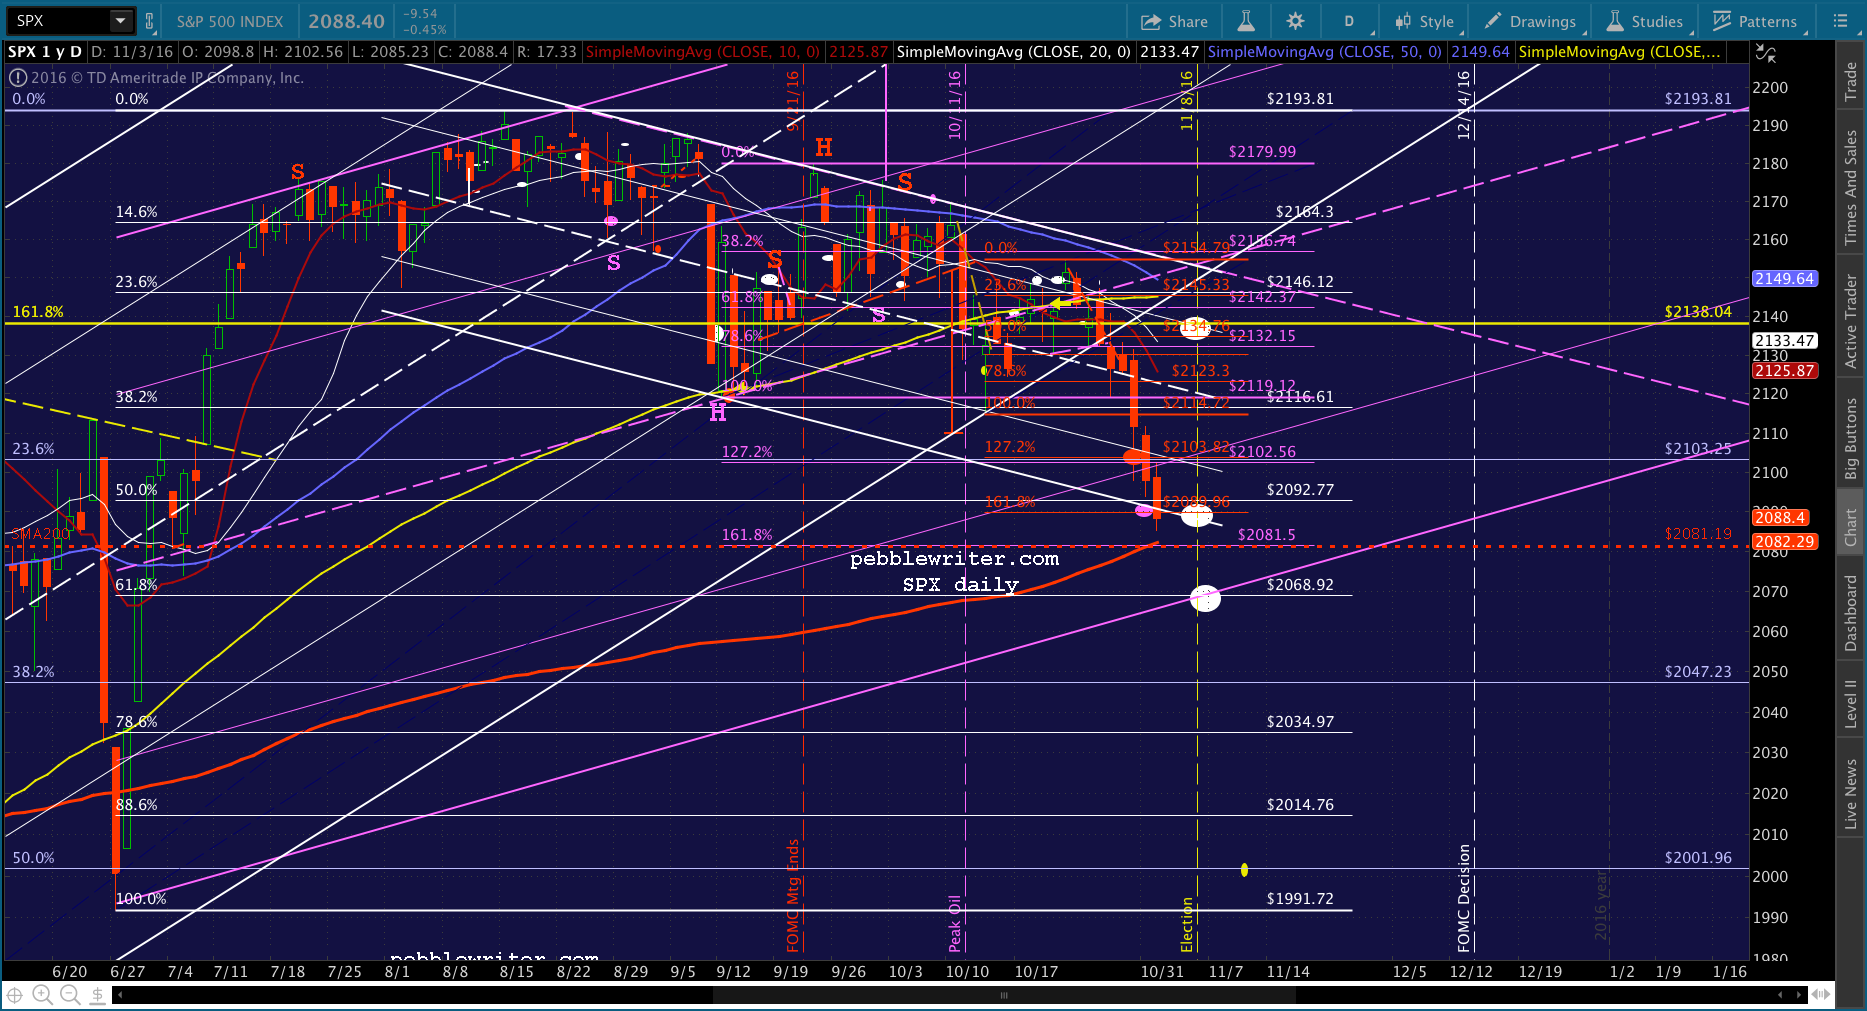
    But, is that likely?  It depends.  SPX and ES are both likely to tag their own SMA200s this morning.  If the slide that began on Aug 15 is to be arrested, this is the obvious support.  From yesterday’s close:2016-11-03-spx-daily-1258

    Everybody and their mother will be looking for a bounce here.  As we discussed yesterday, it’s also the 1.618 extension of the small, purple harmonic pattern.  But, to assume it’s the bottom, one would have to ignore the other, more prominent harmonic patterns, not to mention a large channel dating back to 2009. 2016-11-04-spx-weekly-0652Its bottom is currently at 1965, which is only slightly higher than the purple .618 at 1956.68.2016-11-04-spx-daily-0715

    Note, however, that the yellow channel charter above is only half of the channel from 2009 that actually connects the 666 lows.  Its bottom is currently closer to 1675, though they could limit it to another (5th) tag of 1823 by dragging it out until October 2017.

    2016-11-04-spx-expanded-0652

    BTW, ES is coming up on its SMA200 at 2077.72 and SPX’s is 2082.29.  Both should need to tag theirs in order for the interim bottom to take.  Of course, with everyone planning on buying the dip, it’ll probably take an act of congress (more likely, CL dropping below its SMA200) to effect the tags.

    What could drive SPX that much lower?  The biggest risk, IMO, is a departure from easy money policy.  The second biggest risk is a disappearance of carry trade vehicles.

    According to Trump, the Fed has created a “false economy” and an “artificial stock market.”  He has said Janet Yellen “should be ashamed of herself.”  Suffice it to say, there would likely be a shake up in the Fed’s policies if Trump were elected.

    Another possibility, though even more remote, is that the Fed starts taking inflation seriously and begins normalizing interest rates.  What goes up due to easy money, must come down — or, so the theory goes.

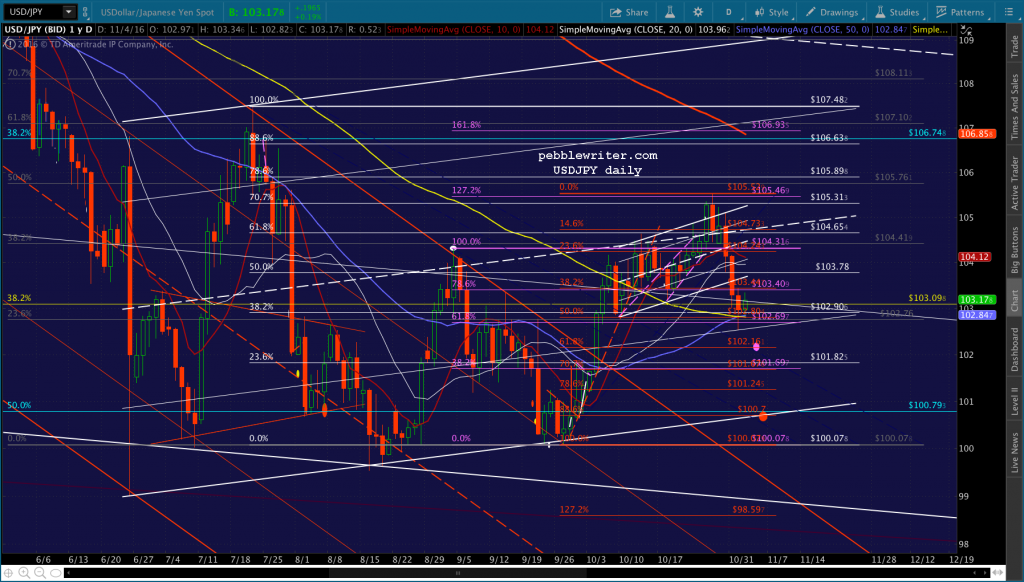
    As far as carry trades go…if CL drops out of the running, the most obvious candidate to take over again is the USDJPY.  Recall that it broke out of the falling channel it’s been in since Oct 2015 back on Oct 4.  2016-11-04-usdjpy-daily-0755But, lately, the yen’s been strengthening on the apparent lack of interest by the BoJ in expanding its QQE.  It looks more likely to backtest the red channel, or at least the white Flag Pattern bottom at 100.7 than it does push up to new highs.
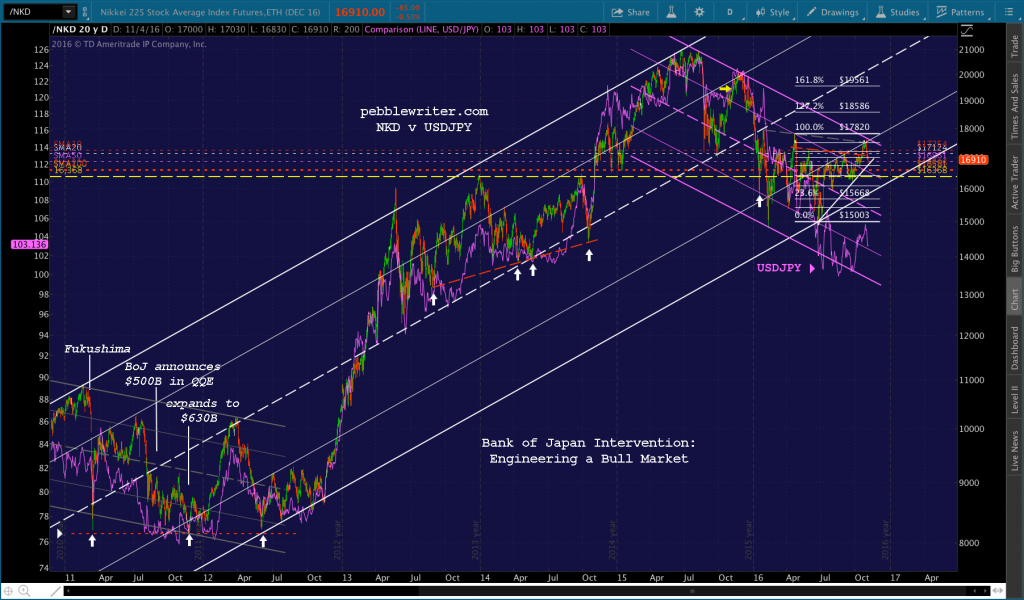
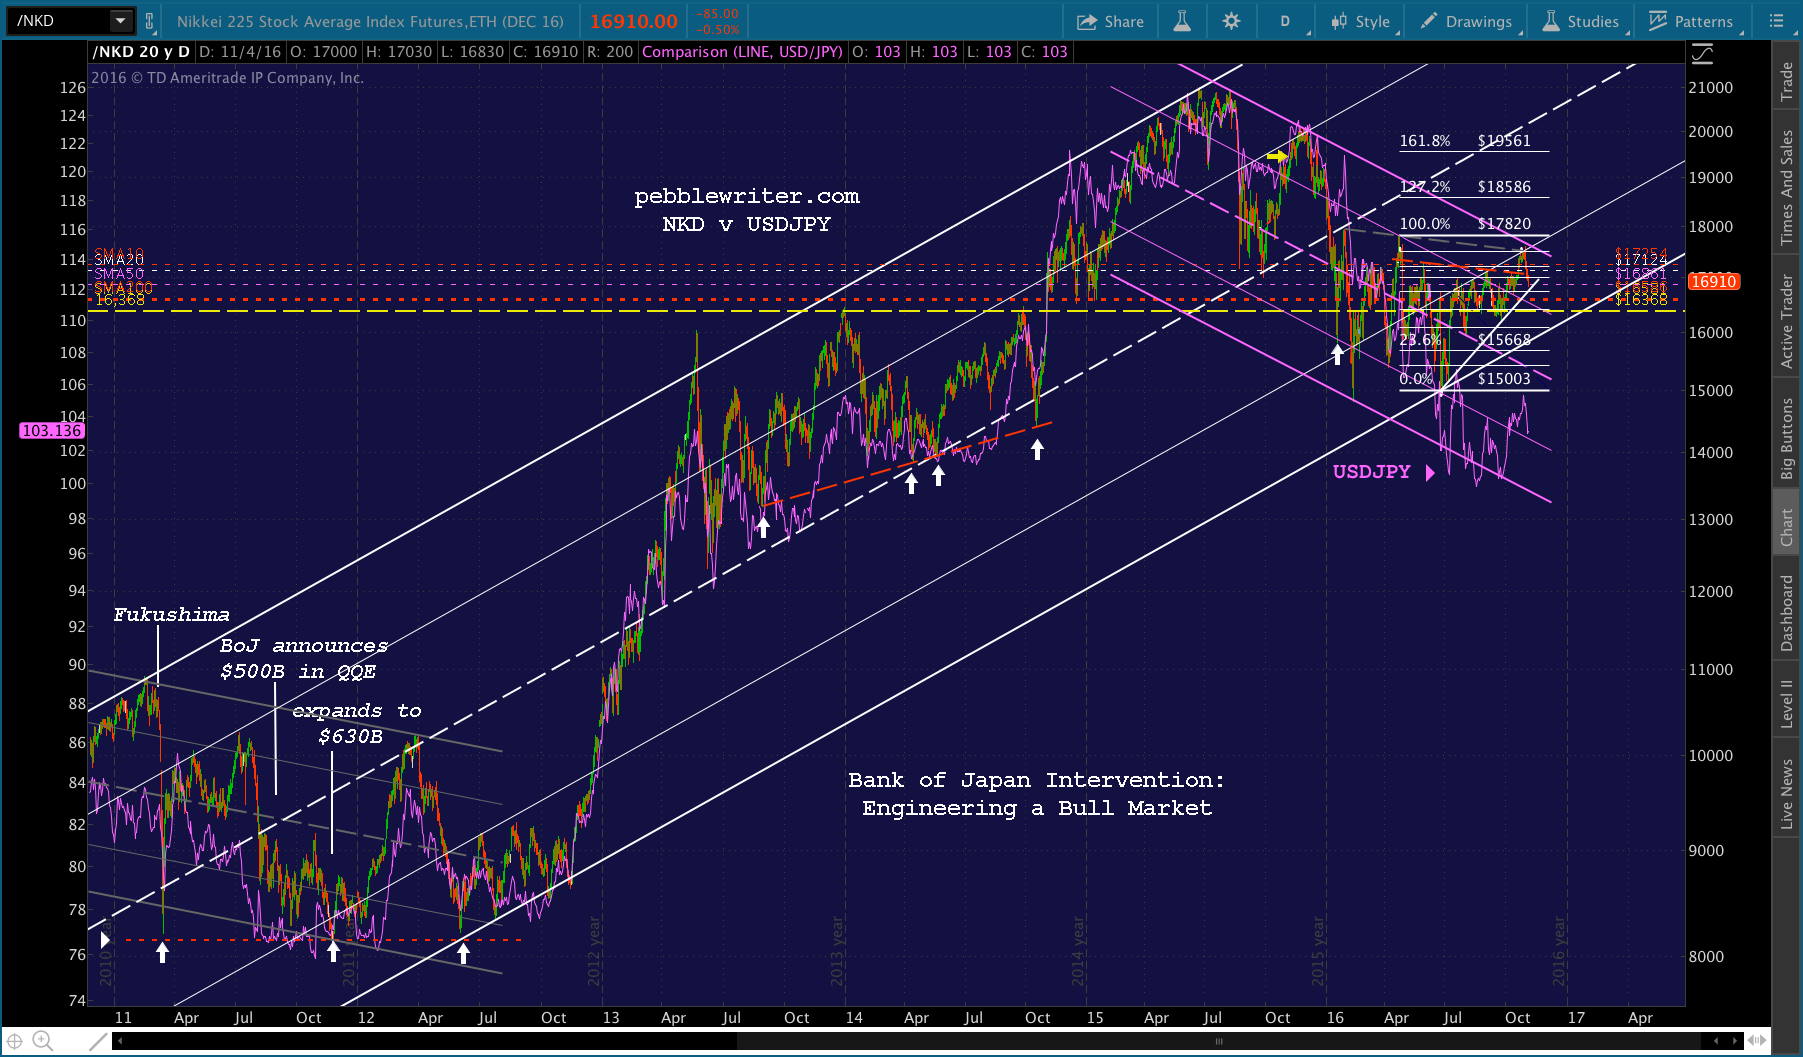
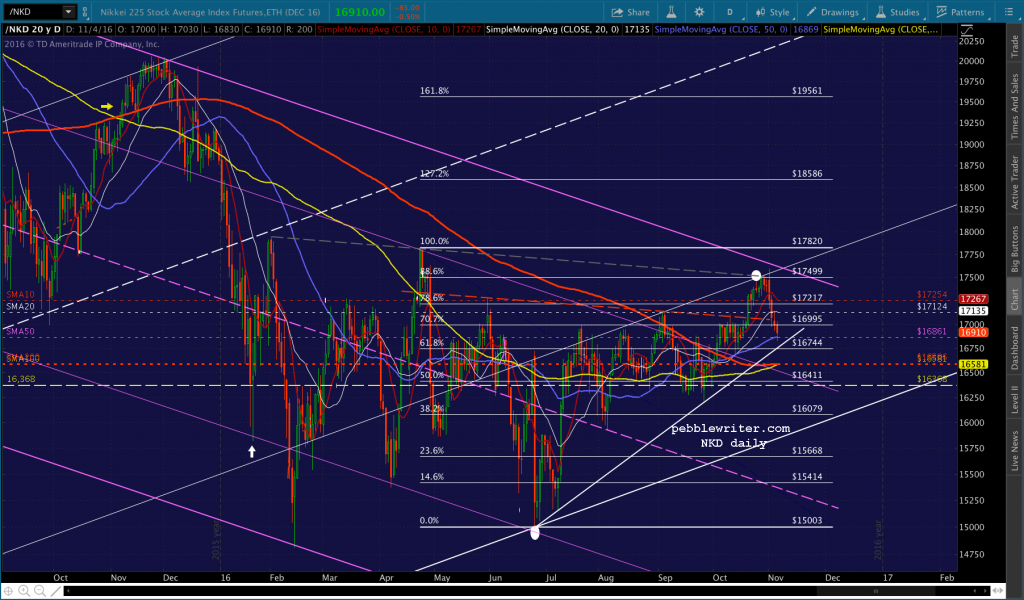
    However, NKD is going to be testing support again, soon.  After recently reversing at the .886 at 17499 as expected, it has a 5-6% buffer before the rising white channel bottom is in danger.2016-11-04-nkd-daily-0840
    Here’s the bigger picture:2016-11-04-nkd-v-usdjpy-0844

    Bottom line, there’s room to the downside — as evidenced by DX’s chart.2016-11-04-dx-daily-0600But, it won’t be long before the BoJ starts getting nervous enough to rev up the printing presses again.

    UPDATE:  12:33 PM

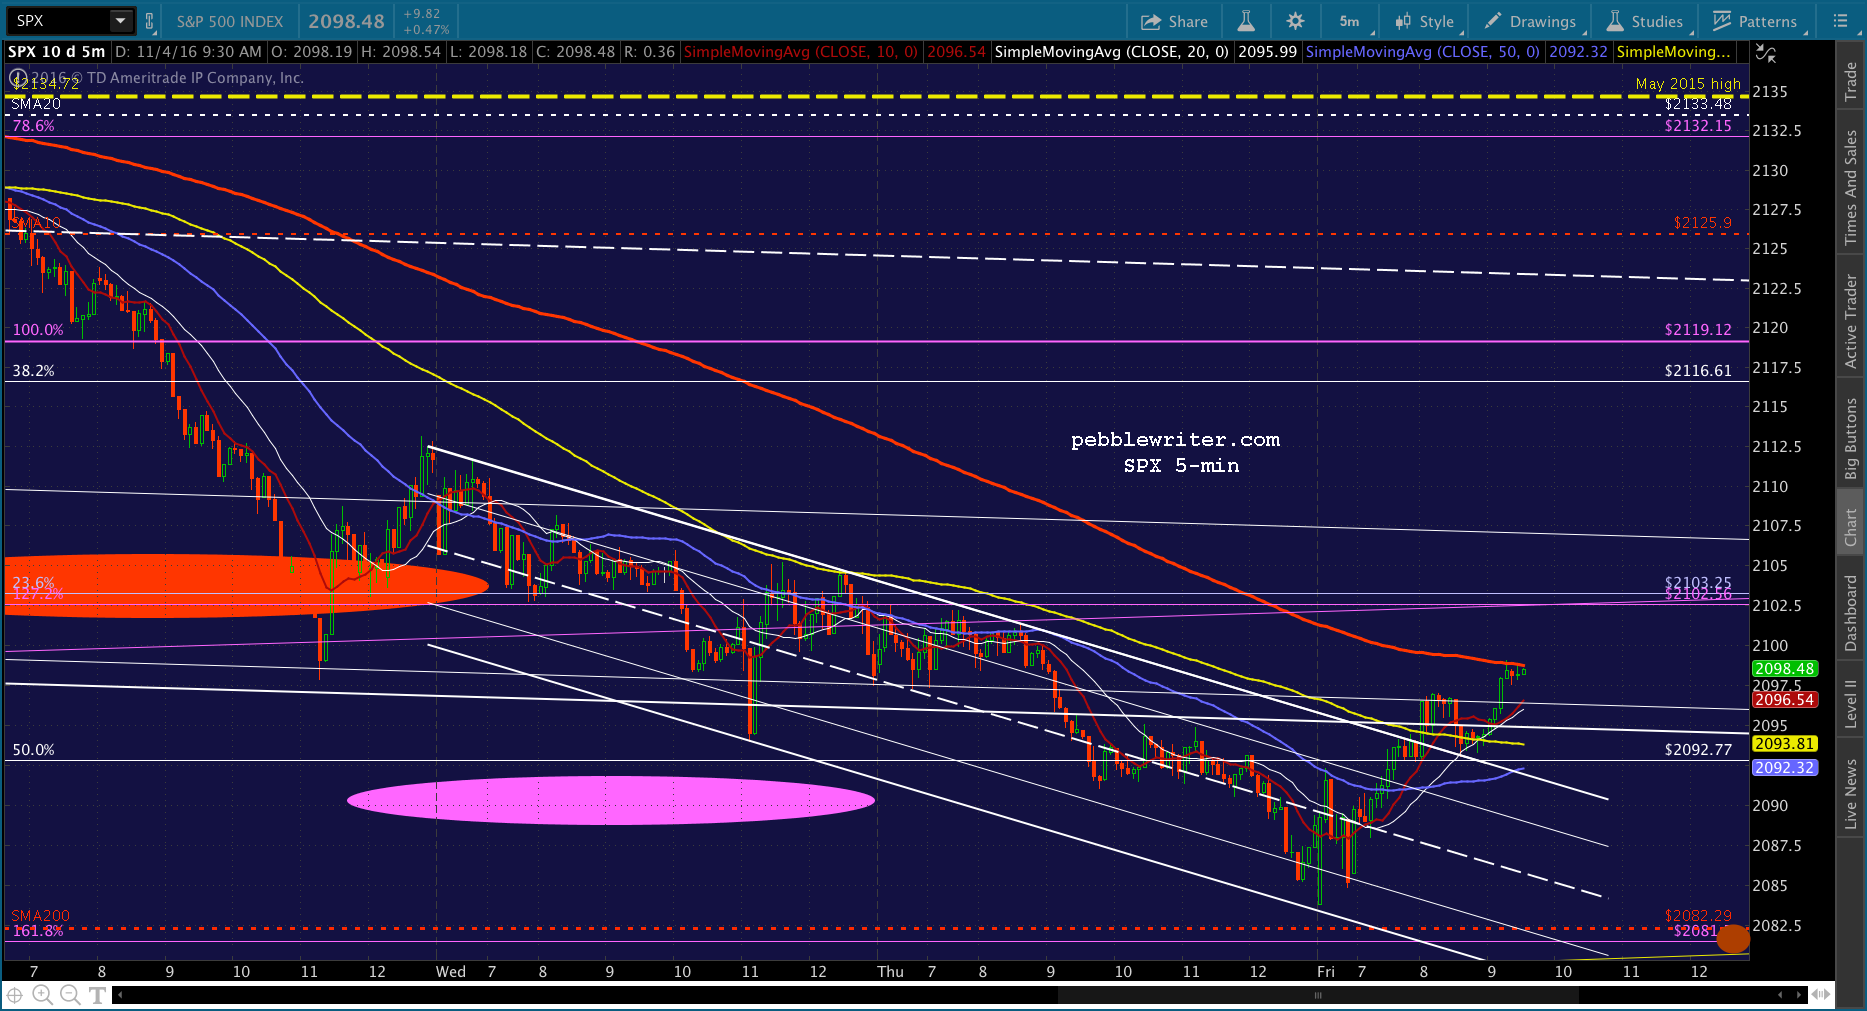
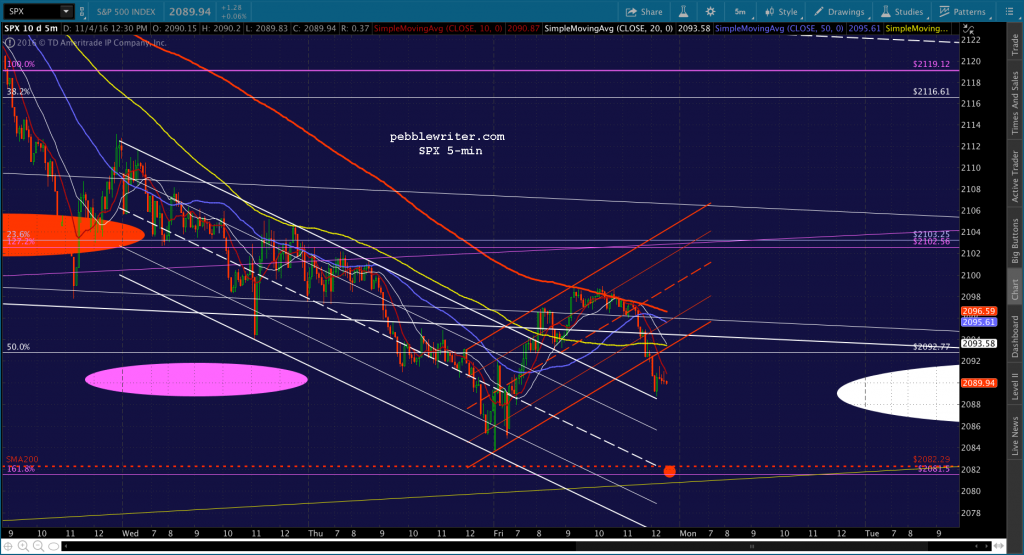
    SPX just tagged its SMA5 200.  If it’s going to tag the SMA200, this is the place for it to turn. If you’re not still holding short from earlier this week, 2098.48 is your entry point — with tight stops.2016-11-04-spx-5-0931

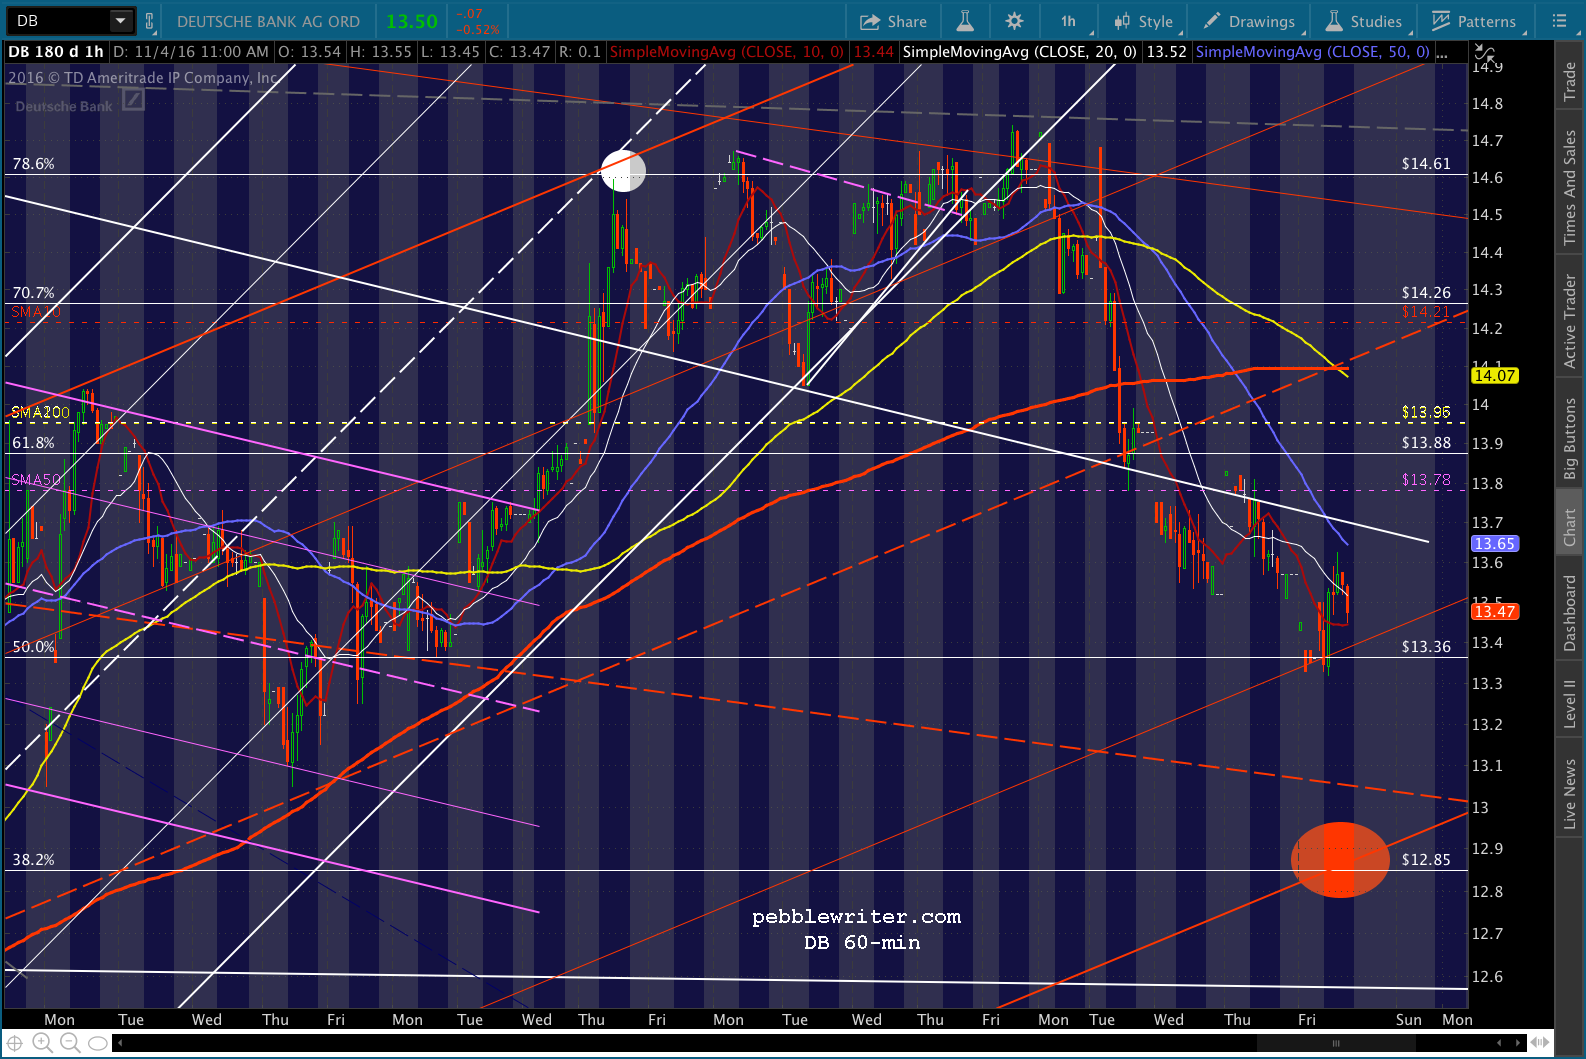
    For those keeping an eye on DB, there’s a clear path to 12.85 – 13.05 today.2016-11-04-db-5-1152

    UPDATE:  2:55 PM

    Finally breaking down?  We still have a shot at 2082.29 by 3:34PM…2016-11-04-spx-5-1155UPDATE:  3:31 PM

    Almost there.  As always, hold short over the weekend only if you can hedge or handle the gap risk.  Otherwise, we’ll see how low we can ride it before the bell.
    2016-11-04-spx-5-1231