

Oil broke down as expected yesterday, leading stocks lower after a week of trying to retrace losses from earlier this month. It occurred despite an impressive spike in USDJPY, which should be concerning to central planners.
Since oil first peaked on Oct 10, equities have had a tough time of it. As we discussed in Welcome to Peak Oil, it will continue to be a problem.

We’ll take a look at why, and what it might portend for equities over the coming weeks.
continued for members…
Today’s initial target: look for SPX to sell off to the purple .886 at 2132.91 this morning. Though, the channel bottom at 2131ish looks like a slightly better fit.
CL is backtesting the falling white channel top, but has an EIA inventory report coming out at 10:30.  And, USDJPY is trying to transition from the falling red channel into the rising white channel.
UPDATE: 9:37 AM
SPX reached the .886, but could have a little further to go. I’d go long here with relatively loose stops. Targets: SMA10 at 2139.21, SMA100 at 2143.89, the white .786 at 2157.86, and the SMA50 at 2158.70.
USDJPY has reacted off the rising purple TL — also the rising white channel midline. If it slips, the SMA10 is just below at 103.94. Note that CL isn’t reacting much here at the channel top. If the EIA report echoes yesterday’s API, we can expect to see it break down, taking stocks with.
UPDATE: 10:33 AM
Pretty positive report, as enough to get CL up to backtest its neckline. If it can pop through, even for a little while, this would help stocks greatly. USDJPY is also ramping…just because.


UPDATE: 11:07 AM
SPX just shot up to our second upside target — the SMA100 — and is approaching the two midlines and the SMA5 200 and the red .618. I’d take profits here and wait for the short term SMAs to catch up.


UPDATE: 12:09 PM
Back to long here at 2142.39, as SPX is sort of backtesting the falling white channel. More importantly, it has support from the SMA5 20 now. Obviously, the lack of a full backtest means it might not take off at this very point. I can imagine it dithering around and backtesting the SMA10 at 2139.21, as the upward trajectory if it rises from here gets SPX to 2157-2160 a little too soon.

UPDATE: 12:29 PM
Losing ground here. Back to cash at 2142.54, as it appears we need more of a backtest.
USDJPY is ramping like crazy, but just ran into its .618.  Together with CL’s continuing weakness, it’s not enough to turn SPX right now.
UPDATE: 1:15 PM
Backtest and SMA10 in one. Long here at 2139.19. The bulls really need this to hold.
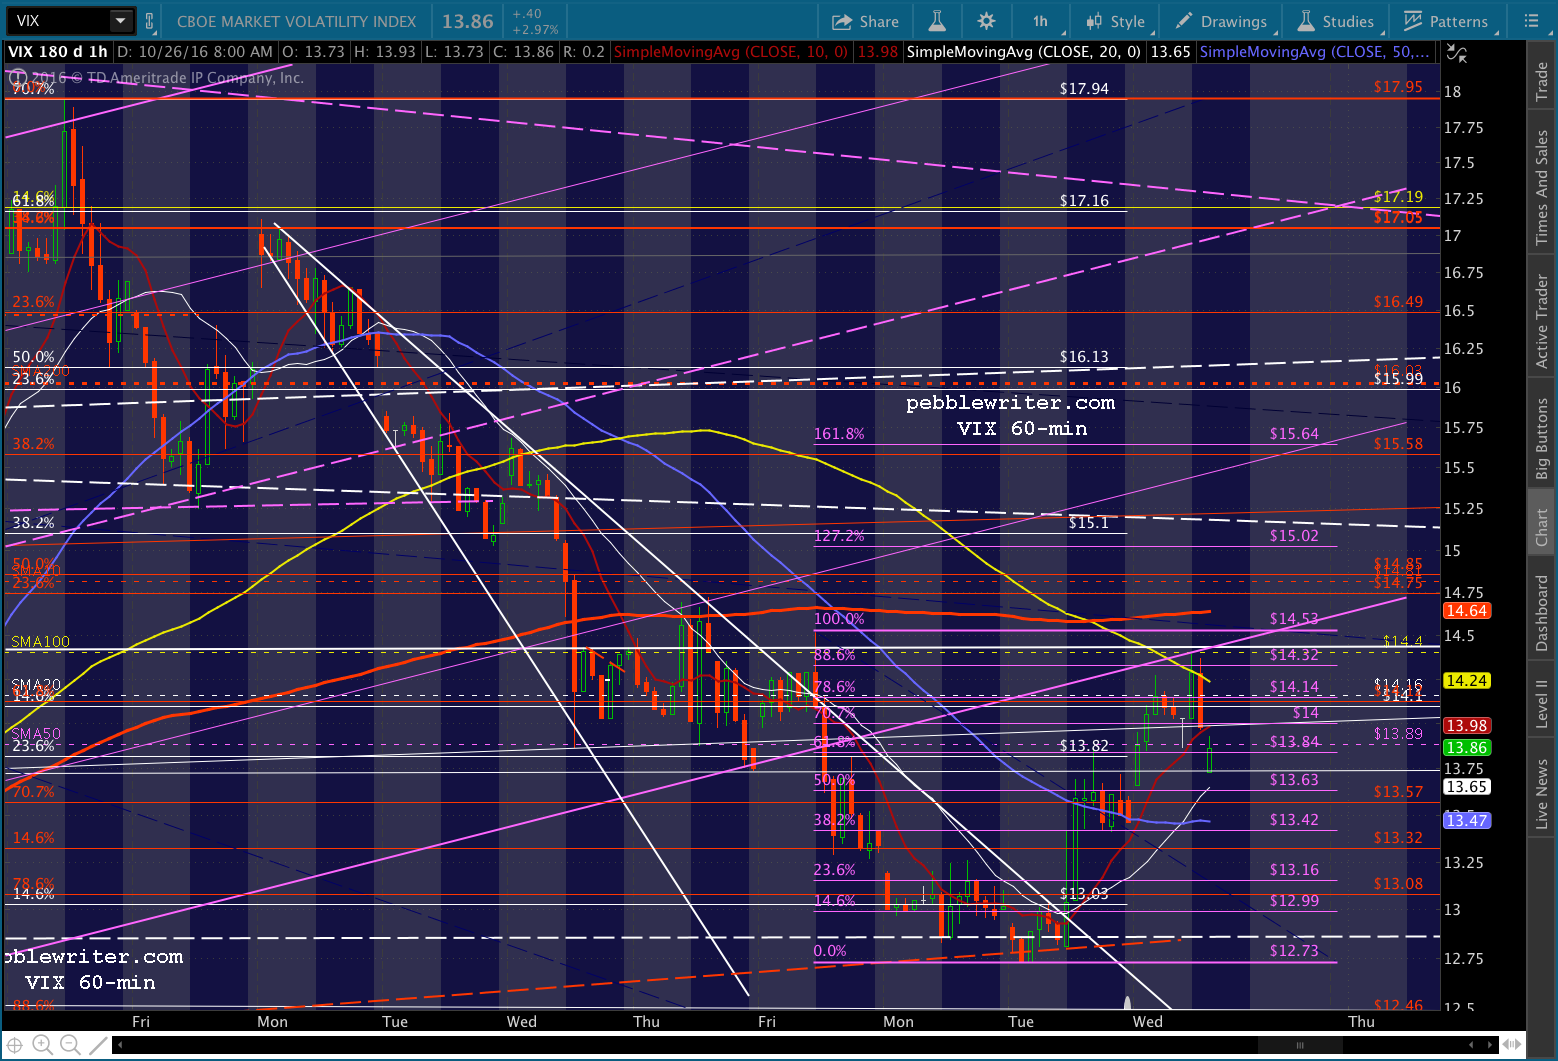
Note that VIX has reached its SMA100 — should see a sharp reversal.
I’d say we should see DB pop up to 15.04 on a backtest of the broken white channel while tagging the red channel top again. But, the news hasn’t been very positive today, and Q3 earnings are due out tomorrow…

UPDATE: 1:42 PM
It’s not holding. Back to cash here at 2138.13. 2138.04 should be support. But, if it were, 2132 would have held on ES and VIX wouldn’t have just made a new high, and USDJPY wouldn’t be swooning. Now, I’m wondering if we’ll get the white channel bottom tag we should have made this morning. It didn’t miss by much, but maybe it was enough to require another leg down. If SPX can hold 2138, I’ll get bullish again (at least, for 2157.) Otherwise, the sidelines seems like a very reasonable place to be.


UPDATE: 2:10 PM
I’ll take another shot at a bounce here off the 2134.72 2015 high. Back to long at 2135.36 with tight stops.
DB is testing its SMA5 200 on a TL from Monday night’s lows. Perhaps it’ll get a bounce here. If SPX doesn’t hold, ES suggests a sell off of another 14-17 points to ES 2117 or 2112, about 2119-2122 on SPX.
UPDATE: 3:50 PM
Back to cash here at 2140.62.

Maybe there’s more upside ahead, but momentum looks really lousy here. So, this is either a real good head fake, or some amazingly positive news will come out in the next few hours, or VIX is about to get hammered…or, there’s more downside to come. We’re still up handsomely, so I’d rather bank that and not have to worry about it overnight.


I’m going to take an actual lunch break, and will finish up the big picture in an hour or so.
.
* * * * *
Okay, back to the big picture…
Our premise is that oil must continue to decline. They might hold off on any major moves until after the election. After that, downtrend.
The problem, as noted in Welcome to Peak Oil, is inflation. This chart, posted the next day in Watching and Waiting, shows that CL peaked exactly one year prior at 50.92 and plunged to 26.05 over the next four months. If it doesn’t do the same thing now, we’ll get year over year inflation.
Since this past Feb, CL has been the primary factor in stocks moving higher. If it can’t maintain that role, then TPTB will need to find another algo engine or stocks will fall. And, right now, CL is clinging to a breakout that looks tenuous at best.
VIX has certainly been helpful, especially when trying to nudge SPX up over resistance or overnight ramp jobs. But, it has its limitations.
The yen carry trade worked from 2011 – 2015, but can it be resurrected? USDJPY has certainly changed its tune since CL’s top first became a problem. Note that it broke out of a very well-formed falling channel dating back to Oct 2015 at the very moment that CL was testing its yellow neckline.
And, the moment CL reached Peak Oil, USDJPY decided it was time to stop backtesting that falling red channel — or, even the new, rising white channel! — and start angling higher instead. It has since made a couple of higher lows and higher highs — disregarding important Fib levels along the way.
Remember, a rising USDJPY means the yen is being devalued. Imports are more expensive. Imports such as oil. So, a drop in CL as USDJPY rises would work from the standpoint of keeping US and Japanese inflation in check.
But, as we’ve seen over the past several hours, stocks can’t handle lower oil prices. Maybe if they knew the BoJ was going to go full tilt and devalue back to 150… but, otherwise, we’ll get more days like this where stocks sell off in lock step with oil.
Let’s set aside the tool, and focus on the outcome. SPX shot up from the interrupted Brexit sell-off to new all-time highs as seen in the chart below. It has remained in a trading range between 2115-2193 ever since.
If we zoom in on the top, we can see a pretty well-defined neckline for an IH&S (drawn in purple.) The bullish case, — if things go well between now and the election — would be a breakout of the IH&S (with the purple neckline.) This would target about 2220.

If things don’t go well between now and the election (whatever that means), then it’s easy to imagine SPX landing around the .500 Fib at 2092.77 by then. In fact, we can construct a decent looking falling purple channel from the neckline. It also appears as though the SMA200 might pass through 2092.77 in a couple of weeks — a bonus.
Politics aside, I think a Trump election would present challenges to the Fed and, thus, to stocks. While a Clinton election would probably mean more of the same [can you tell I’m not crazy about either one?]
More later…
.
.
.
.
Comments
4 responses to “The Big Picture: Oct 26, 2016”
One thing that seems to be more prevalent now is the inability of TPTB to get ramps going. Since your Peak Oil call the ramps have struggled during RTH. Using the VIX has to mildly hurt them as well as the volatility crush offsets any gains in the options world for the friends of TPTB. The underlying feel does seem weak and tenuous. Once again, PW, nice work on the Peak Oil and where it goes from there.
Thanks for your thoughts, Chris. I agree with you that it’s getting tougher, and likely more expensive. I think once they get past the election, there will be a lot of “adjusting” to do.
PW, I have read all your posts about Oil, and it seems like a longer term (the rest of this year, for example) short position on Oil is good to take? Of course nothing is 100%, but do you think we can expect below $30 oil before March 2017?
If you like my Peak Oil argument, it seems to make sense to short it. The thing I worry about is that central bankers are already talking about higher inflation being not such a bad thing. I believe they’re preparing us for it, probably because they realize the “market” can’t continue to rally with falling oil prices. The wildcard: can TPTB rev up the yen carry trade again? Then there’s always the risk of an escalation in the Persian Gulf…