

In our last update [see: Aug 23 Update on NYSE] we noted that the index’s difficulty in pushing above the .786 Fib at 10759 would likely result in a dip to test the SMA200 near the .618 at 10369.
The subsequent bounce has, in my opinion, been overdone. NYSE has criss-crossed the .786 at 10,759 15 of the past 30 sessions — not a great sign for the bulls. I think it’s more likely to break down from here and (at least) backtest the .618 at 10,369.
It wouldn’t be a big move, but it would jibe with my views on SPX of mostly sideways action through the election. Note that the SMA200 should continue trending higher, arriving at the .618 (also, proximate to the 2007 highs) around election time — providing additional support in case it does break down.
As it turned out, NYSE did run out of steam shortly after that post. After Aug 23 (the yellow arrow below) it danced back and forth across the .786 for two weeks before finally breaking down on Sep 9. Even then, it held on for another month before the rising white channel finally broke down.
As expected, the selloff was mild. It arrived at the 2007 highs a few days before the SMA200 reached the .618. Like everything else that wasn’t nailed down, Nov 4 marked the bottom. It has rallied strongly since then, almost reaching the .786 again this past week.
So, it’s an excellent time to look at next steps, especially in light of our new big picture forecast for the next two months.Looking at the big picture, we’re reminded that this index hasn’t expanded much on its 2007 highs. In 2015, it didn’t even reach the halfway mark between its 2007 highs and a 1.272 extension.
Though I’ve mentioned it before, the falling yellow channel should have stopped it in its tracks at the white .886 at 9679 in 2013. Everything that came after that is, in my book, pure, unadulterated manipulation. So, it’s little surprise that the yellow channel backtest at the .786 was so well defended.
It’s also interesting to me that this backtest fits perfectly as a backtest of the midline of a channel I’ve drawn in (gray) that descends from the TL between the 1999 and 2007 tops.

The rising red channel is suspect. It only makes sense when we look at it in terms of an expansion as shown below. The expansion begs the question: when will we see a dip south of its midline again? The logical answer is after the channel bottom tops the yellow channel in mid-2018 — which is probably a pretty depressing scenario for both bears and bulls alike.
Currently, NYSE sits at the neckline of a rather large IH&S Pattern. If it’s able to push through again — this would be the 5th attempt — then it’s not hard to imagine it reaching the red .886 within the next two weeks — say, Nov 25. It’s a 2-3% move, which fits with the SPX scenario that seems most likely.
Of course, if NYSE can break 10990.75, then the white channel top and red midline intersect around 11, 450 in early January. I have Jan 9 as a potentially significant day. If it can’t push through 10,668 this time, then the downside looks like 10,145 by early Dec. And, if that doesn’t hold, then 9684 is a good possibility by mid-Feb.
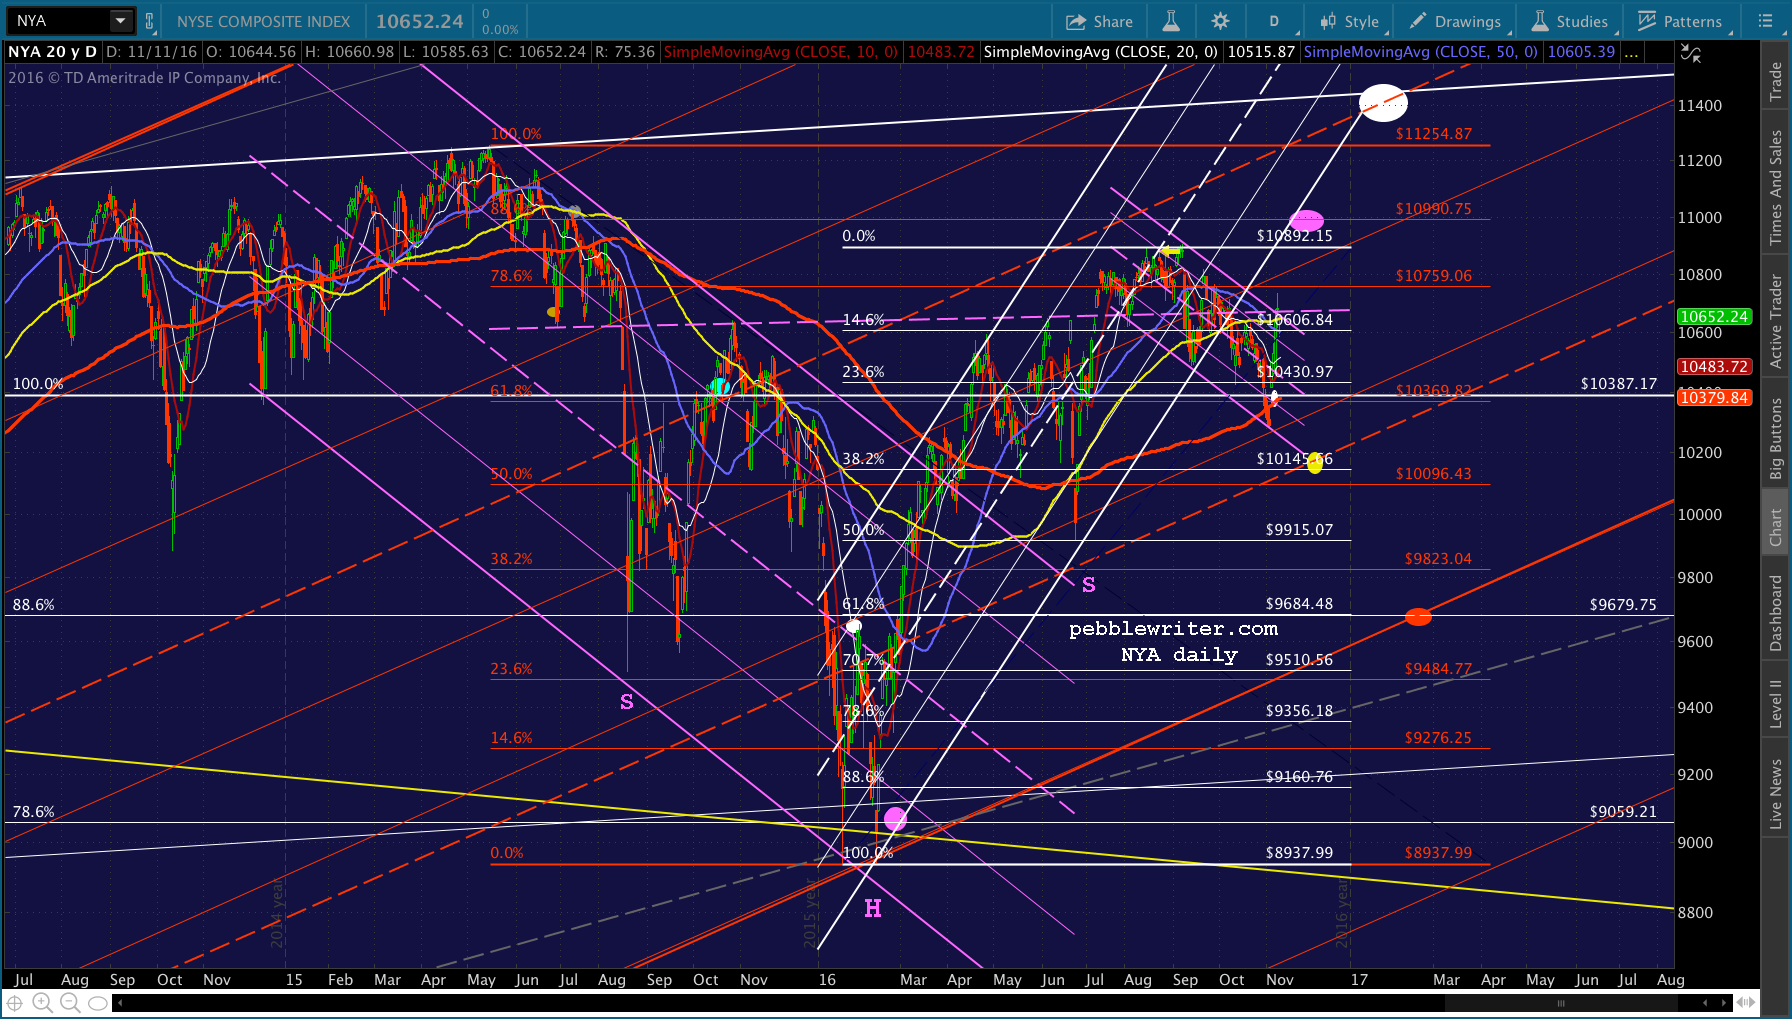
Stay tuned.