

When we last took a look at RUT [see: May 30, 2016 Update] it was pushing higher within a steep channel, but was going to run into resistance very soon. I closed my eyes and threw a few darts, and this is what stuck: upside targets at 1200 and 1255.77, and a downside target at 1070 (just in case the channel broke down.)

Little did I know at the time that all three targets would end up coming into play. Here’s the same chart, updated with the price action for the three months since then.
RUT reversed at 1190.17, 10 points shy of the purple target, then plunged 9% to 1085, 15 points shy of the yellow target. It then spiked over 12% to come within 5 points of the white 1255.77 target — where it now sits.
Aside from the ugliness of the channel breakdown (Brexit) that magically healed itself a few sessions later (price manipulation) it makes for a pretty nifty Bat Pattern.
Is this the end of the road, or is RUT destined for new highs?
continued for members...
Because RUT entails 2000 stocks, compared to the Dow 30 or the S&P 500, it’s inherently more difficult to manipulate. Yet, as we saw with the Brexit recovery, it will respond to large, powerful moves in the broader “markets.”
The view from 30,000 feet shows a break down, a rejoining, and then a break out of the falling white channel. The larger and very well-formed falling purple channel did an excellent job of guiding prices lower until it was broken out of following the Brexit recovery.
These are same chart tricks that were performed by both SPX and DJI. However, they both recently topped May 2015’s highs, while RUT is just now approaching the .886 of its drop from May 2015.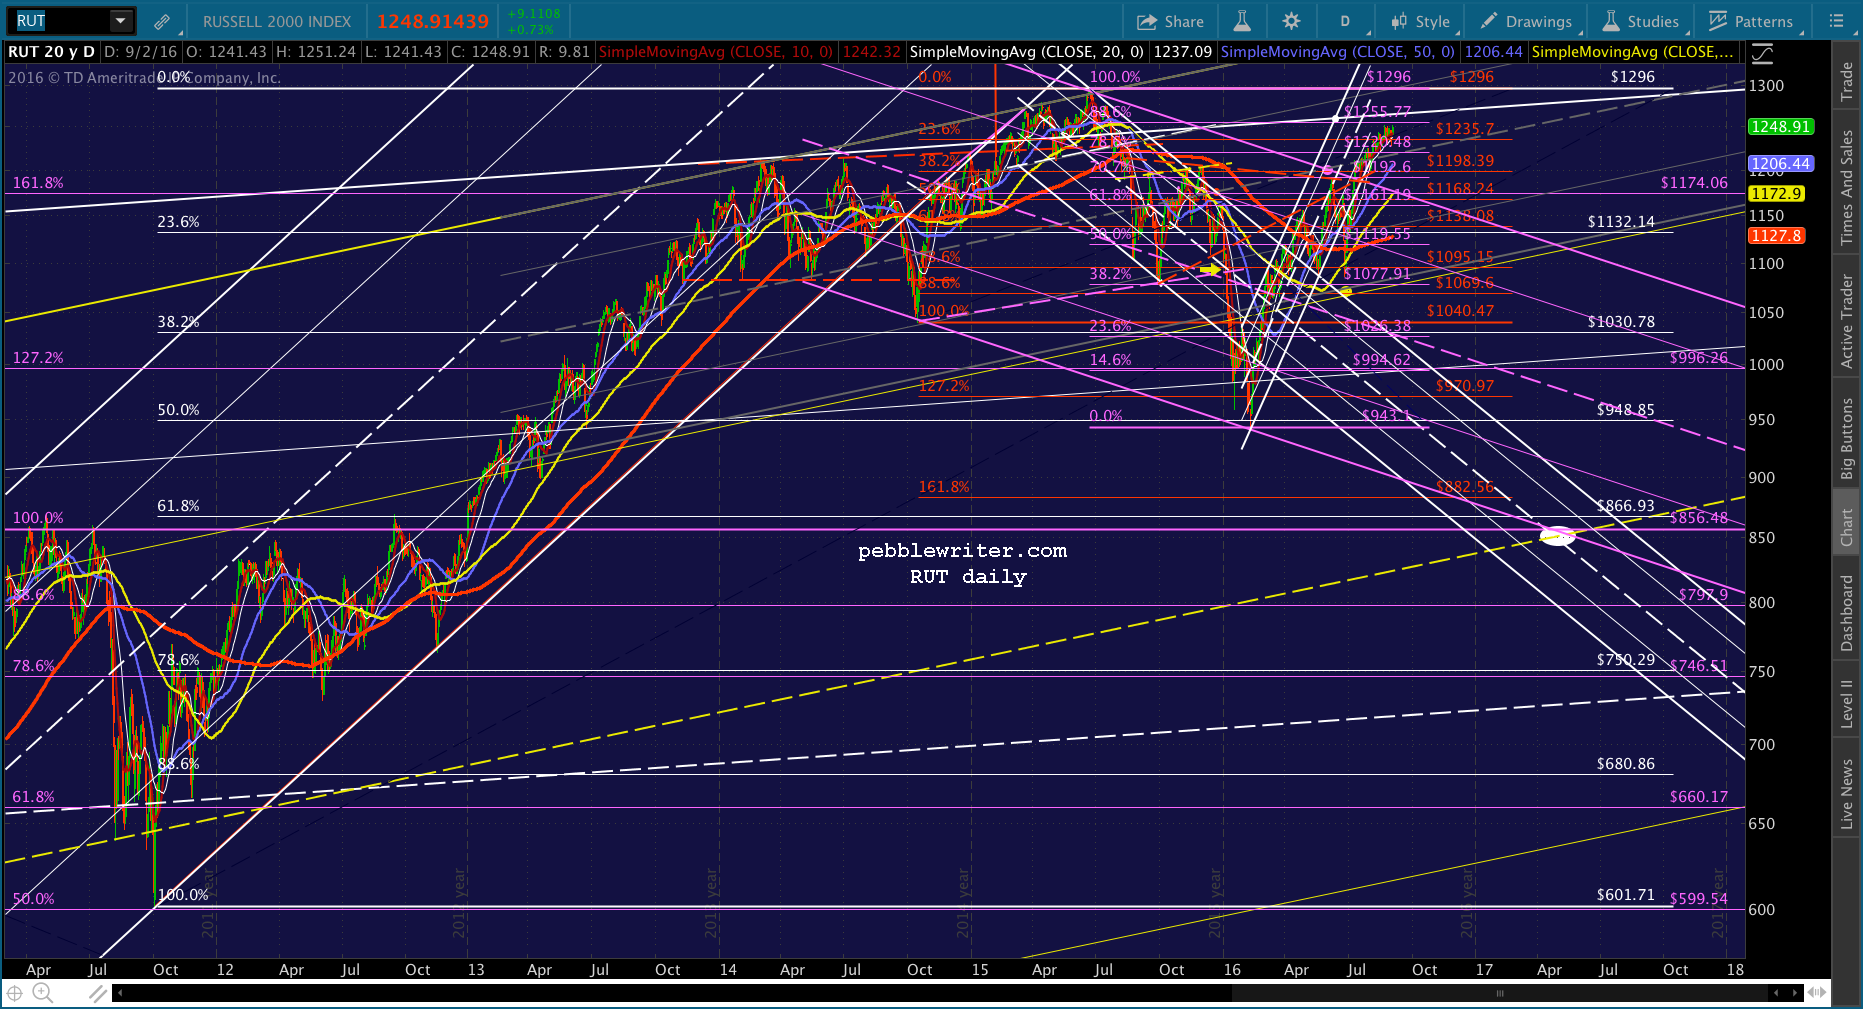
Of course, to its credit, RUT first topped the 1.618 extension (1174) of its drop from Oct 2007 to Mar 2009 way back in Jan 2014 — a full 18 months before SPX, which needed the post-Brexit ramp-o-rama to accomplish the same feat in July of this year.
RUT’s made four unsuccessful attempts to break out past the purple 1.618 in January, February, June and September 2014. Finally, it gave up, and its rising white channel from 2009 broke down. RUT tumbled 14.3% from its highs before, like every other index, it was rescued by Jim Bullard’s timely suggestion that QE4 was under consideration.
Notably, RUT’s first tag of 1174 came about the same time as SPX’s tag of its 1.272 extension at 1823 in December 2013. Both should have reversed at that point, but both broke out on a timely USDJPY ramp through resistance to new highs.
The large yellow channel fits well enough with that as a top. But, RUT dropped through the .786 line in January, meaning the midline should have been next on the agenda. Instead, the large rising white channel from 1996 came into play. It offered a .786 line for RUT to backtest — which it did in January and, again, in February.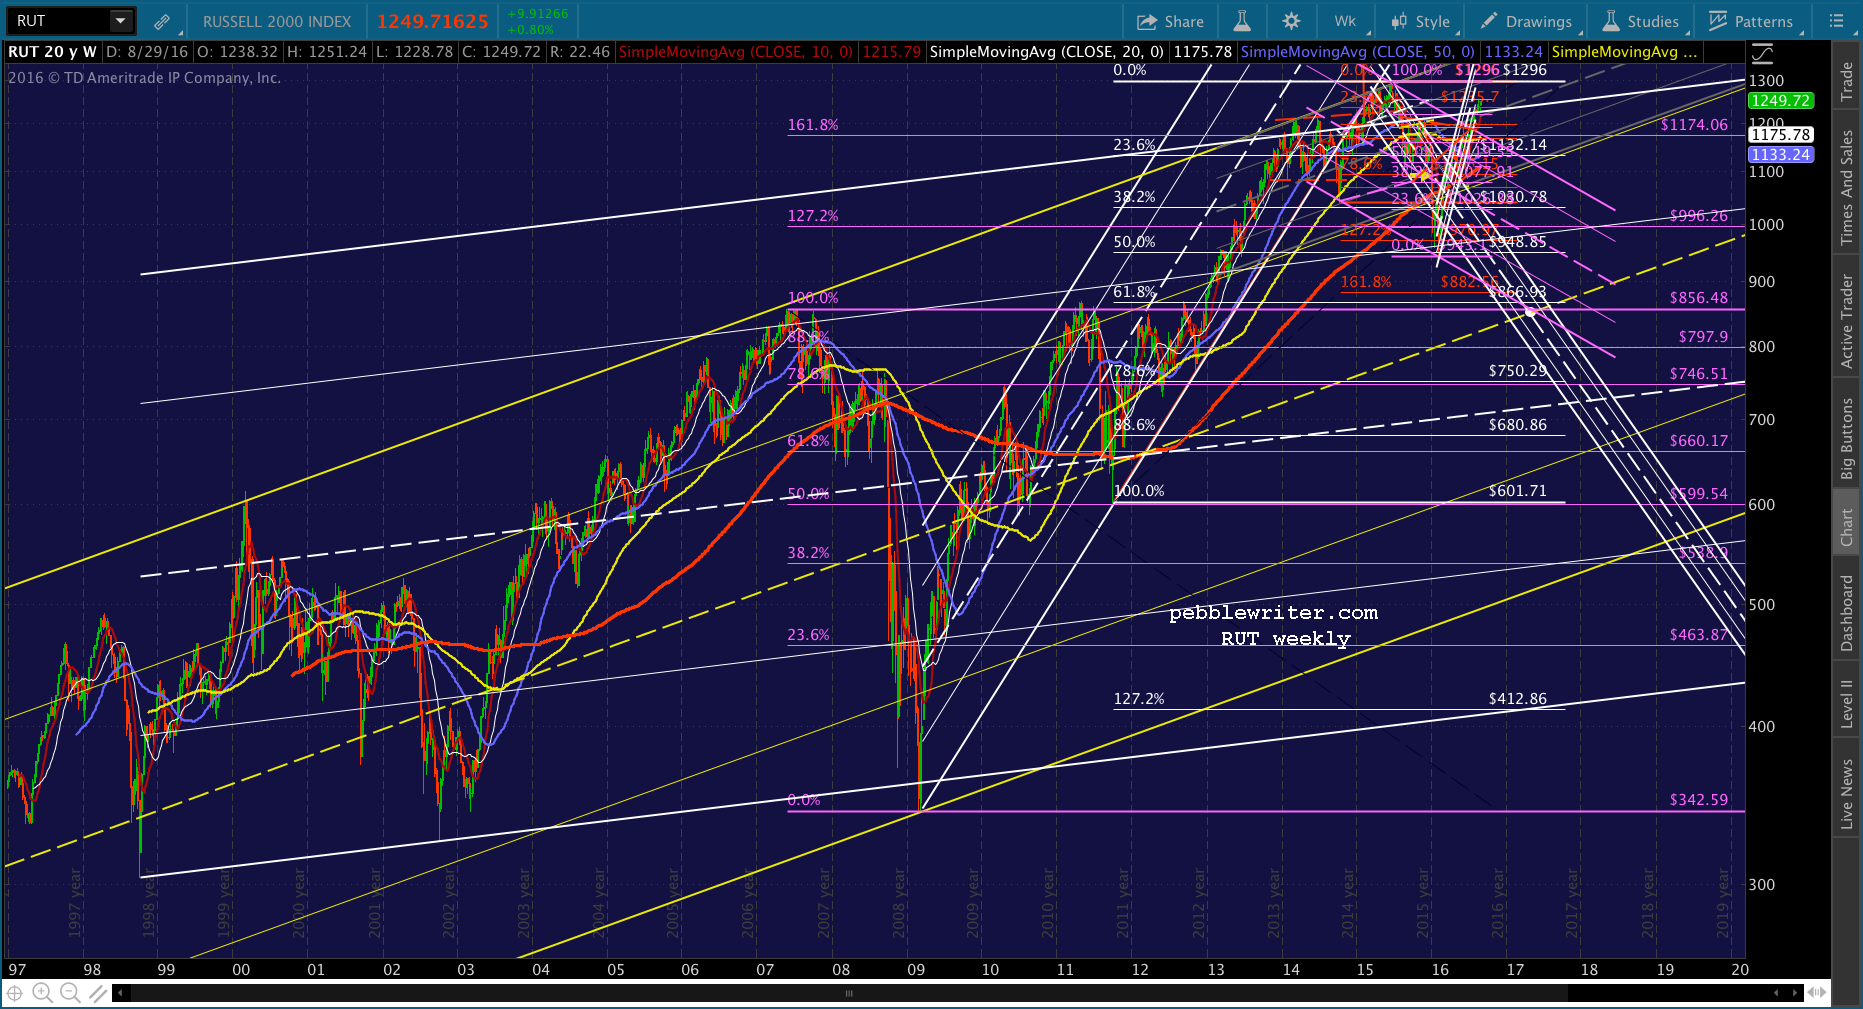
By reversing there, RUT can legitimately be said to have reversed at support — as opposed to a price that can’t be justified by the yellow channel.
The quandary with that placement, however, is that RUT just pushed slightly back above the white channel top — the same breakout it’s seen many times before, but, failed to hold. That’s why this .886 at 1255.77 is so important. If RUT reverses there, then the white .618 at 866.93 next Spring is a reasonable target.
Note that it intersects with the red 1.618 (882.56), the yellow midline, the May 31, 2007 high of 856.48 and the bottom of the falling purple channel. It’s marked with a white dot above.
In fact, the sheer number of intersecting chart patterns at 856-866 (we’ll call it 860) is probably why they’ve worked so hard to get RUT back above resistance. Were RUT to remain in the falling purple channel — which, again, is very well established — 860 would be the presumed target.
But, of course, it’s not in the falling purple channel any more. And, this is where the analysis gets difficult — maybe even a little depressing. If a market is forced higher with blatantly obvious central bank tools, does it still count?
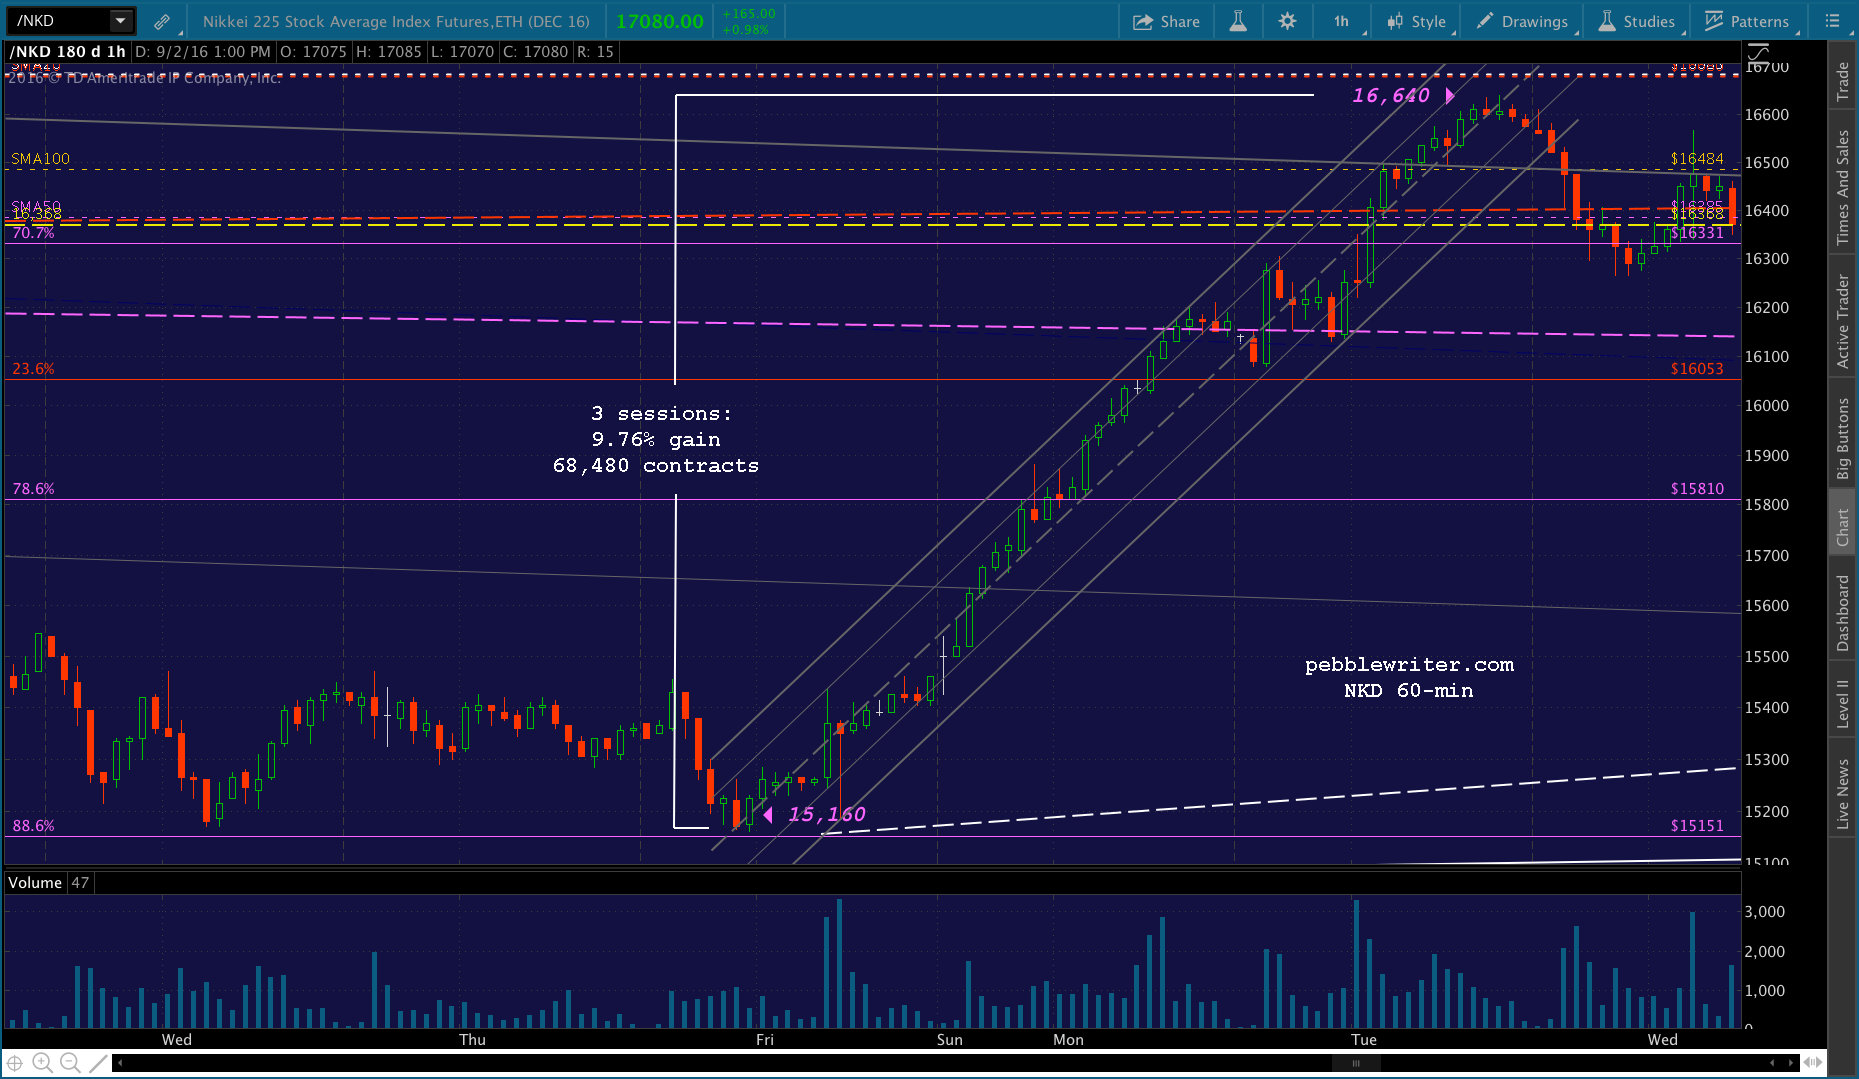
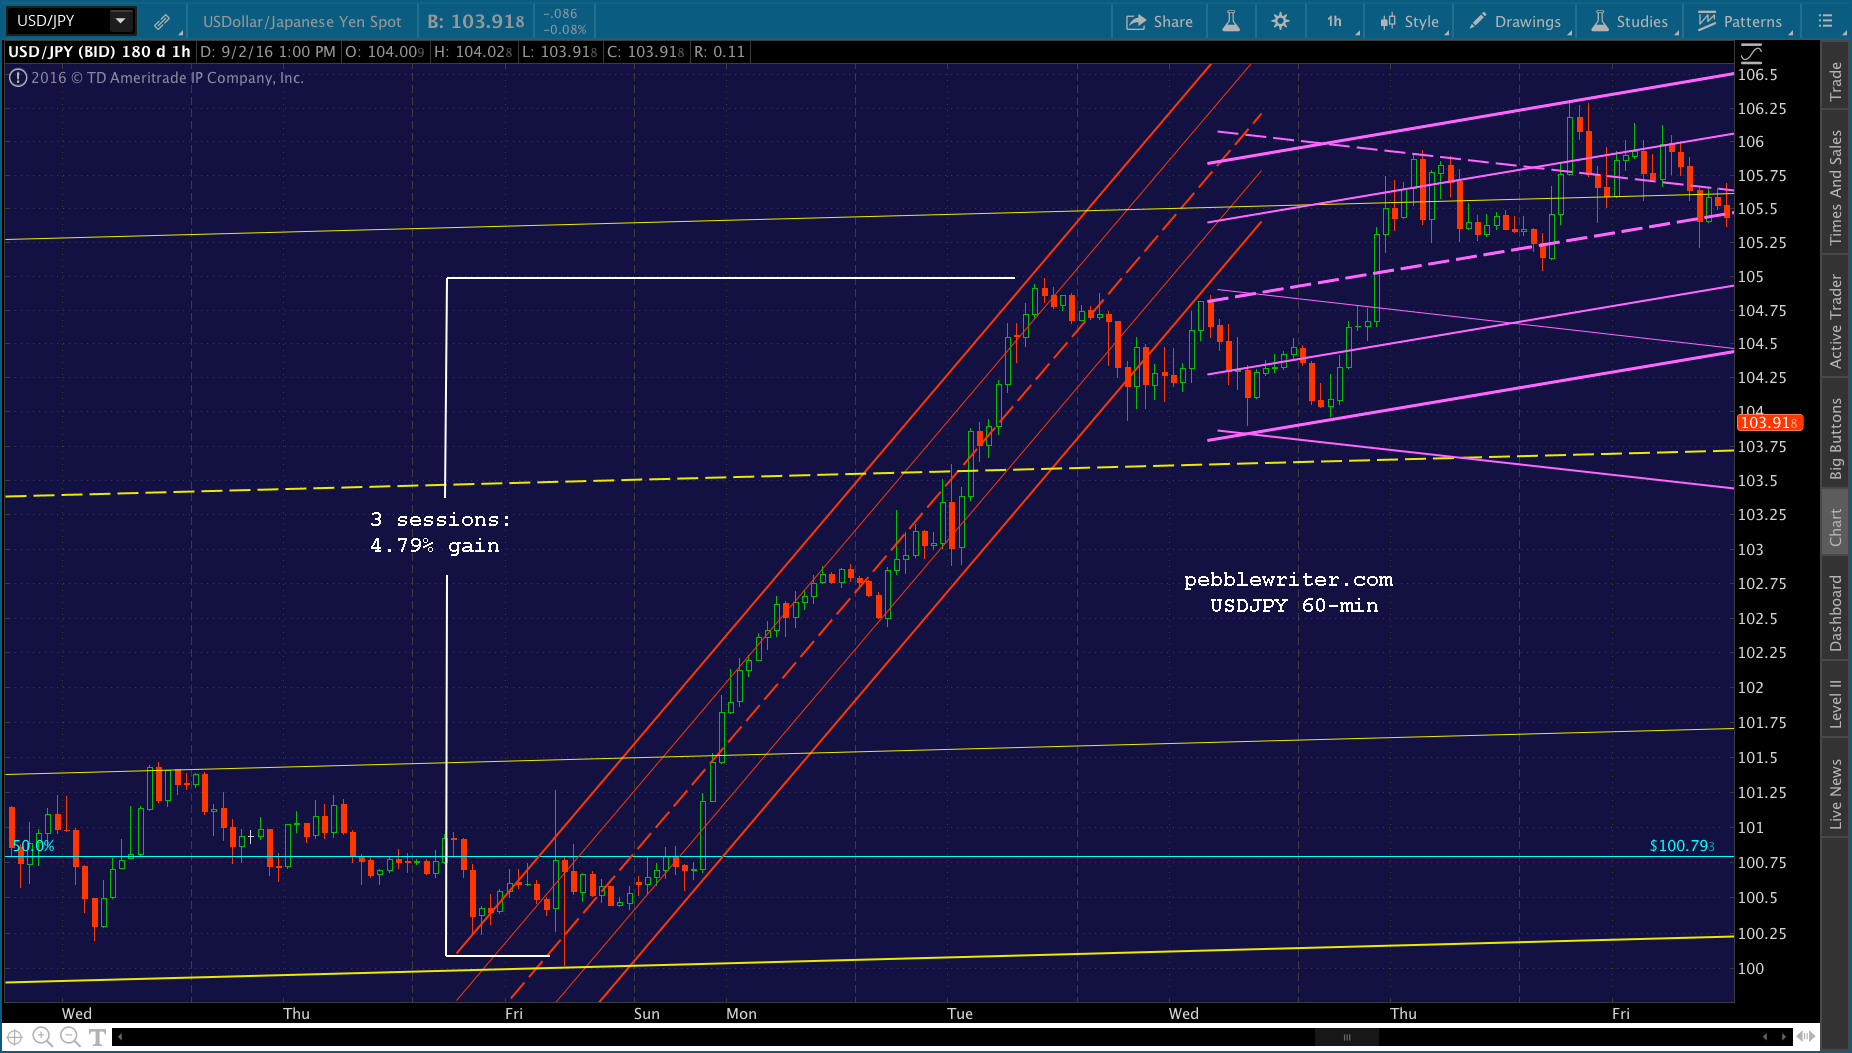
After the Brexit vote, USDJPY plunged 7.3% and the Nikkei 225 futures 11.5% in one day. To give you a sense of how monumental this was, the biggest one-day drops after Fukushima — arguably Japan’s most disastrous day since nuclear bombs were dropped on it — were 4.2% for USDJPY and 10.7% for NKD. That’s right. Brexit was worse.
But, the BoJ learned its lesson from Fukushima. To erase losses, simply engage the yen carry trade, buy up every NKD futures contract in sight, and hold on.
Is the downside case kaput? Will the breakout hold? I don’t know. But, with the .886 within a few points, we’ll find out. We should get a pullback at 1255.77 that would start by backtesting the broken purple channel. In an unrigged market, it would ultimately drop much more.
In this “market” even the backtest isn’t a given. But, if it happens, the purple channel top will likely hold. The SMA100 is about to reach the purple channel top, so it has to be considered the top possibility (1174ish) — ideally by Sep 12. Remember, 1174 is also the 1.618 of the 2007-2009 drop.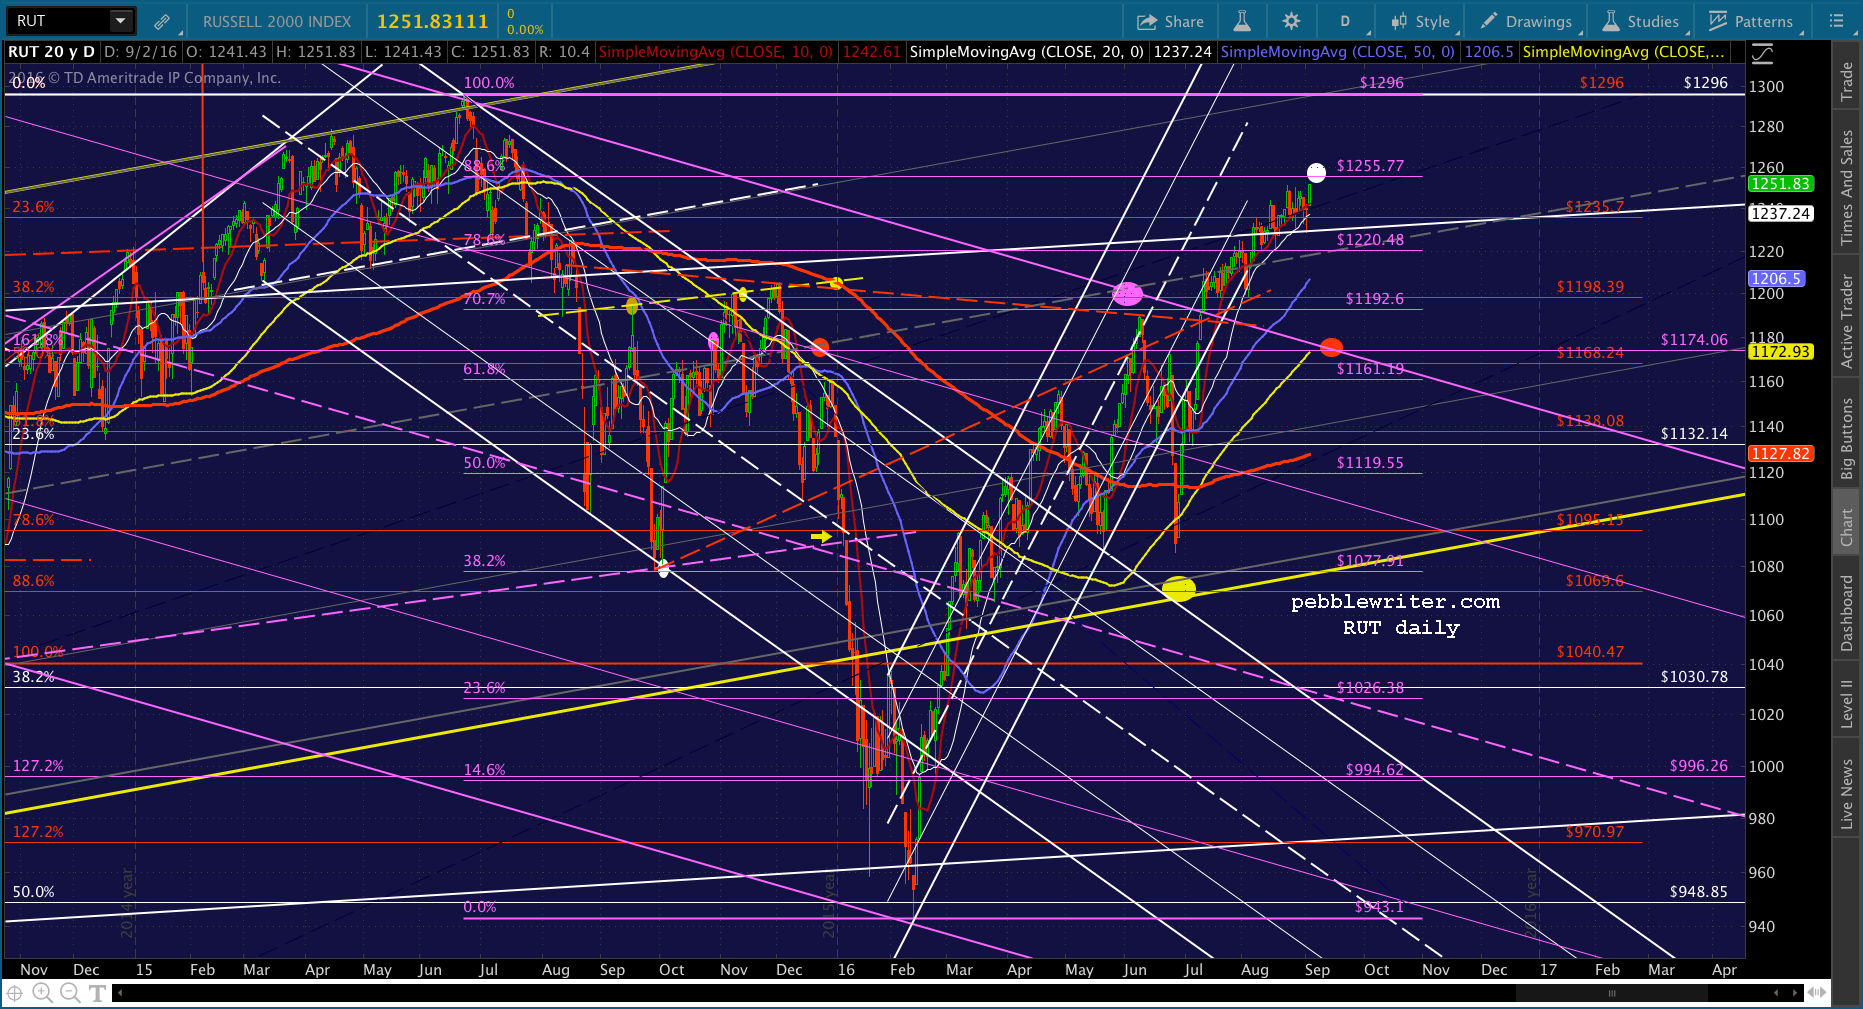
If TPTB wish to postpone any ugliness until after the election, look for the SMA200 to factor into the equation. It’s currently at 1128, and will likely reach the purple channel top around the .618 at 1161 around the end of the year.
Stay tuned.