

I love analogs. I love the way they lay out a clear, tradeable path, slicing through all the noise and the head fakes. Our first was a doozy, correctly forecasting the 21% Jul-Oct 2011 correction with deadly accuracy [see HERE.] Our most recent one, posted in Mar 2015, forecast the 12.5% correction that would occur almost five months later [see HERE.]
 Although I dislike day trading, it’s become a necessary evil. Gone are the days when a weak close practically guaranteed a weak opening the following morning. It’s just as likely, if not more so, to result in a gap higher. Strong closes are almost as treacherous.
So, it’s always fun when a new one appears on the horizon and we get a chance to take some longer-term positions.
continued for members...
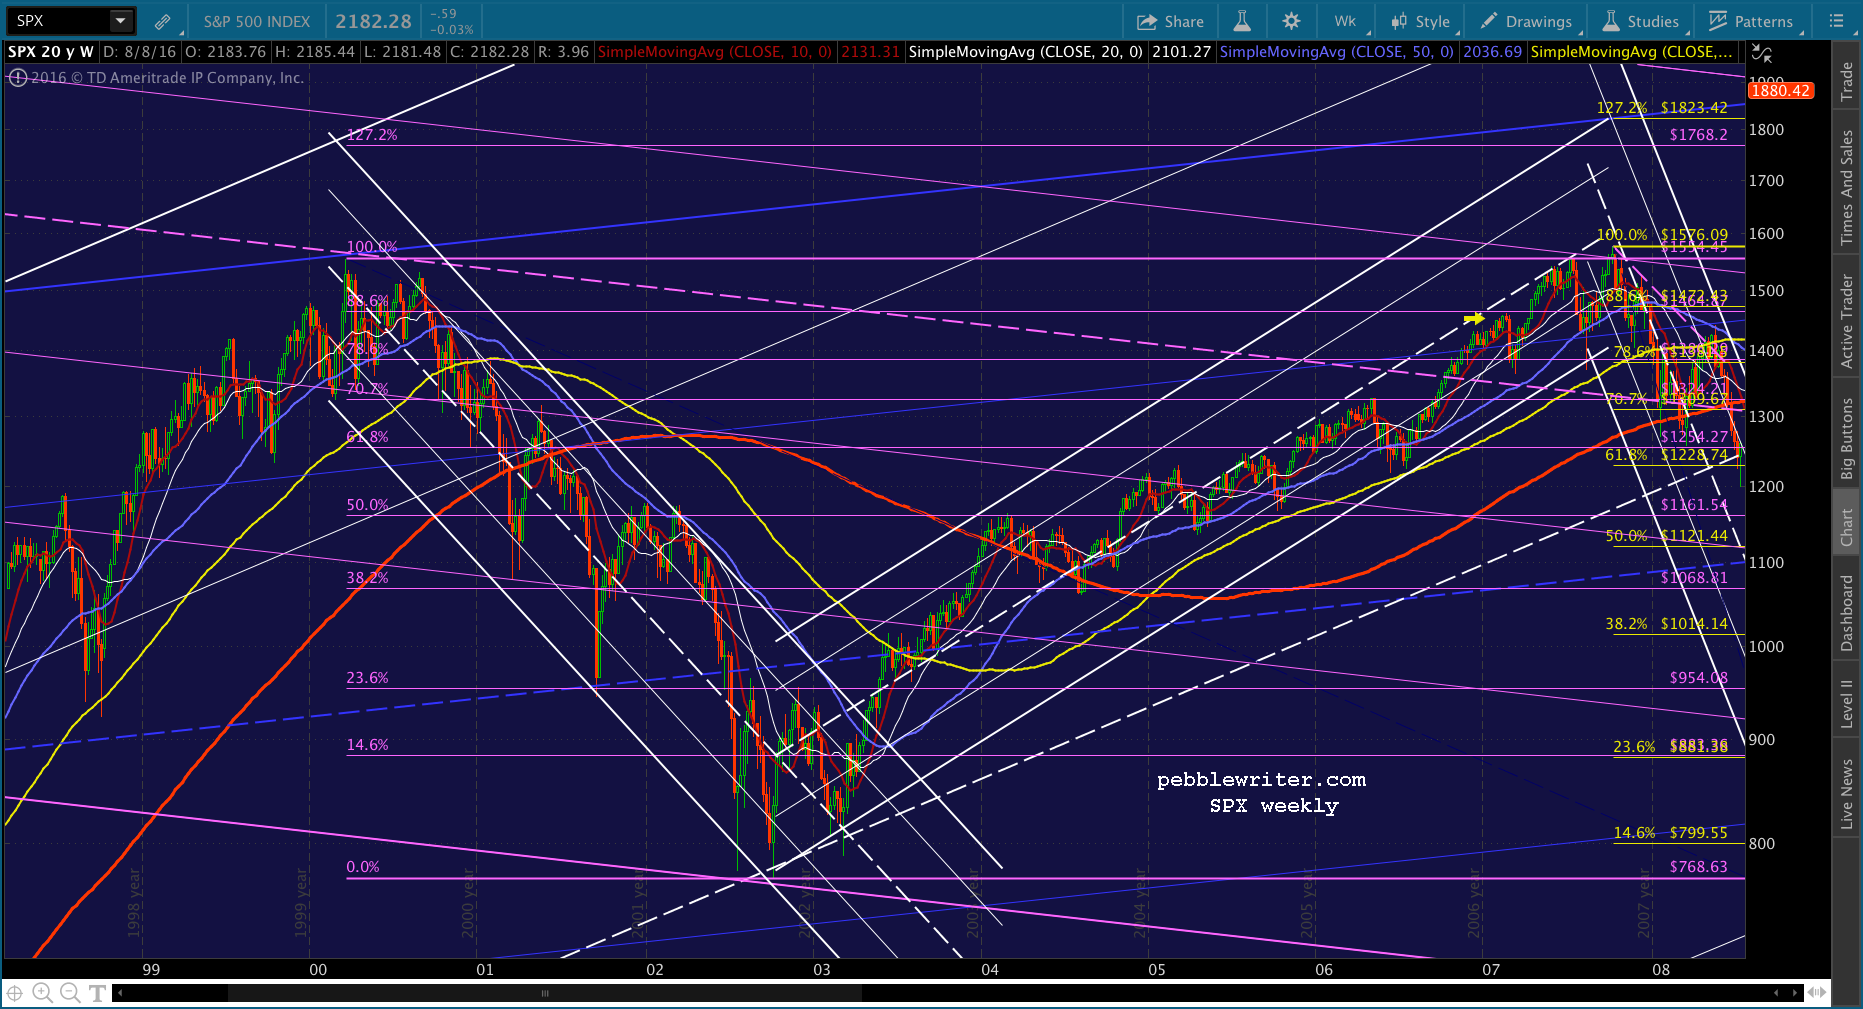
First, let’s take a look at the REALLY big picture for the last 20 years.  Notice how SPX:
- completed a backtest of the huge white channel midline in late 2014
- reached the top of the rising red channel (within the white channel) in late 2014
- reached the top of the rising purple channel in Feb 2015
- despite reaching those channel lines, SPX continued rising to the yellow 1.618 (2138, actually reached 2134) in May 2015.
After reaching 2134 and tagging the top of the rising purple channel again, SPX had all kinds of problems. But, the downside was contained to the 1.272 extension at 1823.
In fact, 1823 has been backtested seven different times — including the time they failed to contain it on Jan 24, 2014 (it fell 85 points in 9 sessions, popped back up in 4.)
The following times — Apr 11, 2014, Oct 15, 2014, Jan 20, 2016 and Feb 11, 2016 — they held it to within 13 points. Two things should be quite obvious from this. First, having not cared one bit about 1823 as resistance on the way up, they wanted to make damn sure it served as solid support in any declines. And, by the way, SPX should have reversed strongly at 1823 in the first place. It completed a huge Butterfly Pattern set up by the plunge from 1576 to 666 between 2007 and 2009.
Second, it’s the clearest indication of market manipulation in years. You simply don’t get severe intraday reversal of the sort that occurred on those days without some heavy interference (Bullard hinting at QE4, USDJPY spiking, oil futures doubling in price, etc.)
 But, none of that will come as a surprise to regular readers. We’ve documented market manipulation on a regular basis for the past five years. The reason I mention it is because it has a direct bearing on what to expect from the “market” going forward.
By now, many of you will have read the new post The Not So Invisible Hands Guiding the Market. I took the time to post it because I believe there are still many investors, including some subscribers, who aren’t fully aware of how “captured” the current market has become.
By that, I mean that there are very few days when the “market” does anything that wasn’t planned out, in detail, in advance. The past few weeks have been a great example: the almost instantaneous recovery from the Brexit, topping the 2134 highs and blowing through the 2138 Fib level, and the vigorous prevention of any significant downside ever since.
 We have other examples of similar patterns that occurred in the past after SPX had topped important resistance. The first that I’m drawn to was in Feb 2007.
The biggest pause of the rise from 2002’s lows was at the .500 Fib, meaning that a Bat Pattern at the .886 was a likely outcome. There was practically no reversal at the .786, which bolstered the case for a reversal at the .886 (the yellow arrow.)
 SPX same within 3 points of the .886, then dropped nearly 100 points over the next 14 sessions — including one nasty 60-pt drop 4 days in. At that point, with SPX having dropped through all the SMAs but the SMA200, it rebounded — popping back up to the .886 in about a month.
On Apr 16, it popped through the .886, backtested it two days later, and didn’t touch it again until Jul 26 in the midst of a 185-pt mini-meltdown that started at the 1.000 Fib (the 2000 highs) and came within 7 points of the earlier lows.
The surprising thing about this sequence of events is that it was driven largely by the same sort of factors we’re dealing with today. SPX started faltering as it approached its .786 at 1386. 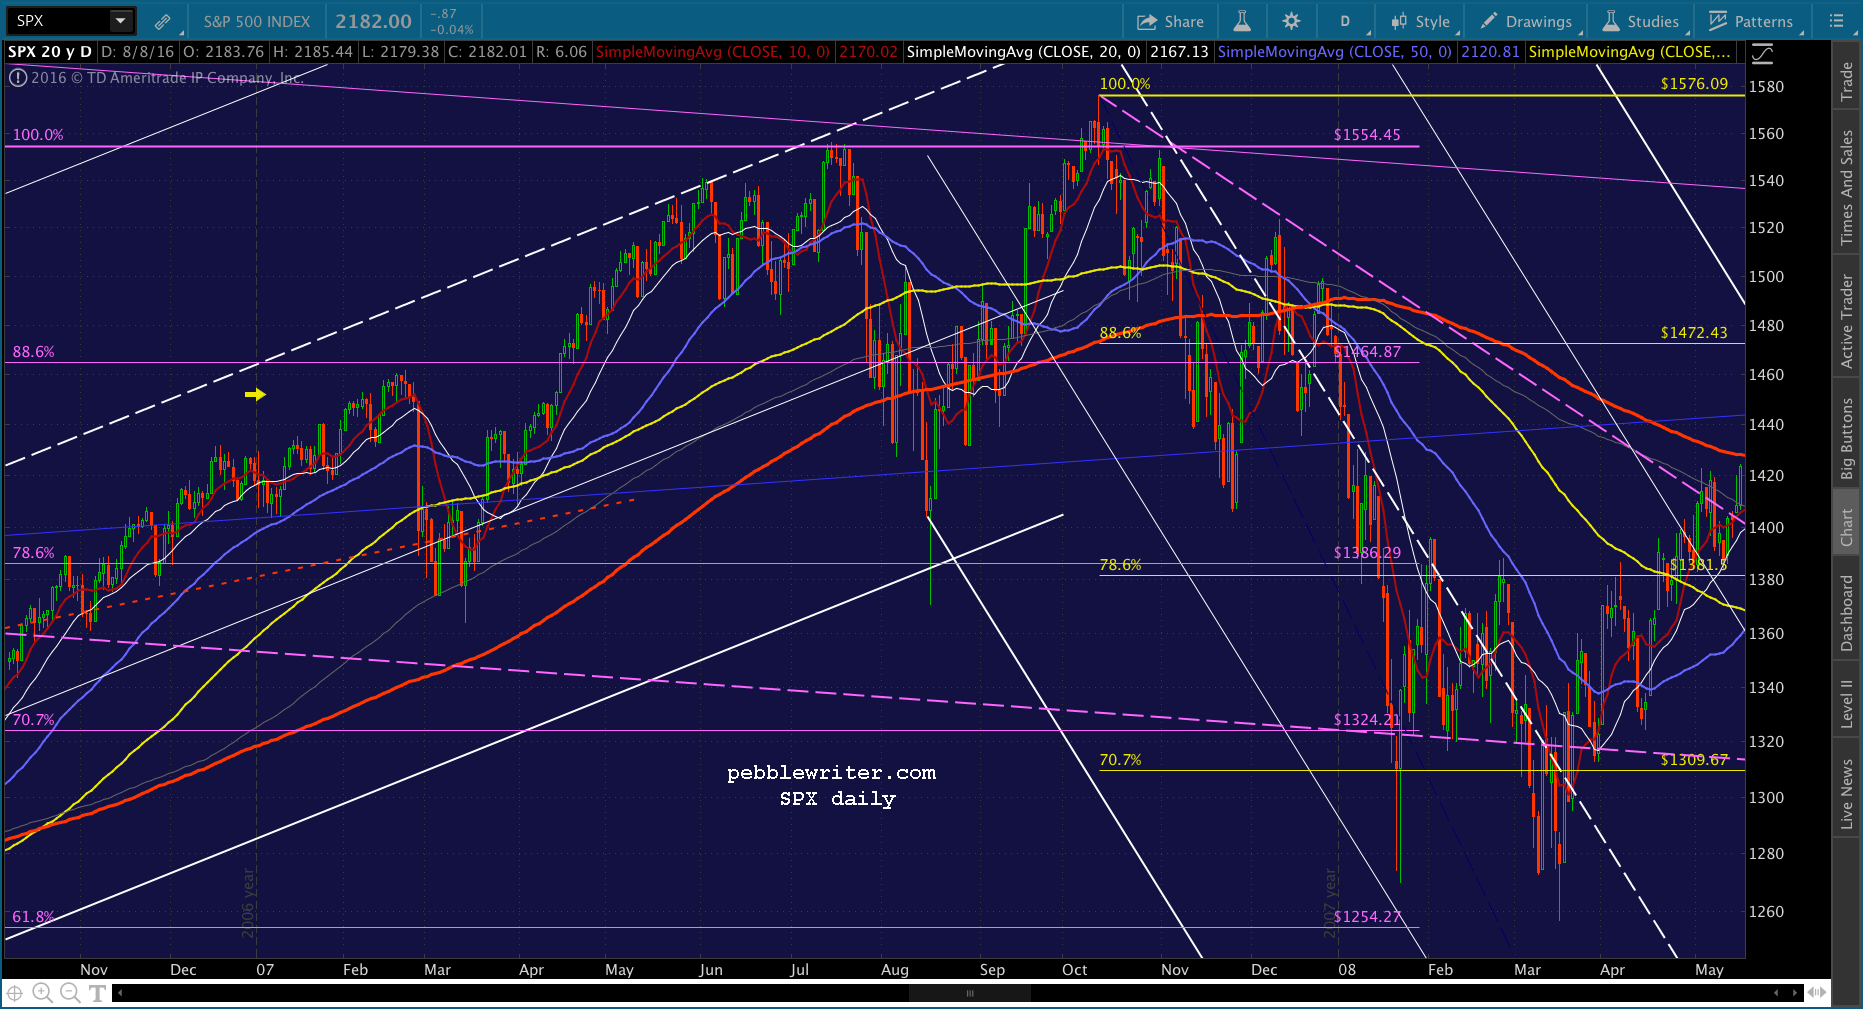 Note that USDJPY was bumping into a trend line (purple) from its 1998 highs at the same time. I’ve marked it with the purple arrow. SPX spent about 10 weeks in heavy chop until USDJPY broke out of the purple TL (the yellow arrow.)
 The breakout was enough to get SPX on up to the .886. But, when USDJPY dropped back through the purple TL, SPX fall sharply back to and even below the .786.
 Apparently, this wasn’t acceptable to TPTB at the time. USDJPY broke out through the TL once more time (the red arrow), which broke SPX out yet again — this time, past the .886 and just past the 2000 highs.
One other thing: not only did USDJPY break out of the TL again, it busted a potential H&S Pattern that should have put in a right shoulder where the original TL breakout failed. Between the busted H&S and the on-again breakout, it was enough to push SPX past the .886 to a new high, even if it was just one point higher. Here, I suppose TPTB felt they could let USDJPY back off again. It fell back below the purple TL one more time (after having peaked at 124.13 on Jun 22, 2007, it didn’t stop falling until it bottomed out at 75.56 on Oct 31, 2011.)
But, SPX made one more new high, even after USDJPY had already topped out. If you look closely at the chart above, you can see that USDJPY backtested the neckline of the busted H&S neckline on Aug 23, 2007. It continued to backtest the neckline all the way until Oct 4, at which point it rose back above the neckline. On Oct 5, it pushed back above the purple TL, too.
The other big influence during that period was the Fed. With SPX having fallen 11.9% since barely making new highs, they were getting nervous. On Sep 18, after several weeks of rumors, they lowered the discount rate and the target rate on fed funds by 0.5%. The CNN article regarding the rate cut makes for very interesting reading. An excerpt:
Some investors had thought that Fed chair Ben Bernanke would take a more cautious approach and not cut rates by such a large margin, because a half-point cut could signal the Fed was acting out of desperation to save the economy.
But Alan Skrainka, chief market strategist with Edward Jones in St. Louis, disagreed with that interpretation. He said Wall Street was cheering the rate cut because it proves the Fed is willing to take any moves necessary to ensure the economy is not derailed by problems in the subprime mortgage market, loans made to consumers with less-than-perfect credit.
“We’re having champagne and cookies,” Skrainka said. “This is not a magical elixir that solves our subprime problems overnight, but it is a big step in the right direction to keep the economy growing. The Fed is sending a strong message that it won’t get behind the curve,” he added.
I include the above in this post because I think it’s important to recognize that the Fed was already woefully behind the curve. Yes, the action sent SPX spiking up nearly 3% in one day. And, the subsequent machinations with USDJPY sent it past a .886 retracement of the 1555-1370 drop to even higher highs. But, ultimately, the mortgage meltdown was too big for rate cuts and currency tricks to stem a crash.
Now, before you bears get all excited, consider that SPX first reached the .886, where it should have reversed, on Feb 22, 2007. It didn’t make its actual high until 8 months later, on Oct 7. And, it didn’t plunge back below the .886 to stay until Jan 2, 2008 — almost a year after the original near-tag.
All in all, there were 41 instances of SPX either crossing the .886 or coming within 5 points of it during that time. On May 19, 2008, it almost backtested it again, coming within 25 points of it after having shed 320 points from the top. Again, this is almost 16 months after the initial near-tag.
It is extremely significant that SPX pushed up through its 1.618 Fib level. The fact that it was a cheat — remember the amazing, imminent BoJ QQE expansion that sent USDJPY 7.5% higher but, then, never happened in July? — matters not.
What matters is that TPTB have become quite expert at pushing stocks higher. And, they have breached a level that must be defended — whether via CL, USDJPY, VIX, ZN, EURUSD or whatever.
The way I see it, CL could continue backtesting the broken purple channel for another month — through Sep 9 or so. This could take it up to 46 or higher without breaking a sweat.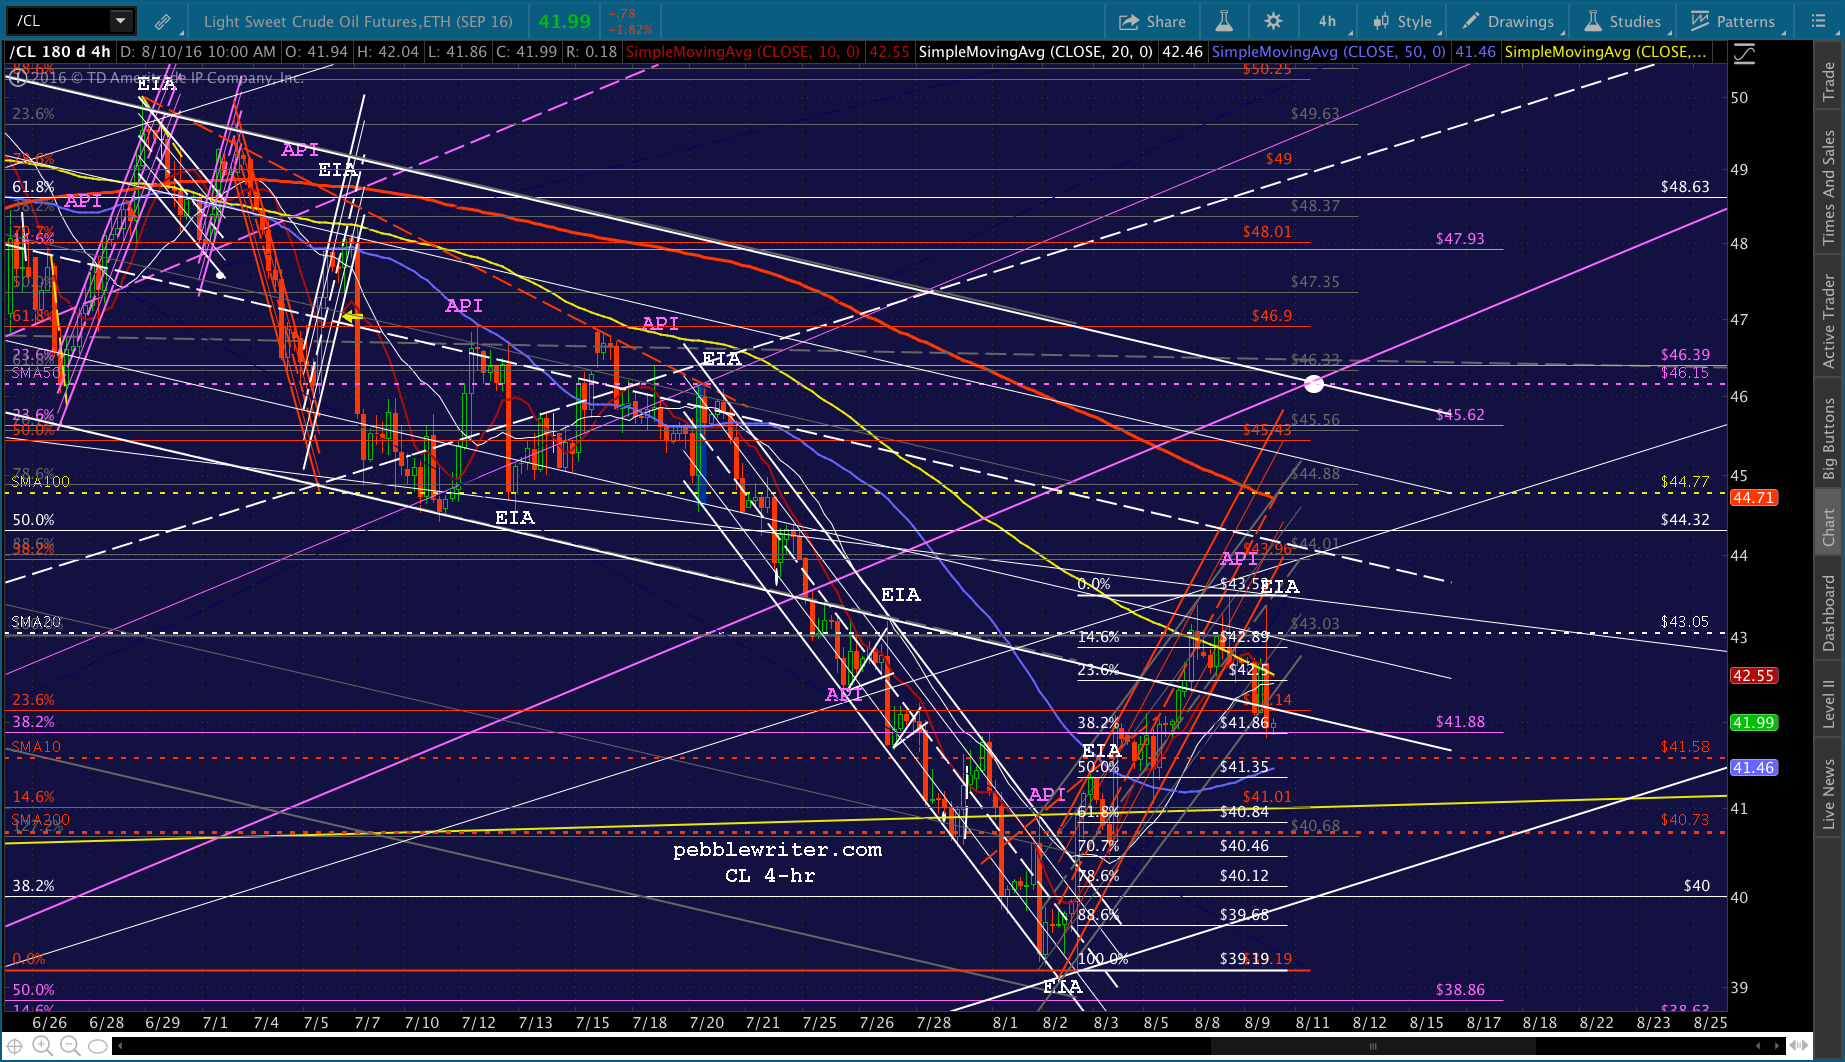 USDJPY recently tested the .500 Fib of the rise from 75.56 to 126.06. It’s been ugly, but it has put in four higher lows since the Jun 24 plunge. The initial rising white channel they were trying to sell us on obviously has problems.
 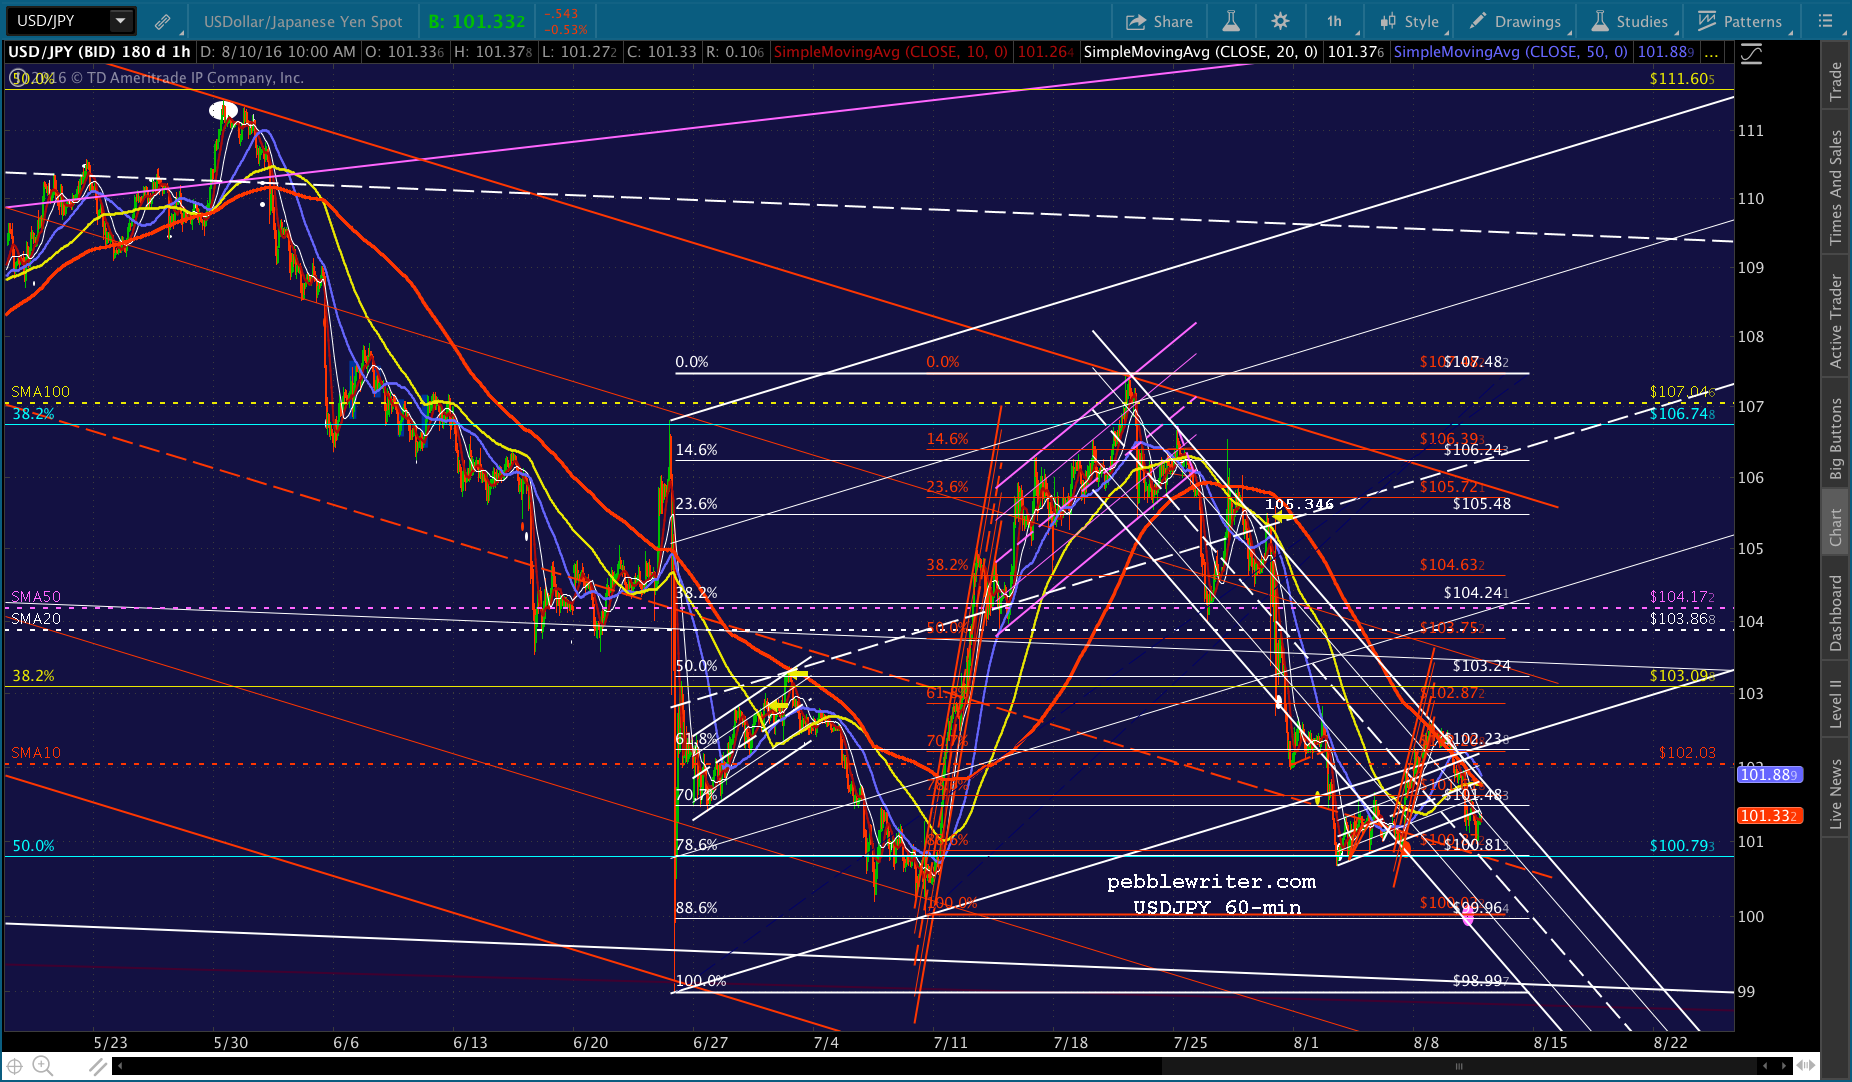 I’ve come to believe they’re going to try the yellow one below on for size. If so, we could be looking at a large rebound in USDJPY (further depreciation of the yen) in combination with the significant decline in oil prices that many fundamental analysts have been expecting (and which would be entirely in keeping with the supply/demand picture.)
For those of you who have waited patiently for the rest of the analog post…I’ve been taking my time in order to process a few things. Here’s why. The analog essentially calls for new highs following an eventual backtest of 2134-2138. That’s the punchline. The timing of the backtest was and remains the issue. The extent of the new highs was the other issue.
But, I’ve had my confidence shaken by what’s happening in the market these past few days. Today, Aug 11, I’ve watched CL spike 6.7% since the overnight lows on a report from the IEA — which is perennially wrong — that higher oil prices were just around the corner. Even with CL up 6.7%, SPX is up only 0.49% and is having a hell of a time making new highs — which, of course, is the goal.
Bottom line, investors/traders are calling bullshit on the ramp. Maybe they’ve come to believe that it’s quite unlikely to stick, and that the rally it produces in stocks is not only unjustified, but is also unlikely to stick.
I’ve been there before. At the end of 2013, I cited numerous reasons why the 1.272 Fib at 1823 would cause a large reversal. There was the completion of the Butterfly Pattern itself. of course, There were several compelling channel tops. There were compelling complementary charts for USDJPY, TNX, etc. that all screamed “reversal!”
I understood that TPTB would want to finish 2013 on a positive note. Even 10 weeks later, I was still waiting for the big whoosh. I’ve revisited the charts on Mar 20 2014 in Eye Candy for Bears numerous times over the years, and can’t find any fault with the logic. I still consider the patterns I discovered back then among my best work ever. (If you joined after that, I believe you’ll find the look back worthwhile.)
A week later, I posed the question: “Are Bears Doomed?” Overnight ramp jobs had become so commonplace that every bearish setup that came along was easily undone. I even laid out how economical it was for central banks to do so. This was back before the BOJ had been proven to actively prop up stocks on a regular basis.
At the time, such accusations were roundly met with derision. Perhaps if I’d better understood what the BoJ was doing with the yen carry trade, I might have: (1) been able to make a more compelling argument, and (2) been better able to appreciate how doomed bears really were.
As it turned out, 2014 was almost devoid of any serious downturns for many months. SPX finally tumbled about 200 points (10%) between Sep 19 and Oct 15, when it completed one of the many backtests of the 1.272 extension at 1823 mentioned above.
 Where do these trips back to 2007 and 2014 leave us? If we get a repeat of 2007, the outcome could look something like the chart below.
We’d soon get a breakout from the rising purple channel that peaks around Aug 29, falls about 3.5% into early Sep, pushes up to new highs again by mid-Sep, then dips a little further by Sep 23, then pushes up to 2270 by Oct 11.
 At that point, we’d finally get the backtest of 2138 — a full 73 days since the initial push up through it on Jul 12.
Make no mistake, spending the next three months bobbing back and forth 3-5% with average daily moves of 1-2 points would be painful. We’d find some patterns to play with, and hopefully avoid some of the worst days while trying to stay long.
On the other hand, we could get something more like 2014-2016 — when SPX pounded repeatedly on 1823 for over 2 1/2 years. I’ll chart that one later — perhaps tonight.
The reality is that it won’t matter quite so much to swing traders, who can go long right here and now and wait for signs of the rally falling apart (e.g. a drop through the SMA10 or SMA20, etc.) More active traders, who can theoretically make much more by playing the intraday swings, will have to work for those extra dollars.
Is 2138 safe? Probably. While any number of factors could unravel, TPTB have demonstrated their ability to drive stocks higher — primarily through ramping CL and USDJPY and clubbing VIX, either in turn or all at once.
Many formerly blissfully ignorant traders and money managers are up in arms at the ludicrousness of it all. But, I can attest to the futility of their complaints.
Updated on Aug 19: The Big Picture
These changes were made on Aug 19, and essentially call for the price swings to be contained within the rising purple channel until a breakout in October. For a full discussion of the changes and the rationale, please see the Aug 19 post.

* * * * *
Note: the following are the intraday updates posted on Aug 3 — originally inserted between the intro and the analog post.
First, our short-term targets remain unchanged. Here’s a wrap up of the latest on all of our major charts.
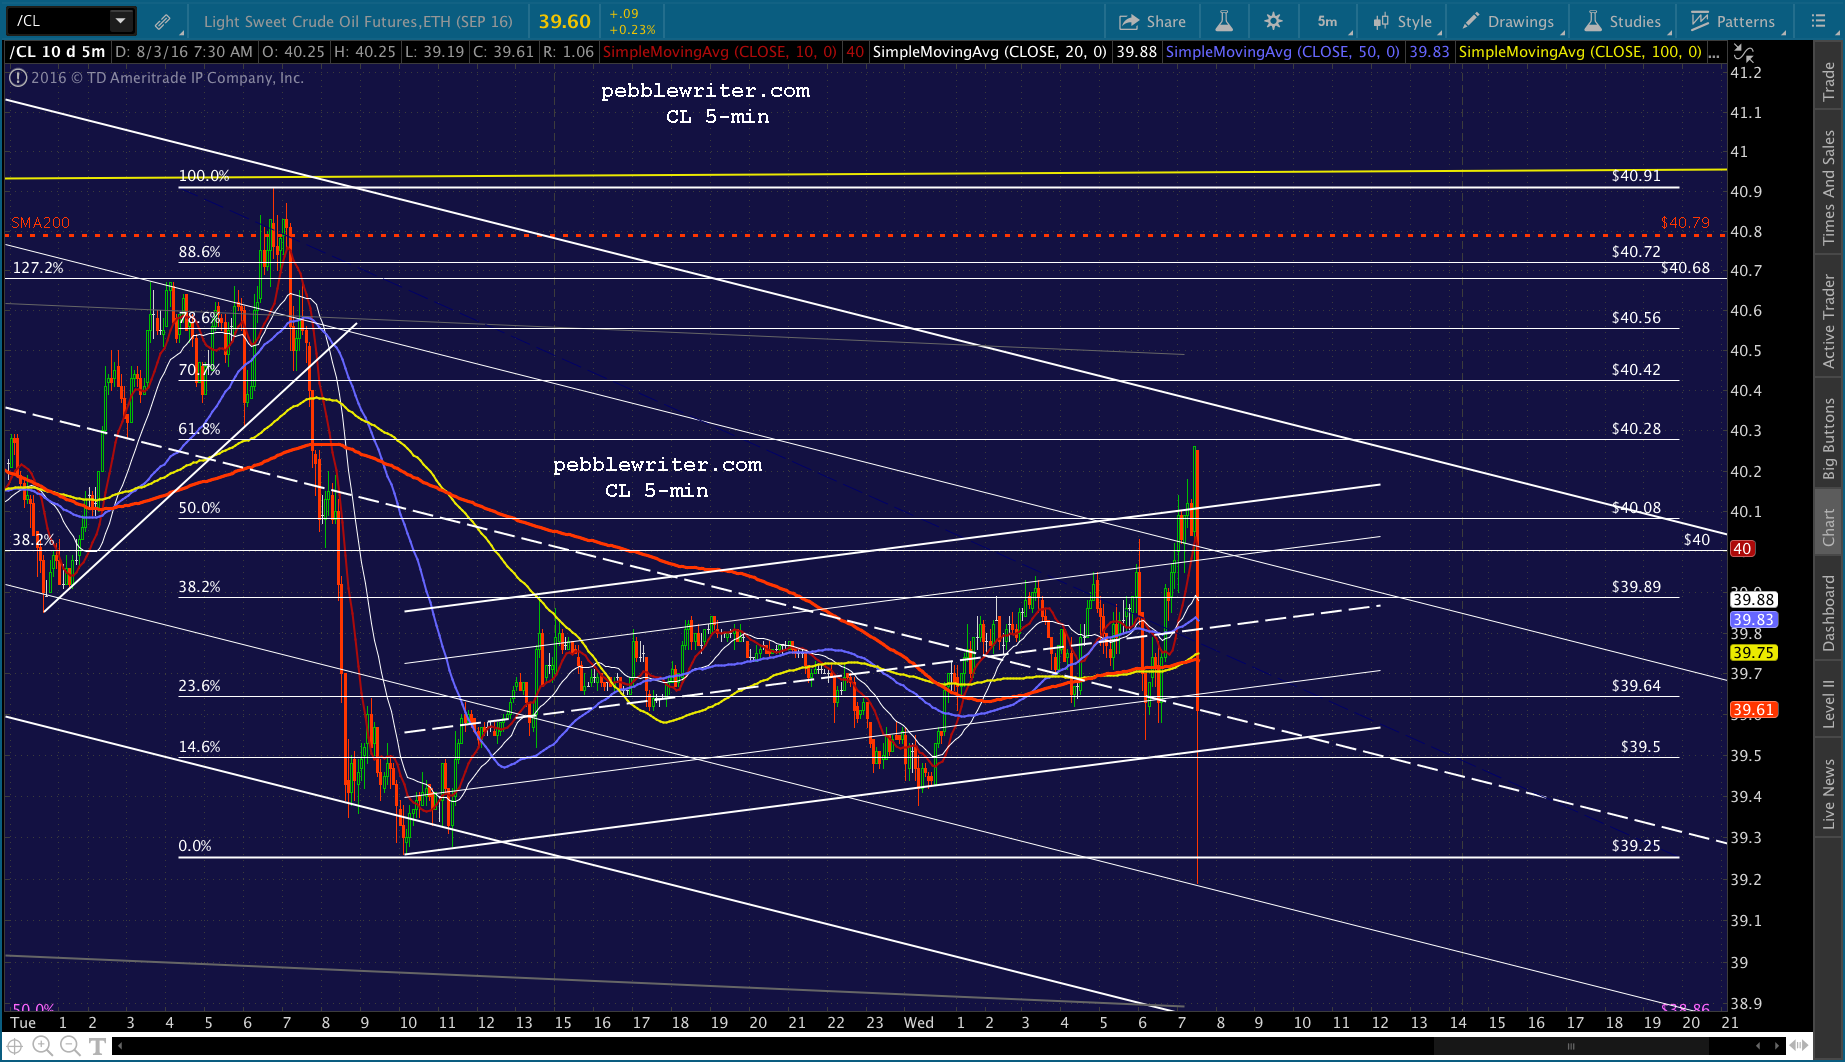
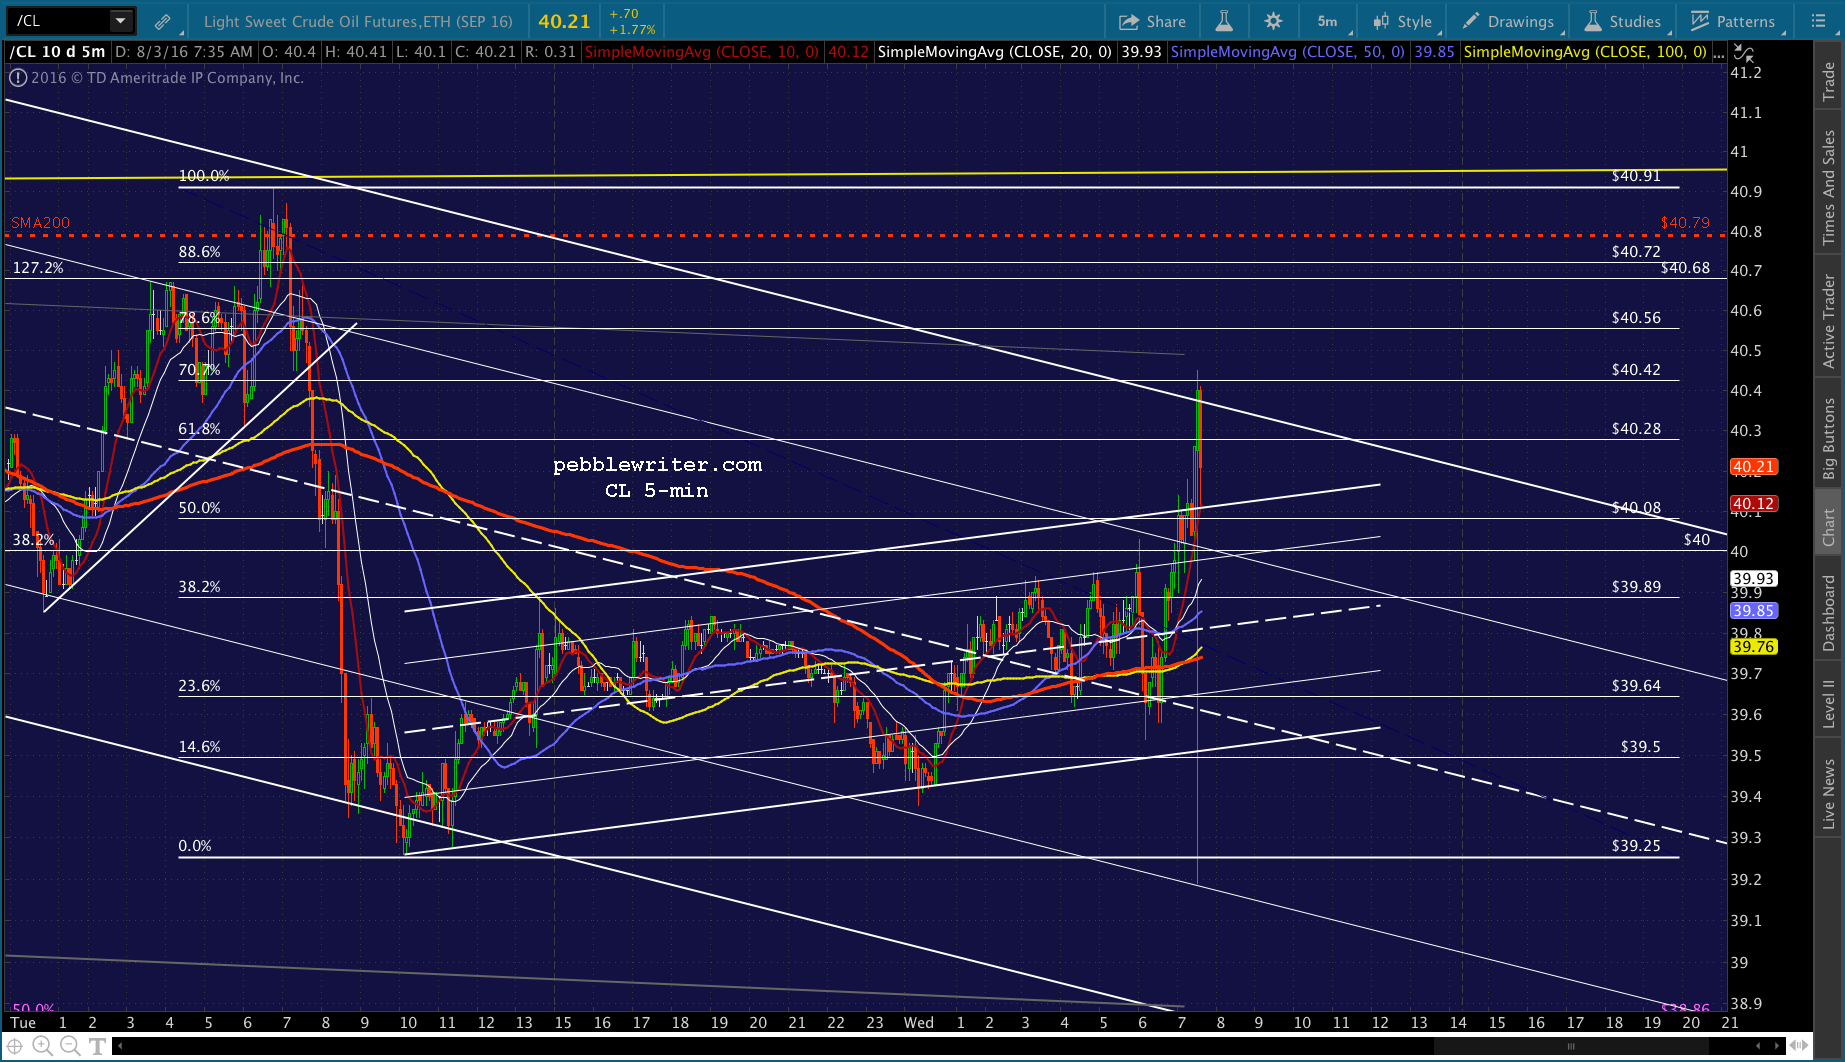
 CL has broken down below a lot of support.
  Coming up — a potentially important Fib level at 38.86. It’s the .500 retracement of the rise from 26.05 to 51.67 that took SPX from 1810 to 2120. In my opinion, CL doesn’t break down unless TPTB want it to break down.
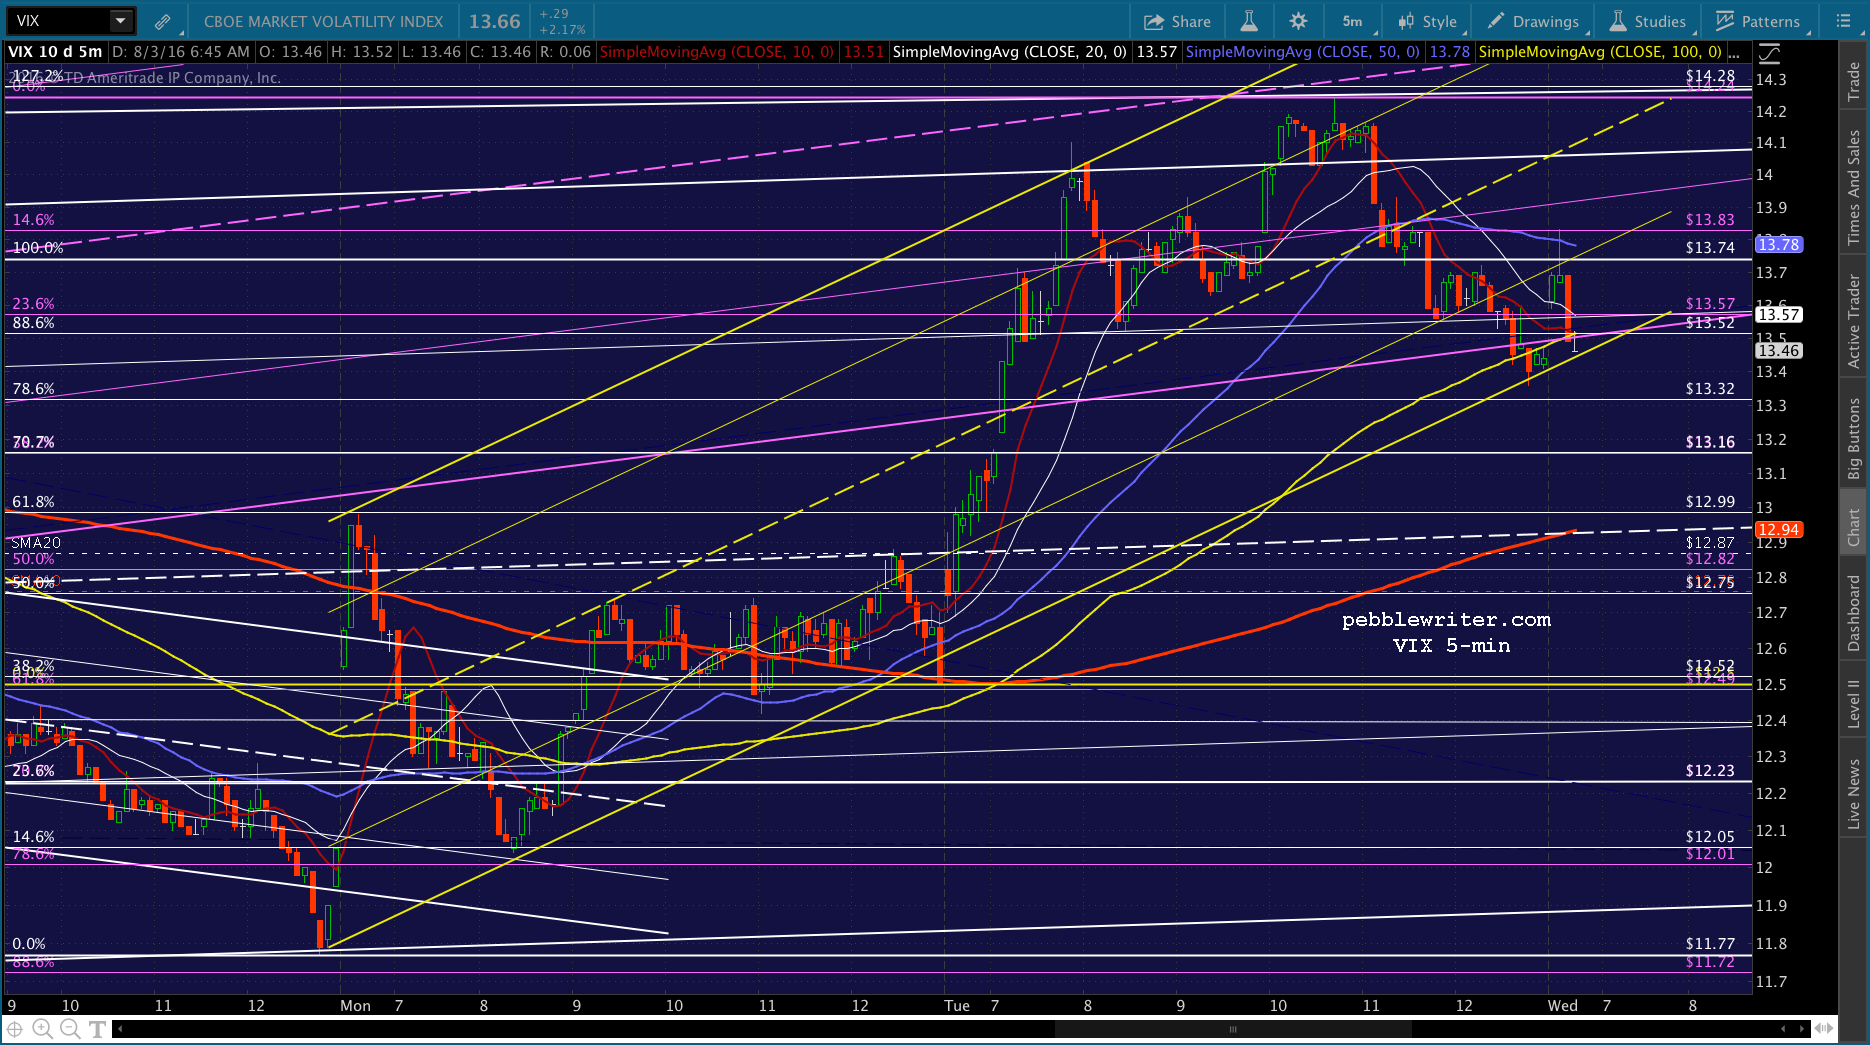
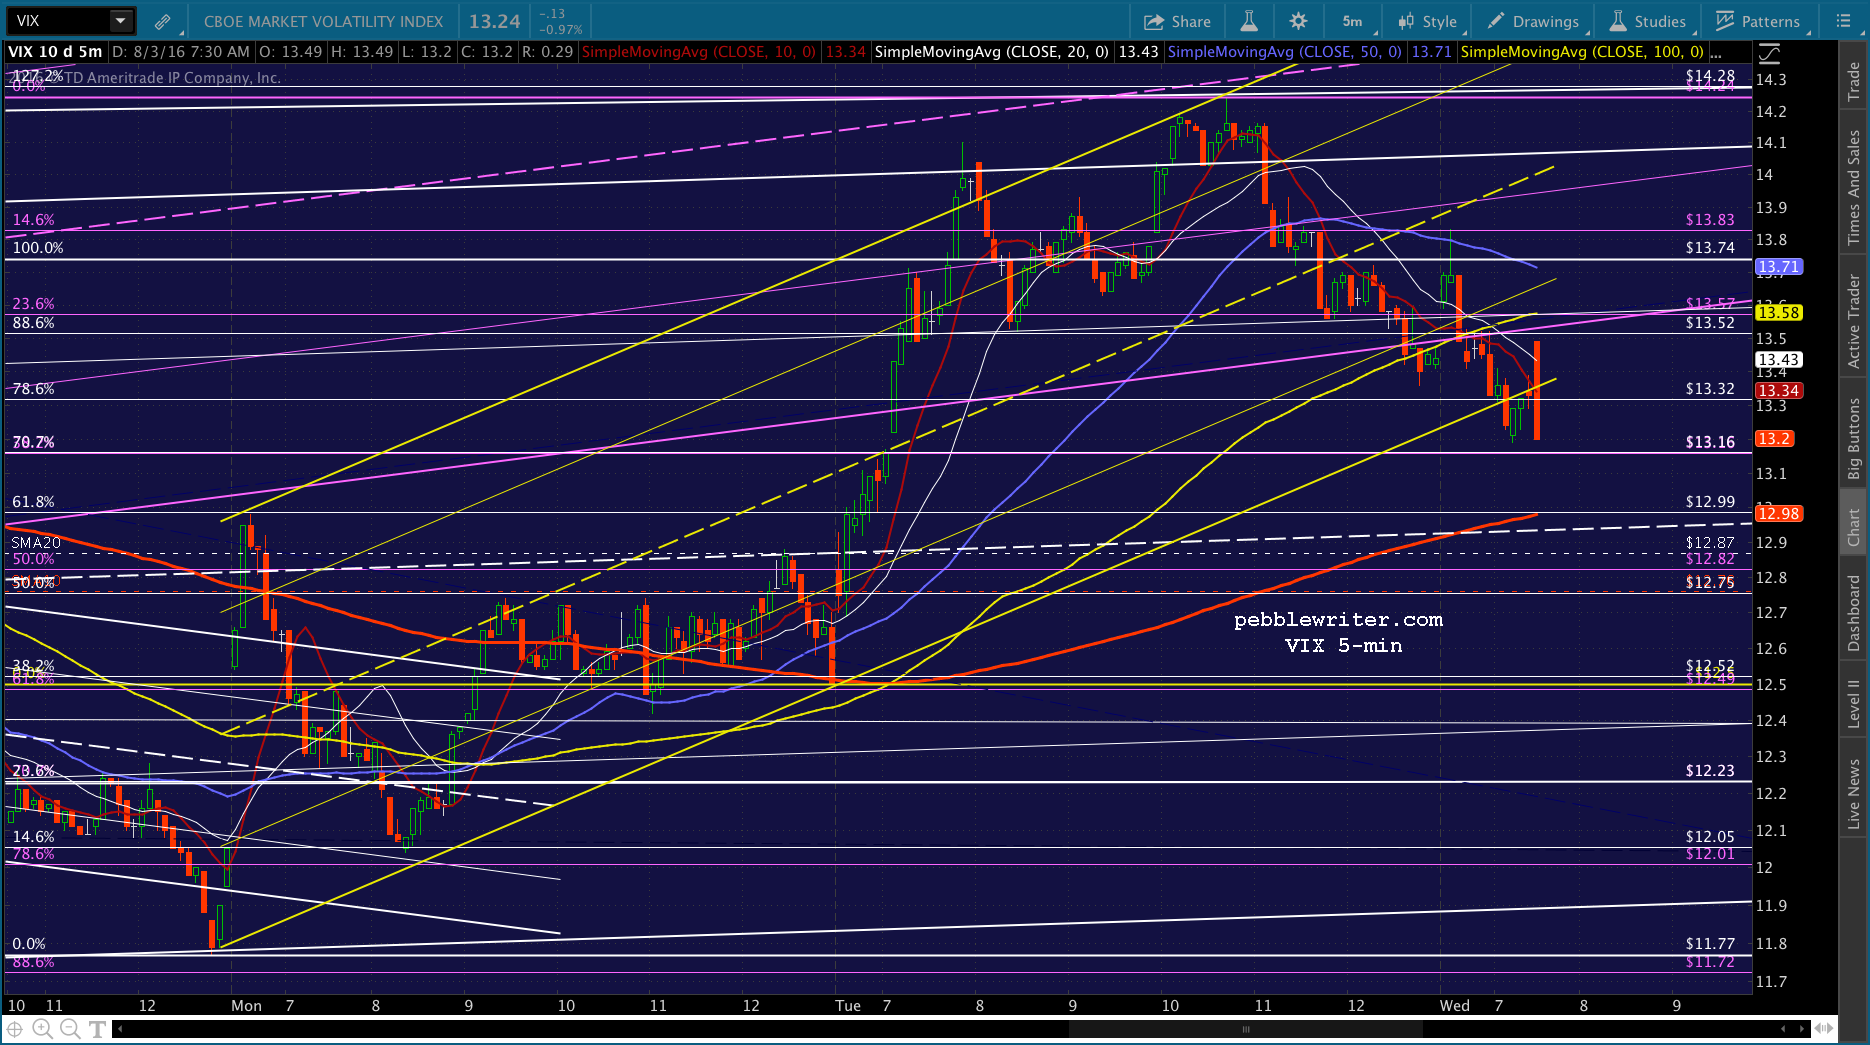
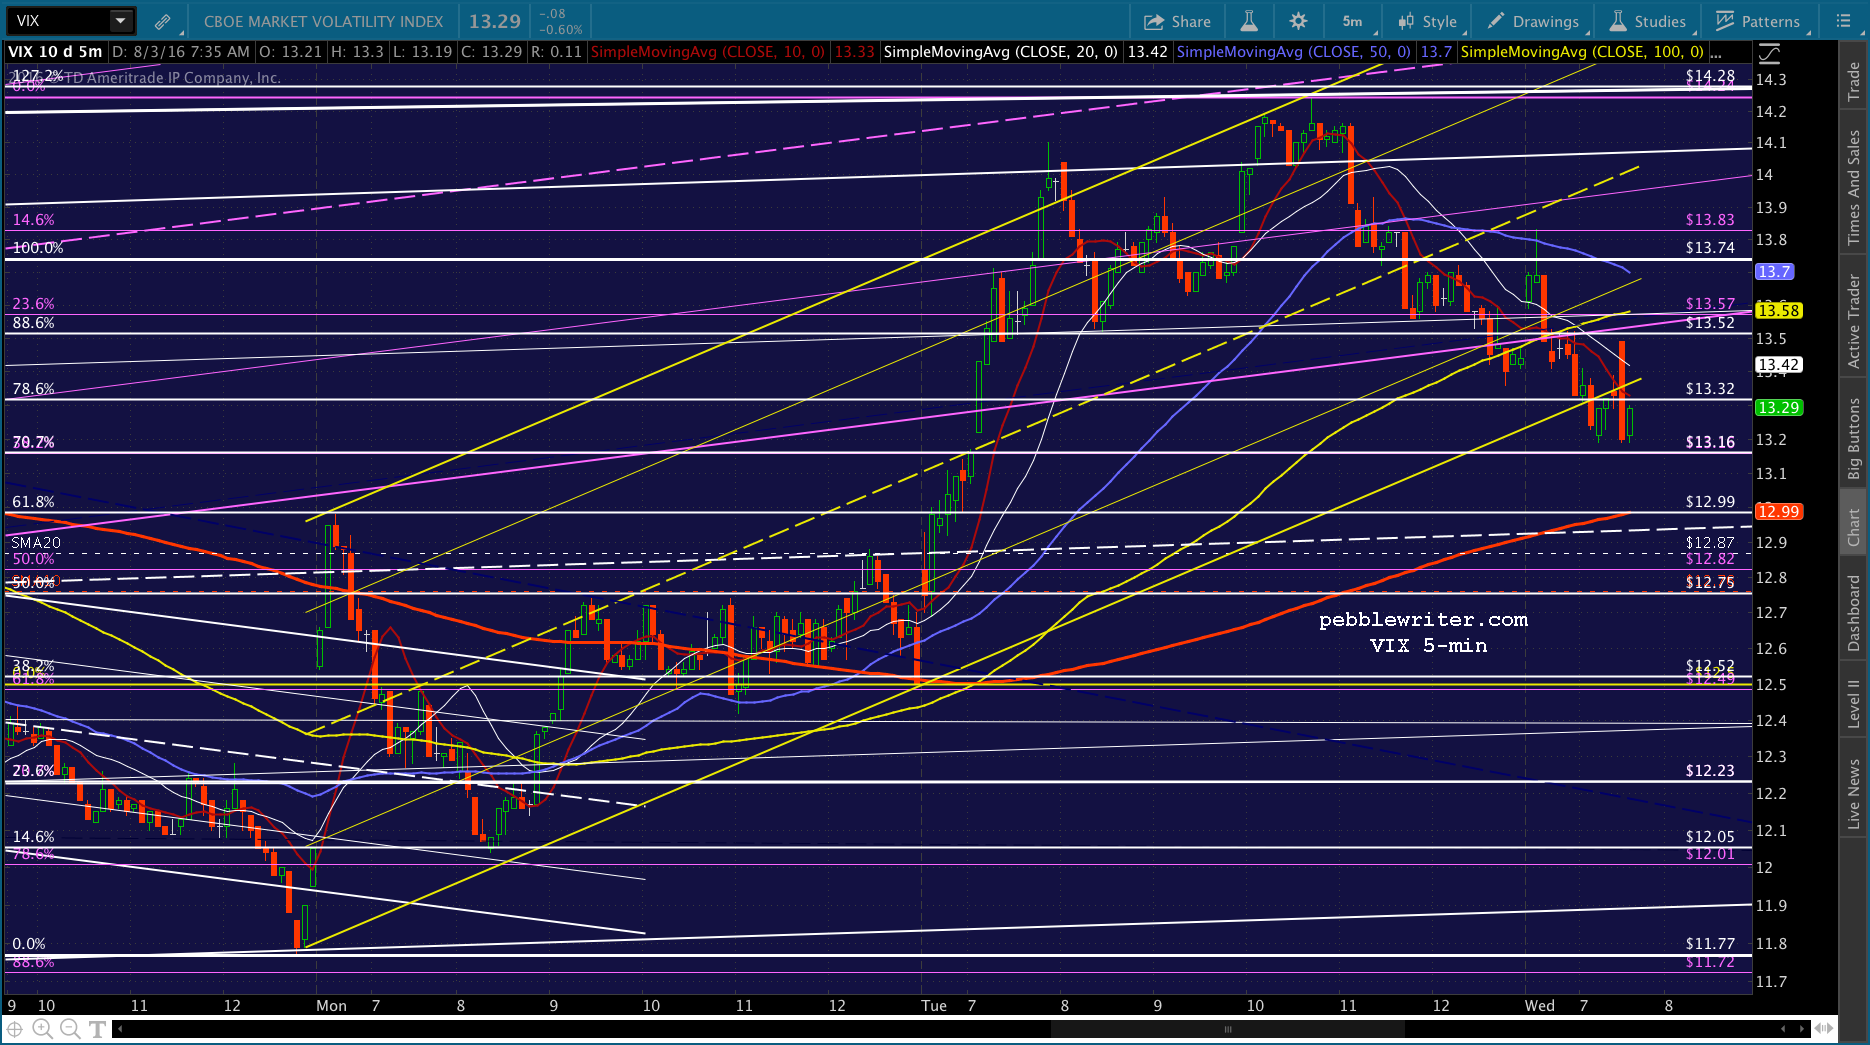
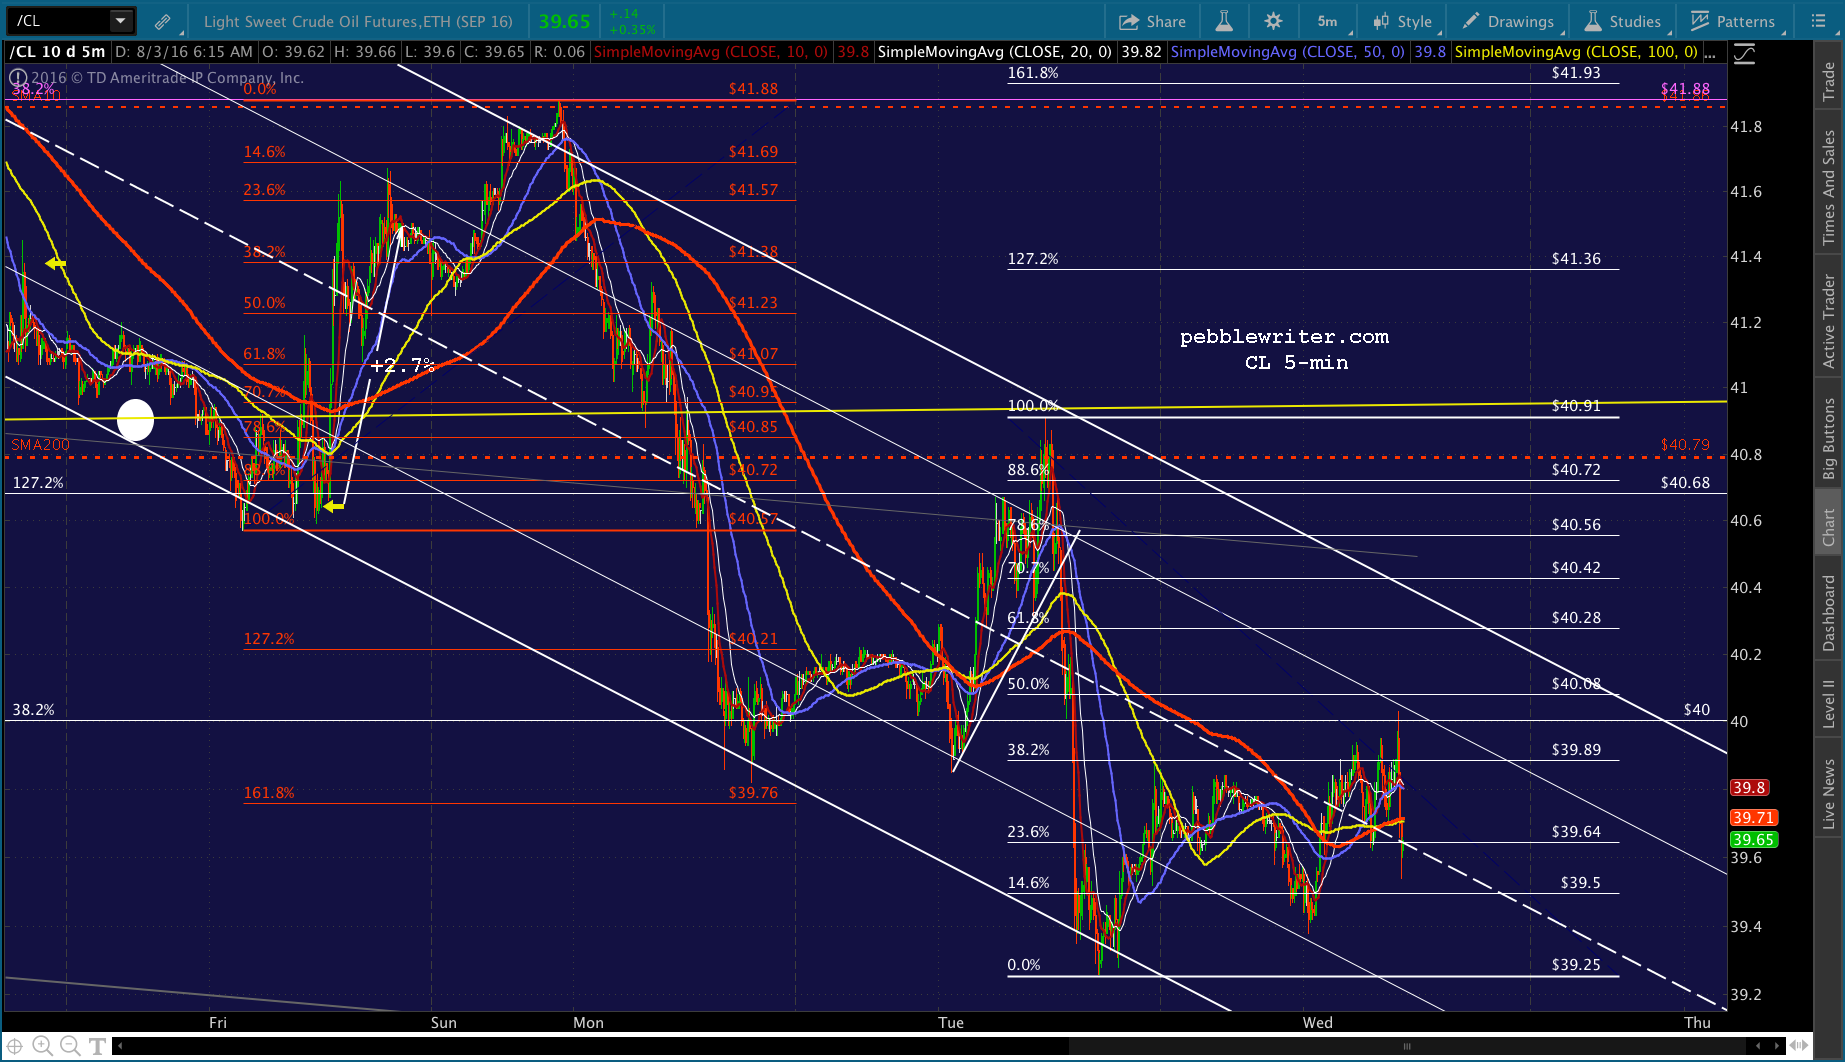 VIX is finally starting to make some sense, with the rising white channel appearing to be fairly legit, with the rising yellow channel below as the most likely path ahead.

 USDJPY’s rising white channel broke down, but not by much.
  And, the pattern since the break down reflects an attempt to limit the damage while providing an opportunity to move lower intraday within the small white channel.
 UPDATE: 9:49 AM
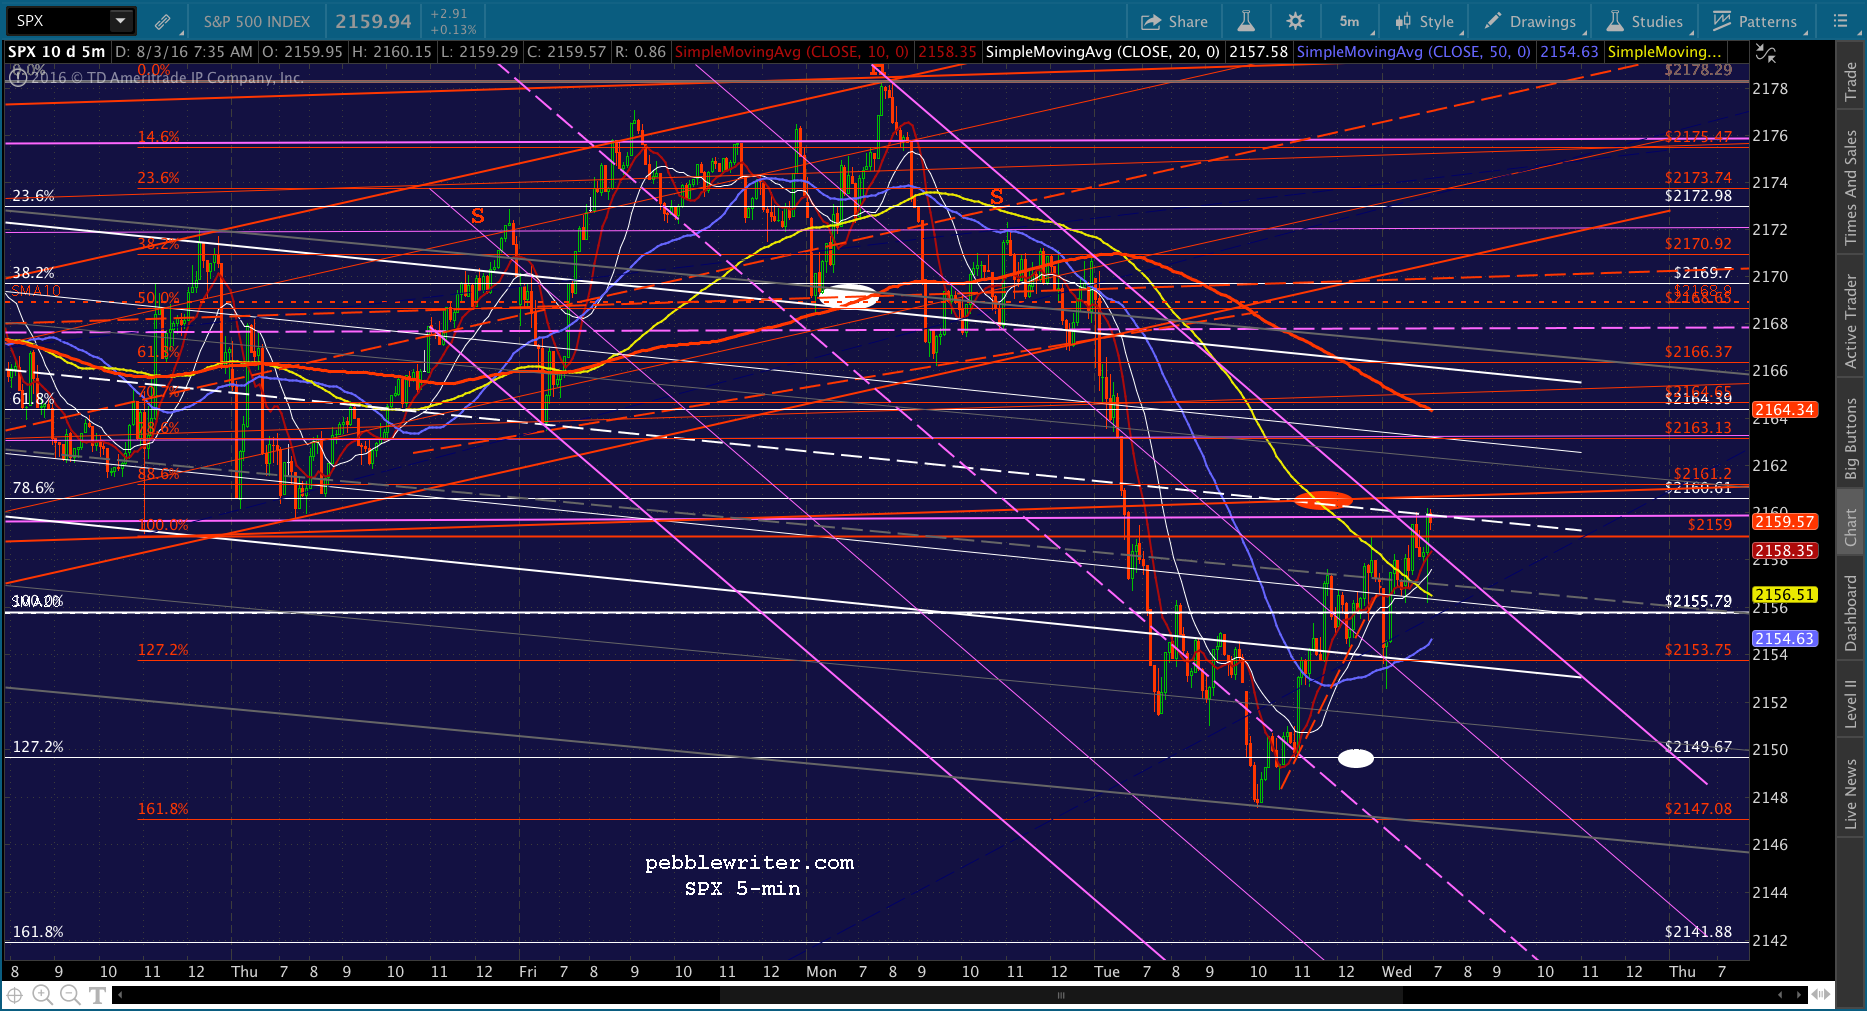
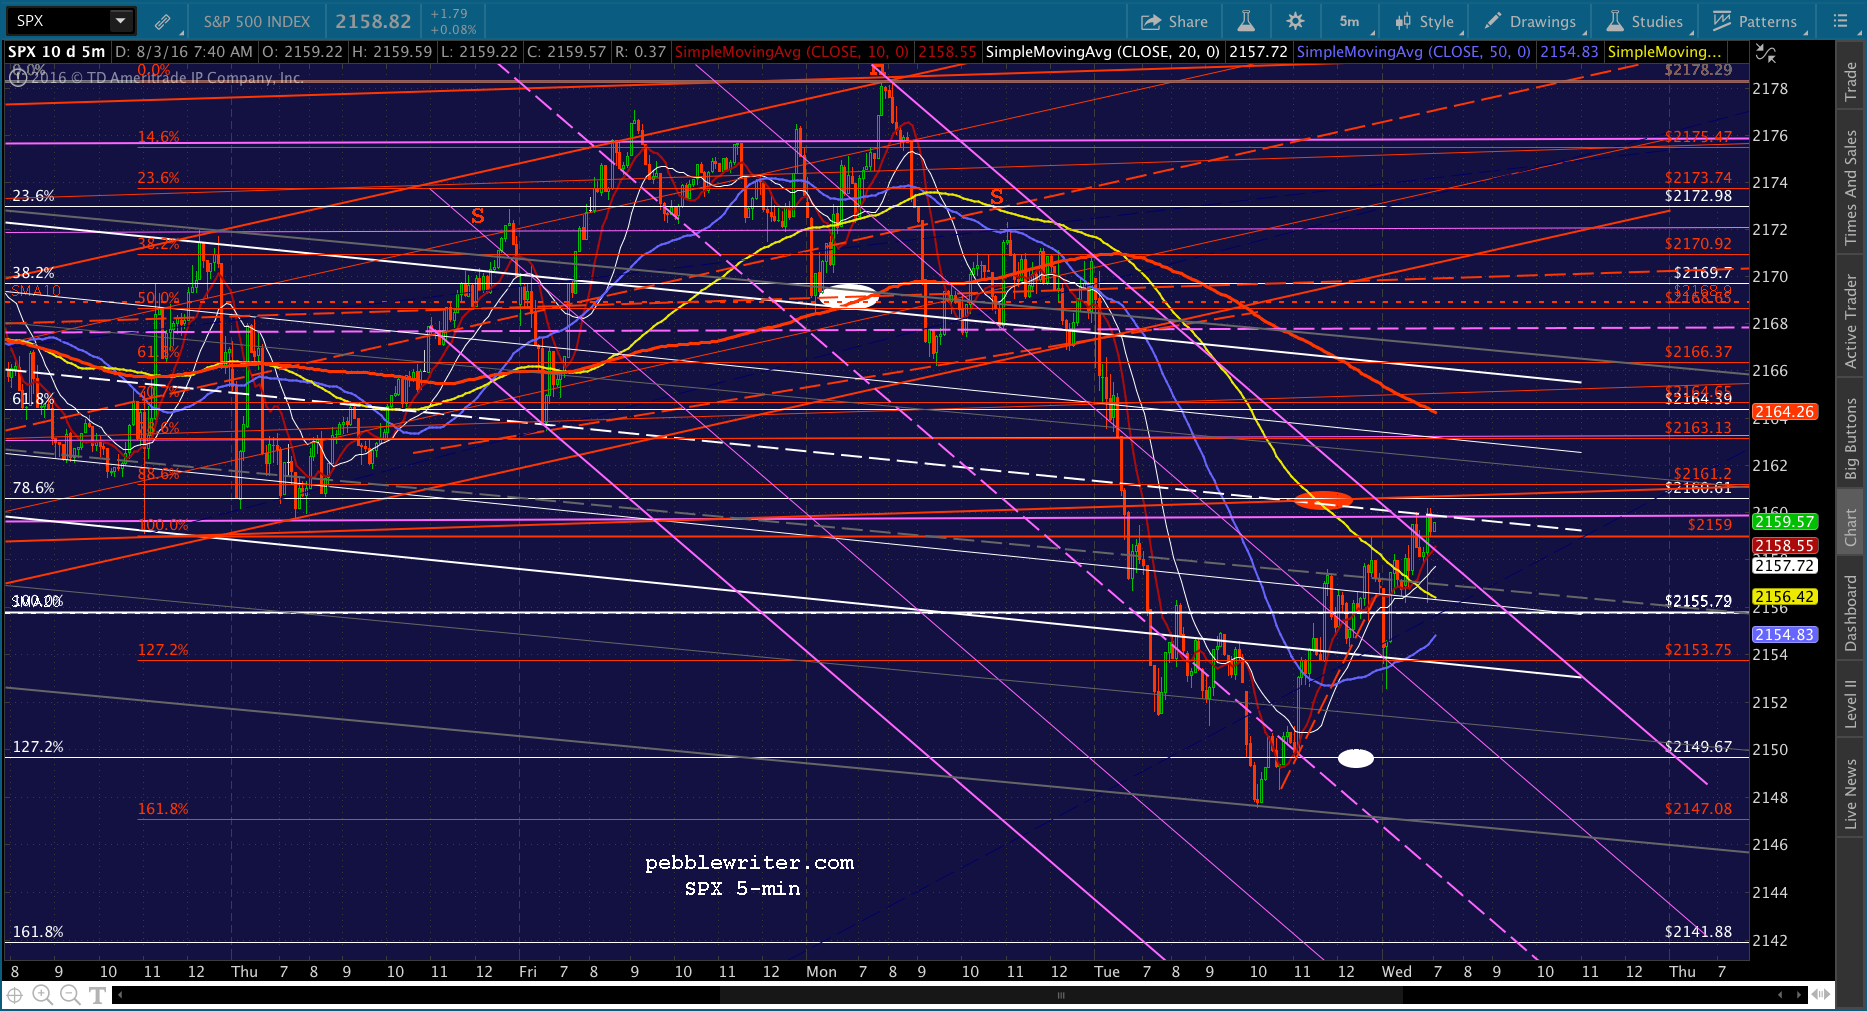
For those who didn’t hold short overnight, we’re nearing a good entry point for a short position. I think it’s likely to pop up and tag the white channel midline at 2160 before reversing. But, this could work here, too. UPDATE: 10:16 AM
There’s the white channel midline backtest. SPX should turn down here if the falling purple channel is going to hold. I’d want to be short here with tight stops. Of course, any downturn will rely on USDJPY and CL reversing off the top of their rising white channels.
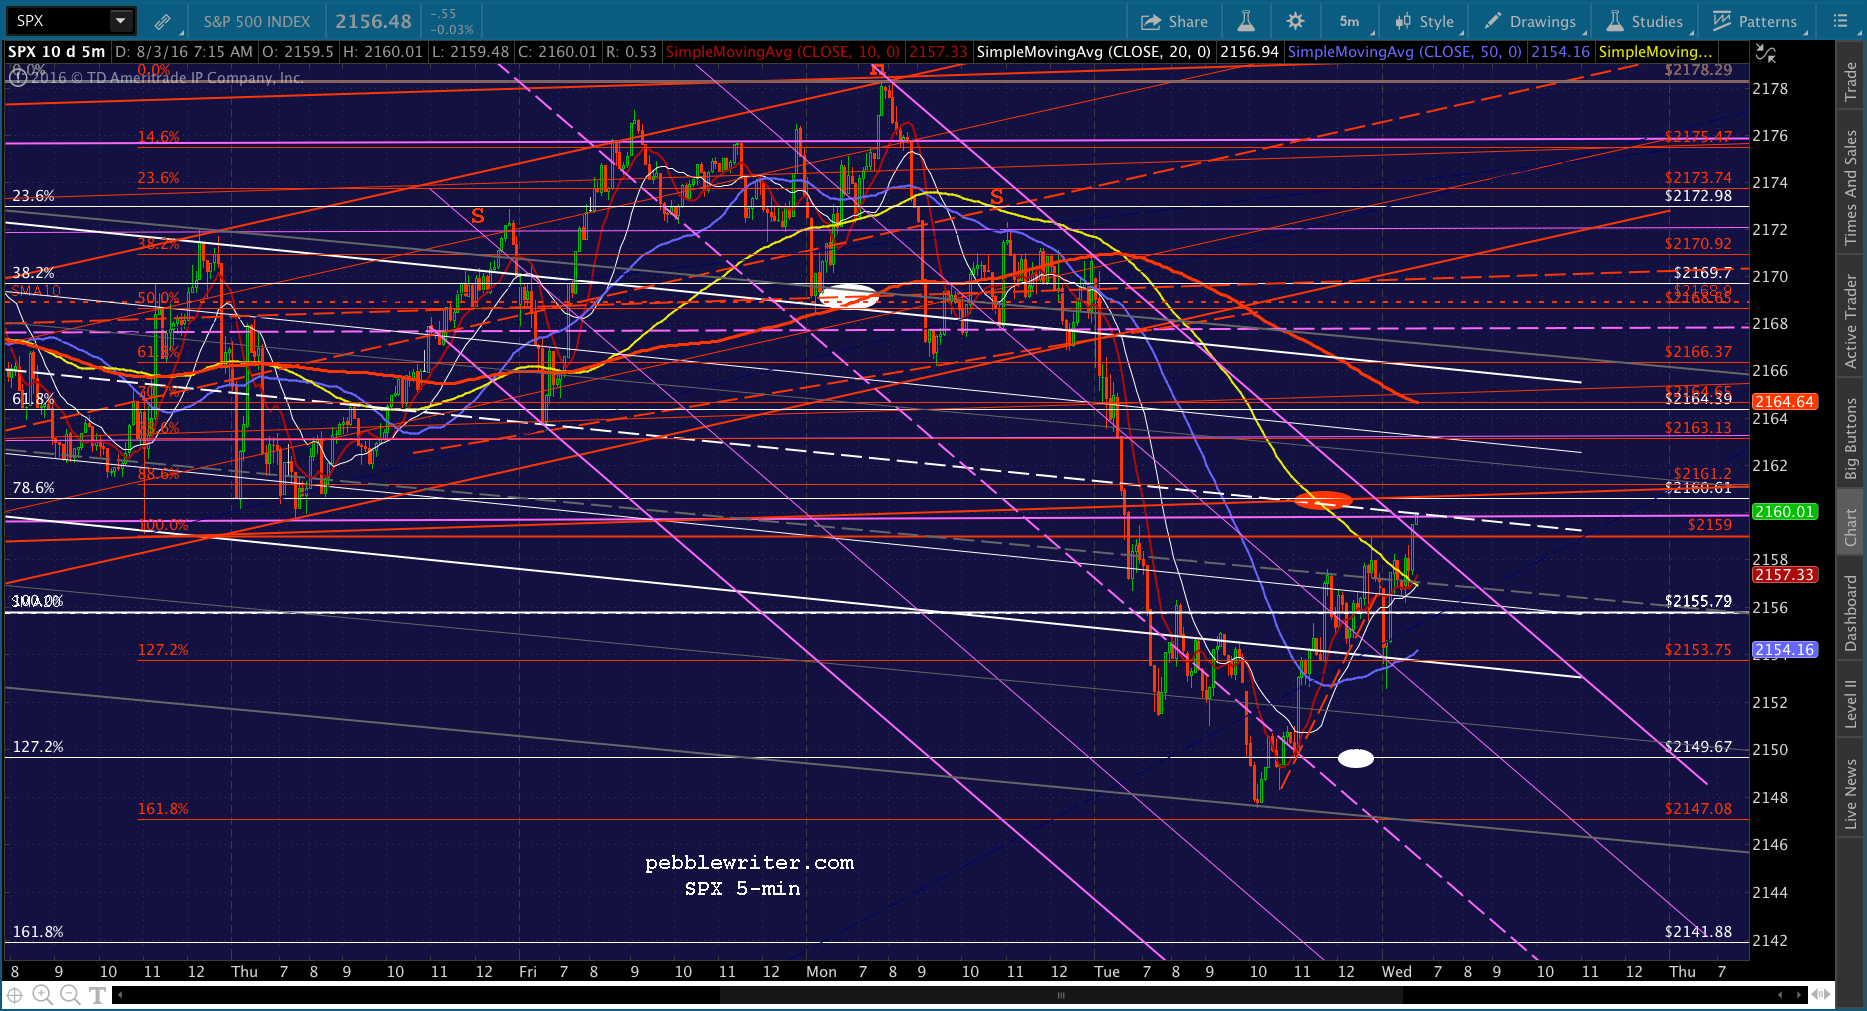
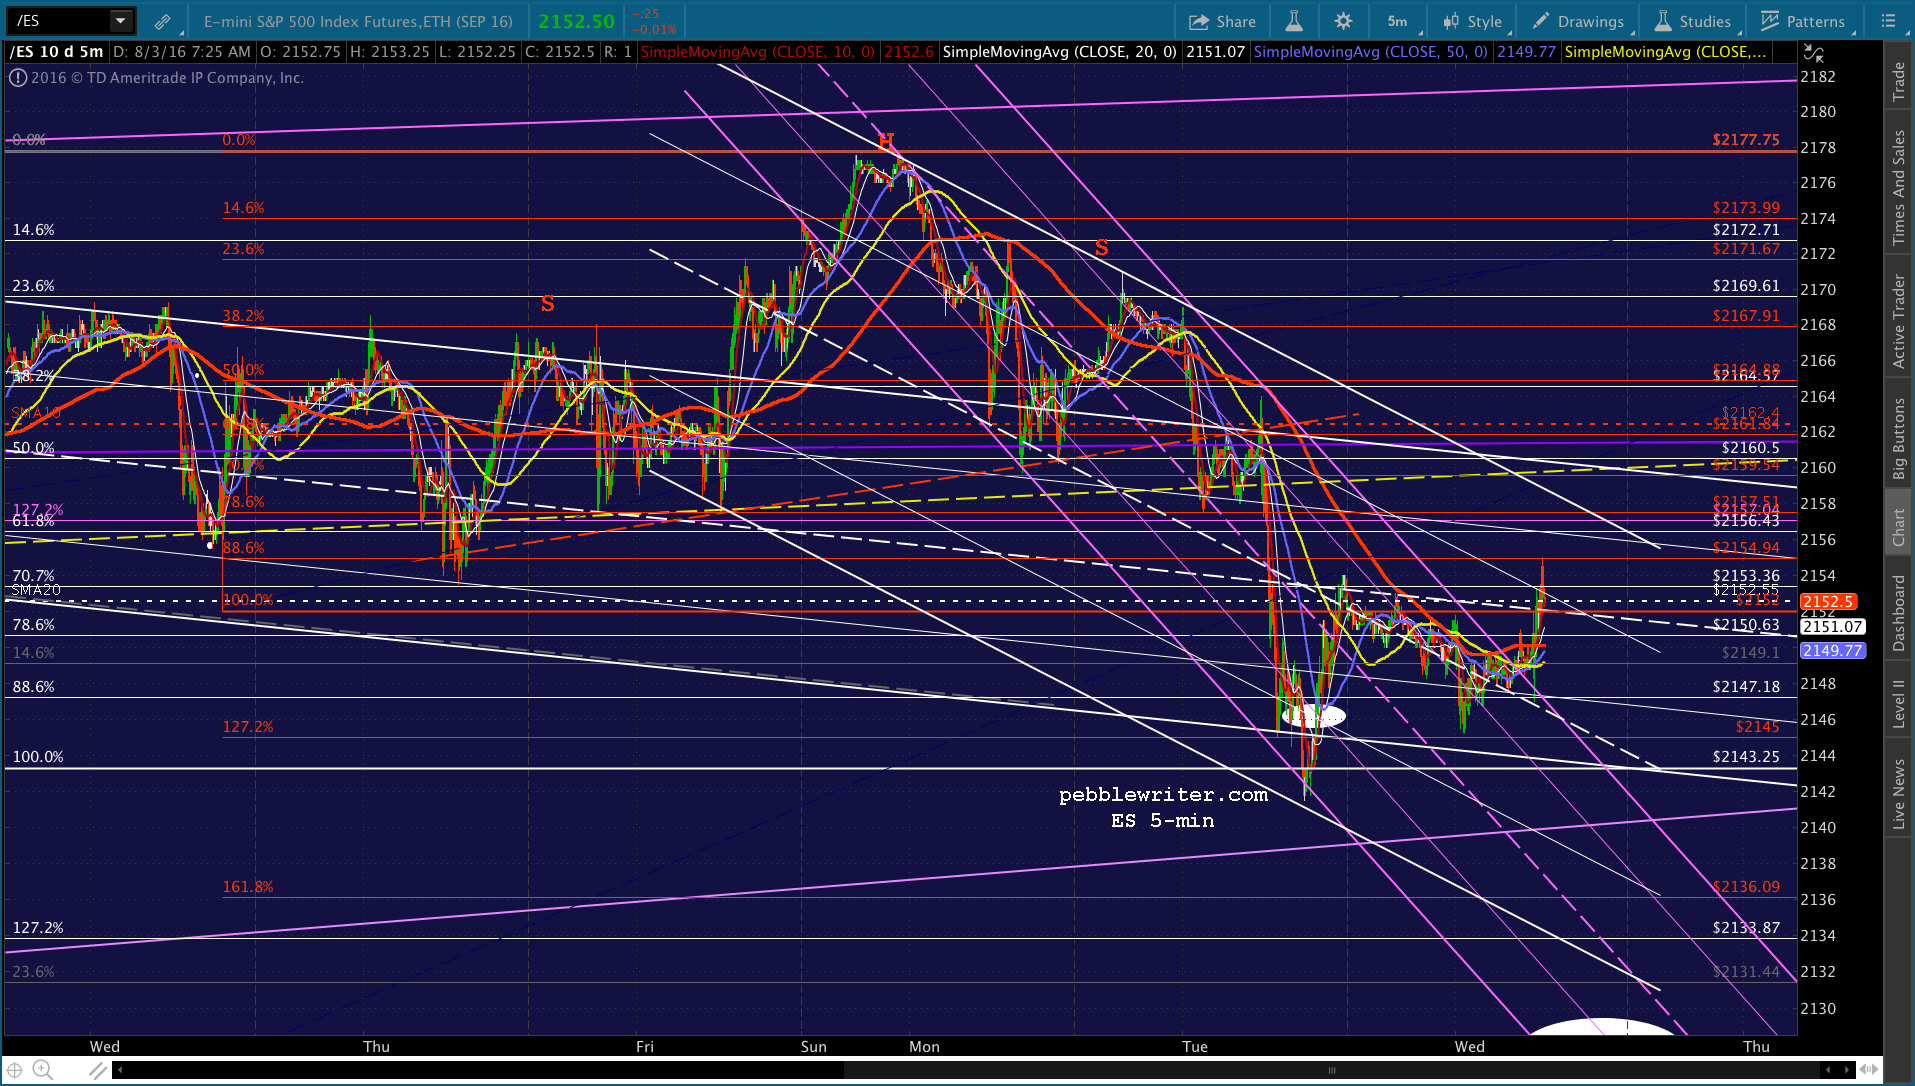
 My only other concern at this point is ES, which offers an alternative falling channel, shown below in white. It argues for another 6 points higher, to the yellow TL at 2160. We’ll watch to see what happens when the SMA5 10 catches up in a few minutes. If it scoops it up and heads higher, then I’d sit out the rise to SPX’s SMA5 200, now at 2164.48.
 The oil inventory report is coming out in a few minutes…
UPDATE: 10:32 AM
We got a 1.4 MM barrel build instead of the 1.4 MM barrel drop that was expected. Oops.
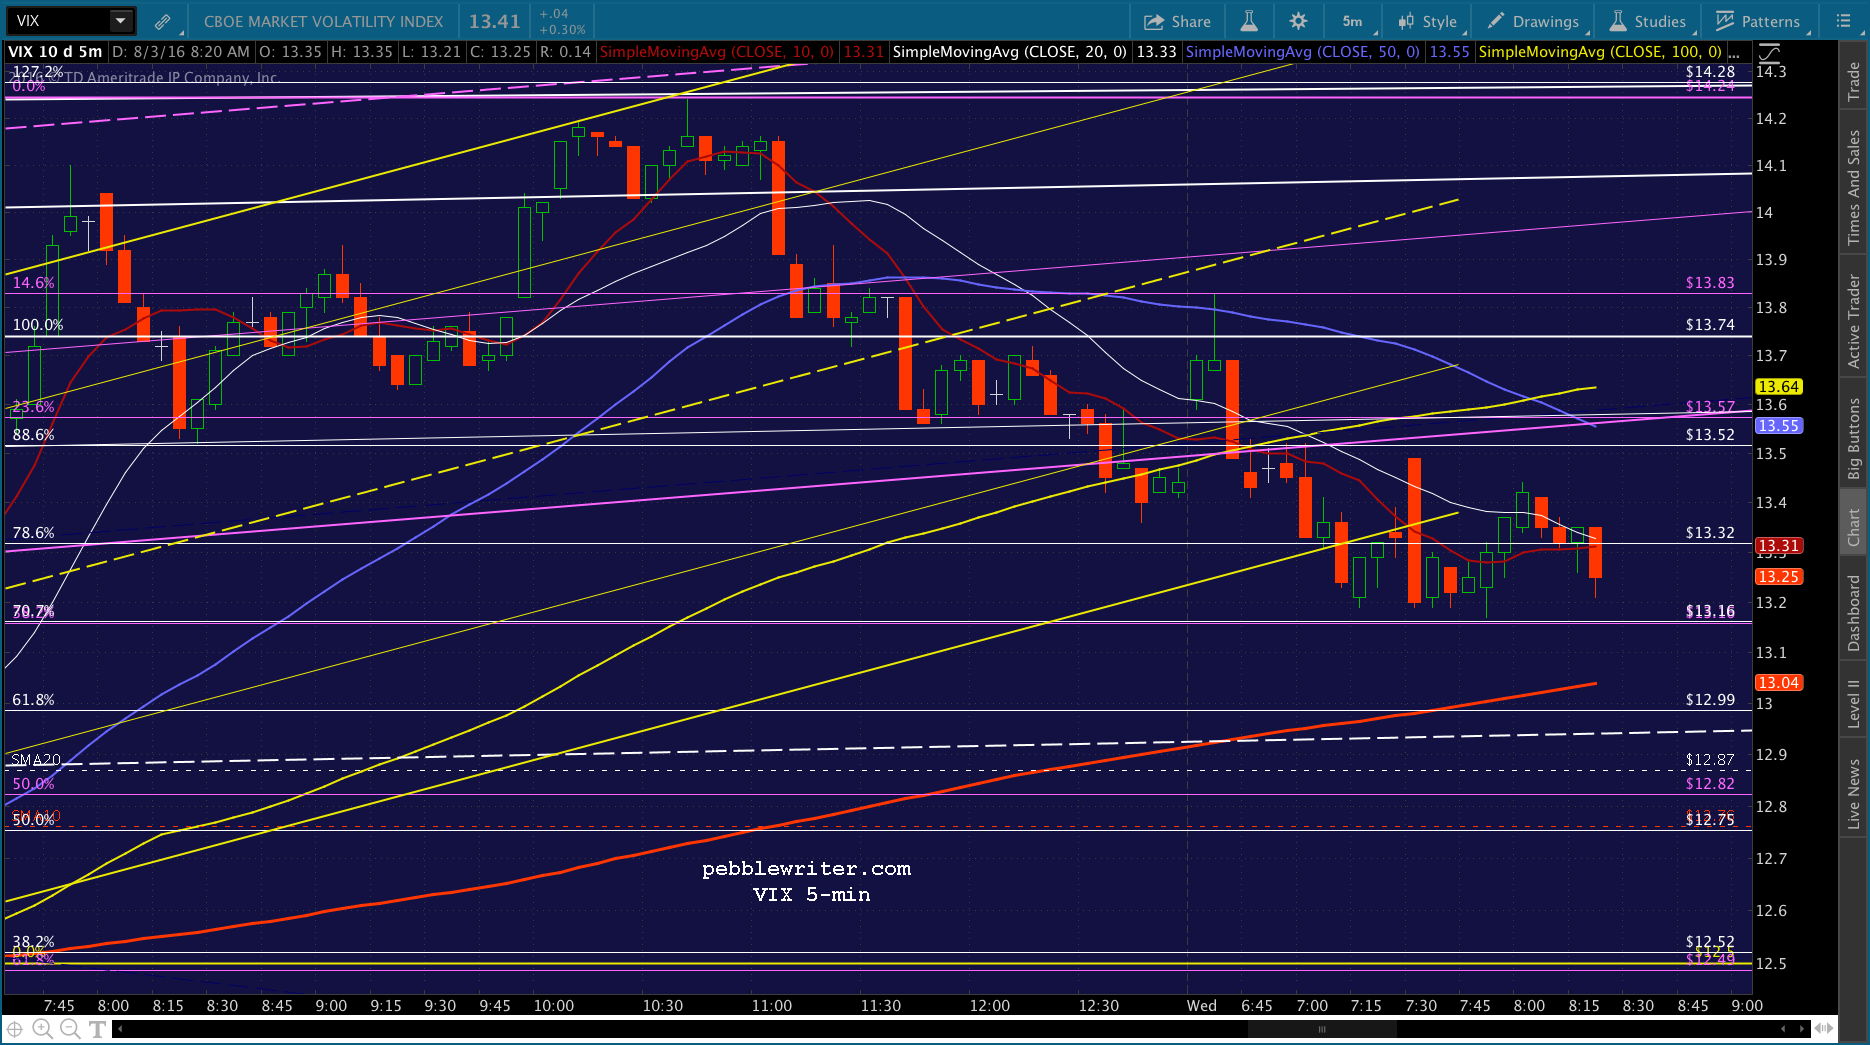
 But, VIX is getting hammered. Looks like we might go higher. Watch your stops.
 UPDATE: 10:36 AM
USDJPY broke out, NKD is thinking about it, VIX is back below the yellow channel bottom — not a great picture. We need CL to pull back sharply in order for me to want to stay short. 

 UPDATE: 10:40 AM
The algos are really working VIX, with 12.99 due soon. I’d dump the short position on any move up through 2160 unless you’re willing to ride out a pop up to 2164.
 UPDATE: 11:14 AM
With bank shares tumbling in Europe, it appears that the market will be propped up today — at least through the euro close. CL is back in the white channel and has obviously reversed off the larger falling white channel. 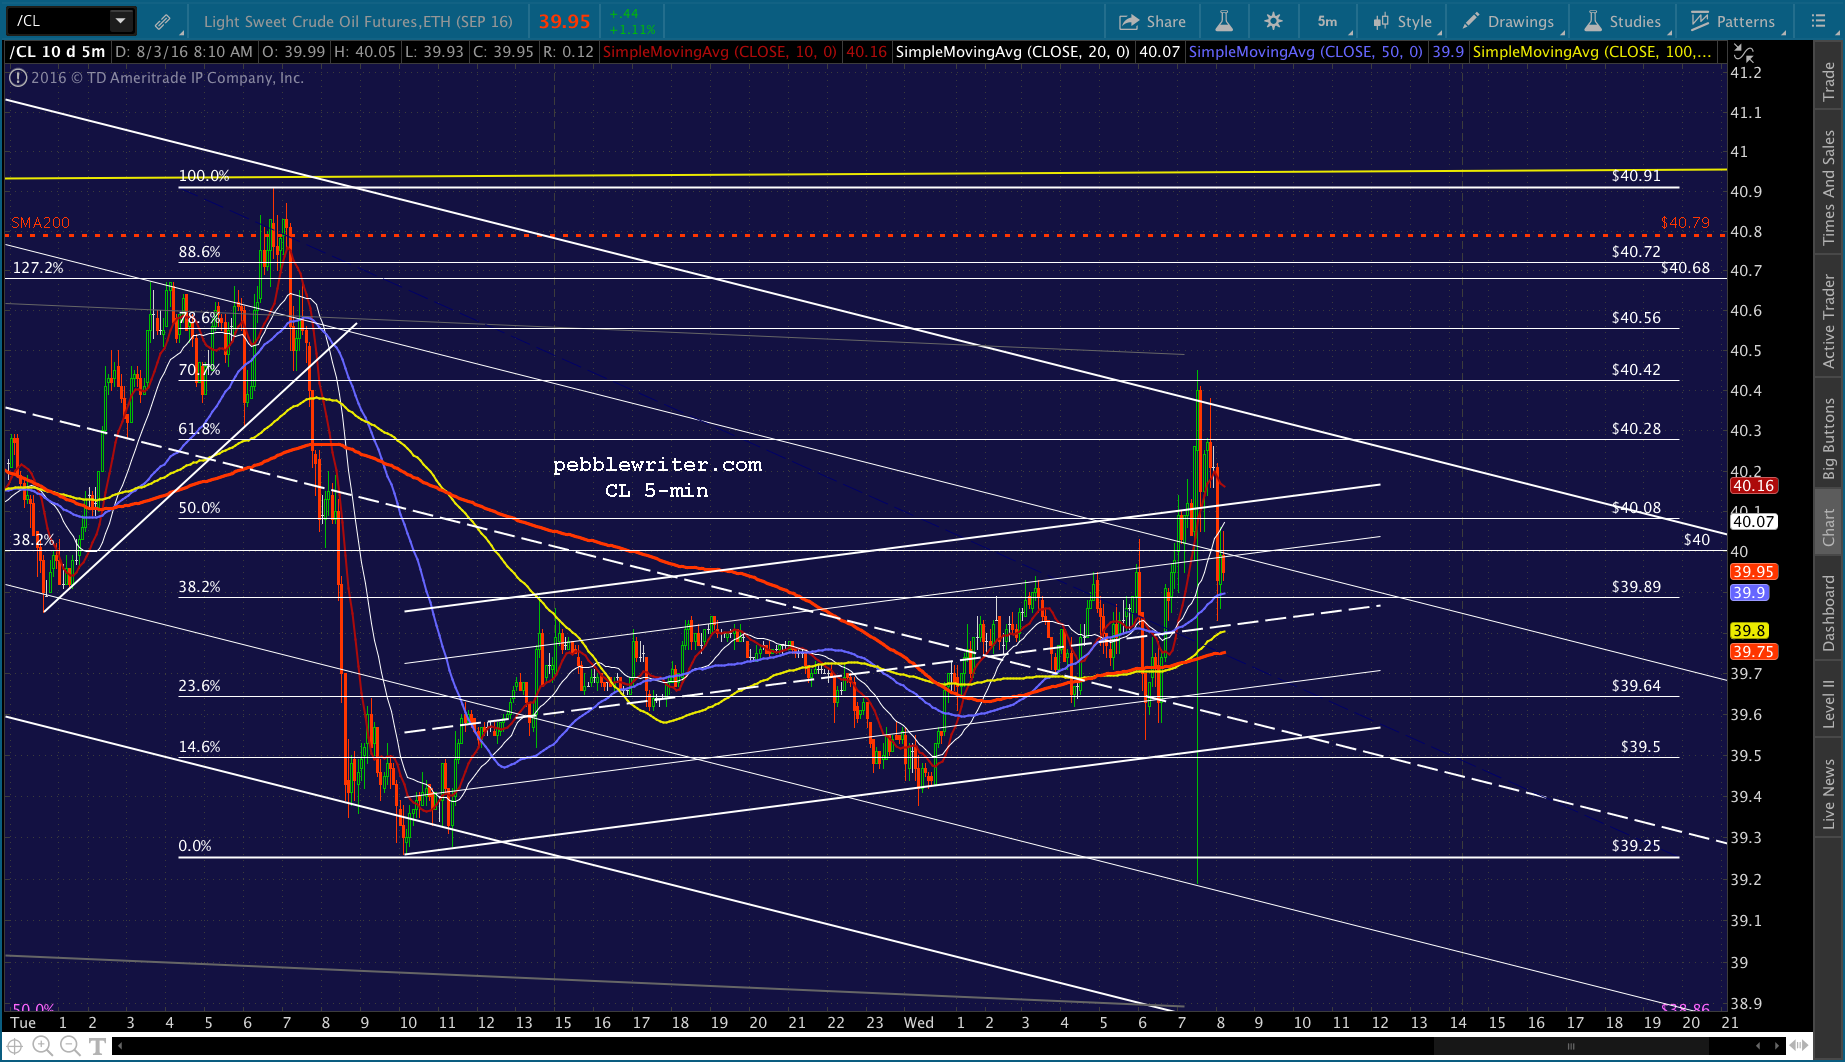 USDJPY is back within the rising white channel.
  NKD reversed off its SMA5 200.
  VIX is still bouncing around, not committing to a direction.
 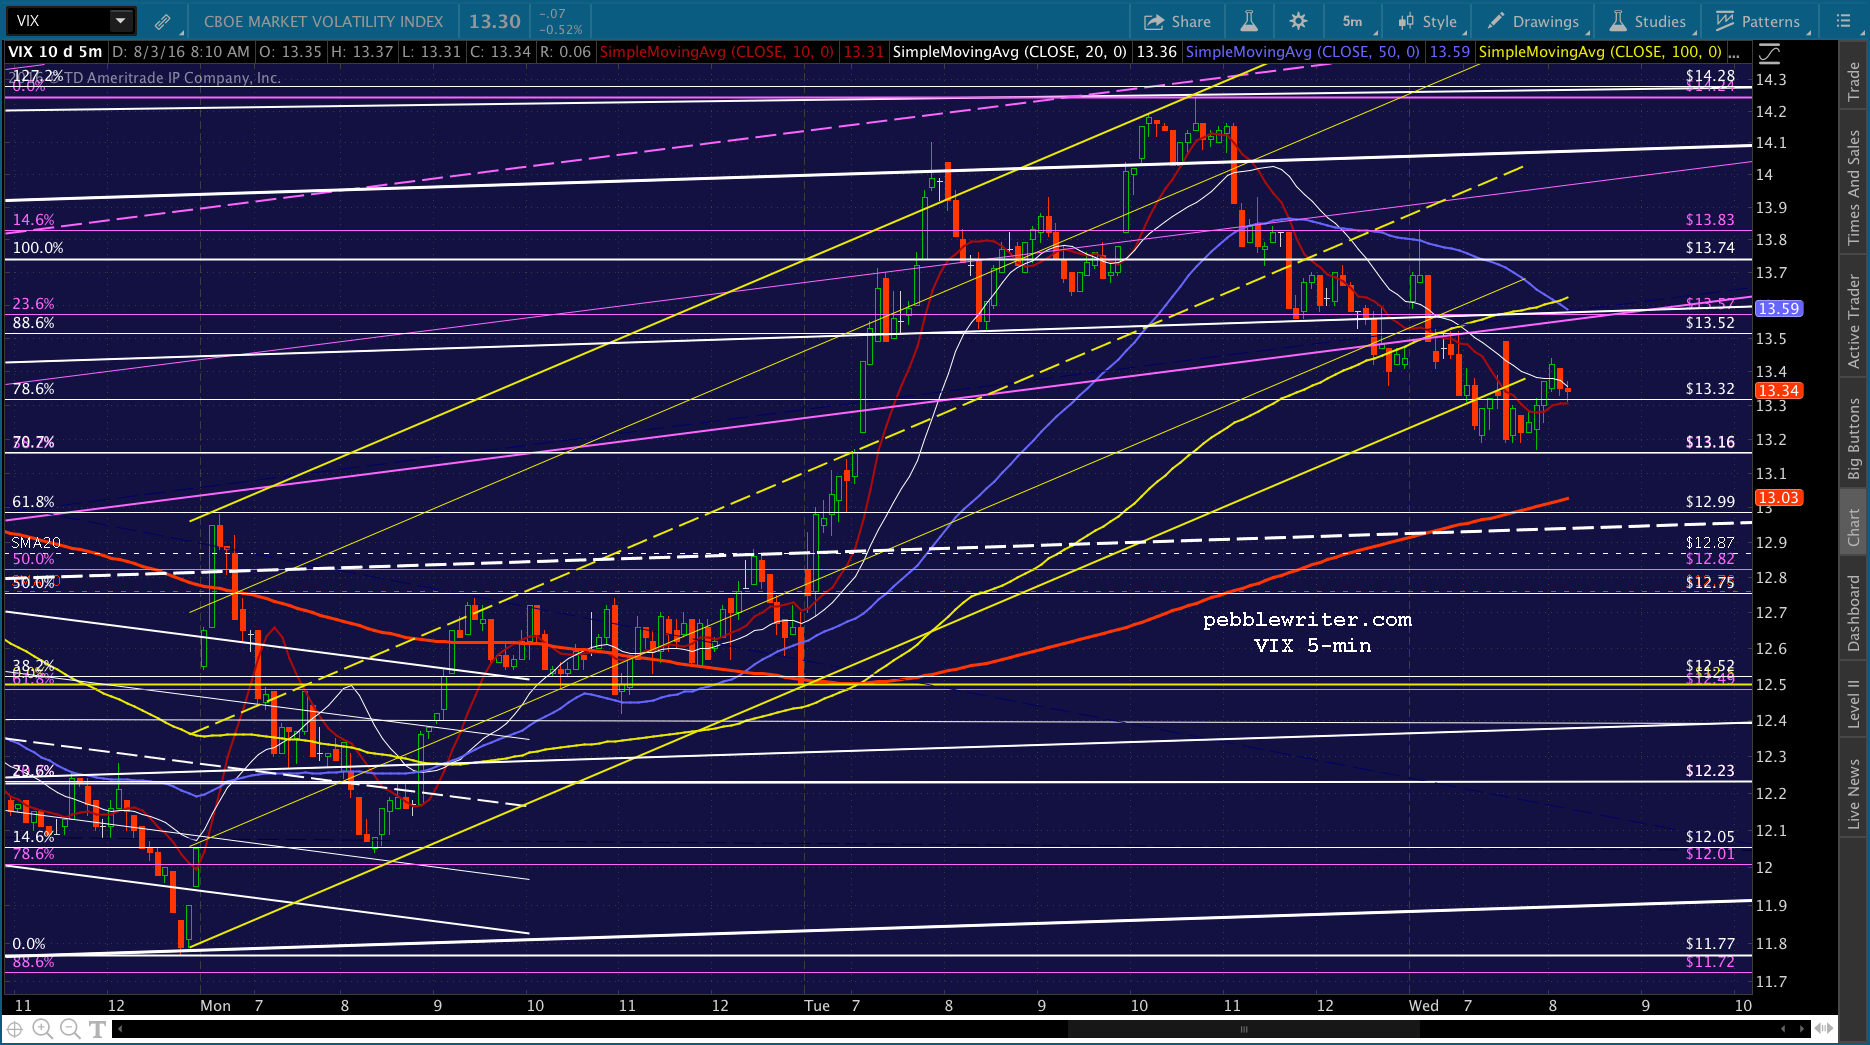 And, SPX, while certainly not breaking down, has also not broken out. This all smacks of a holding pattern to me. If it falls apart in 20 minutes, we’ll know the ECB was probably behind it. Note that the SMA5 200 has dropped below 2164.
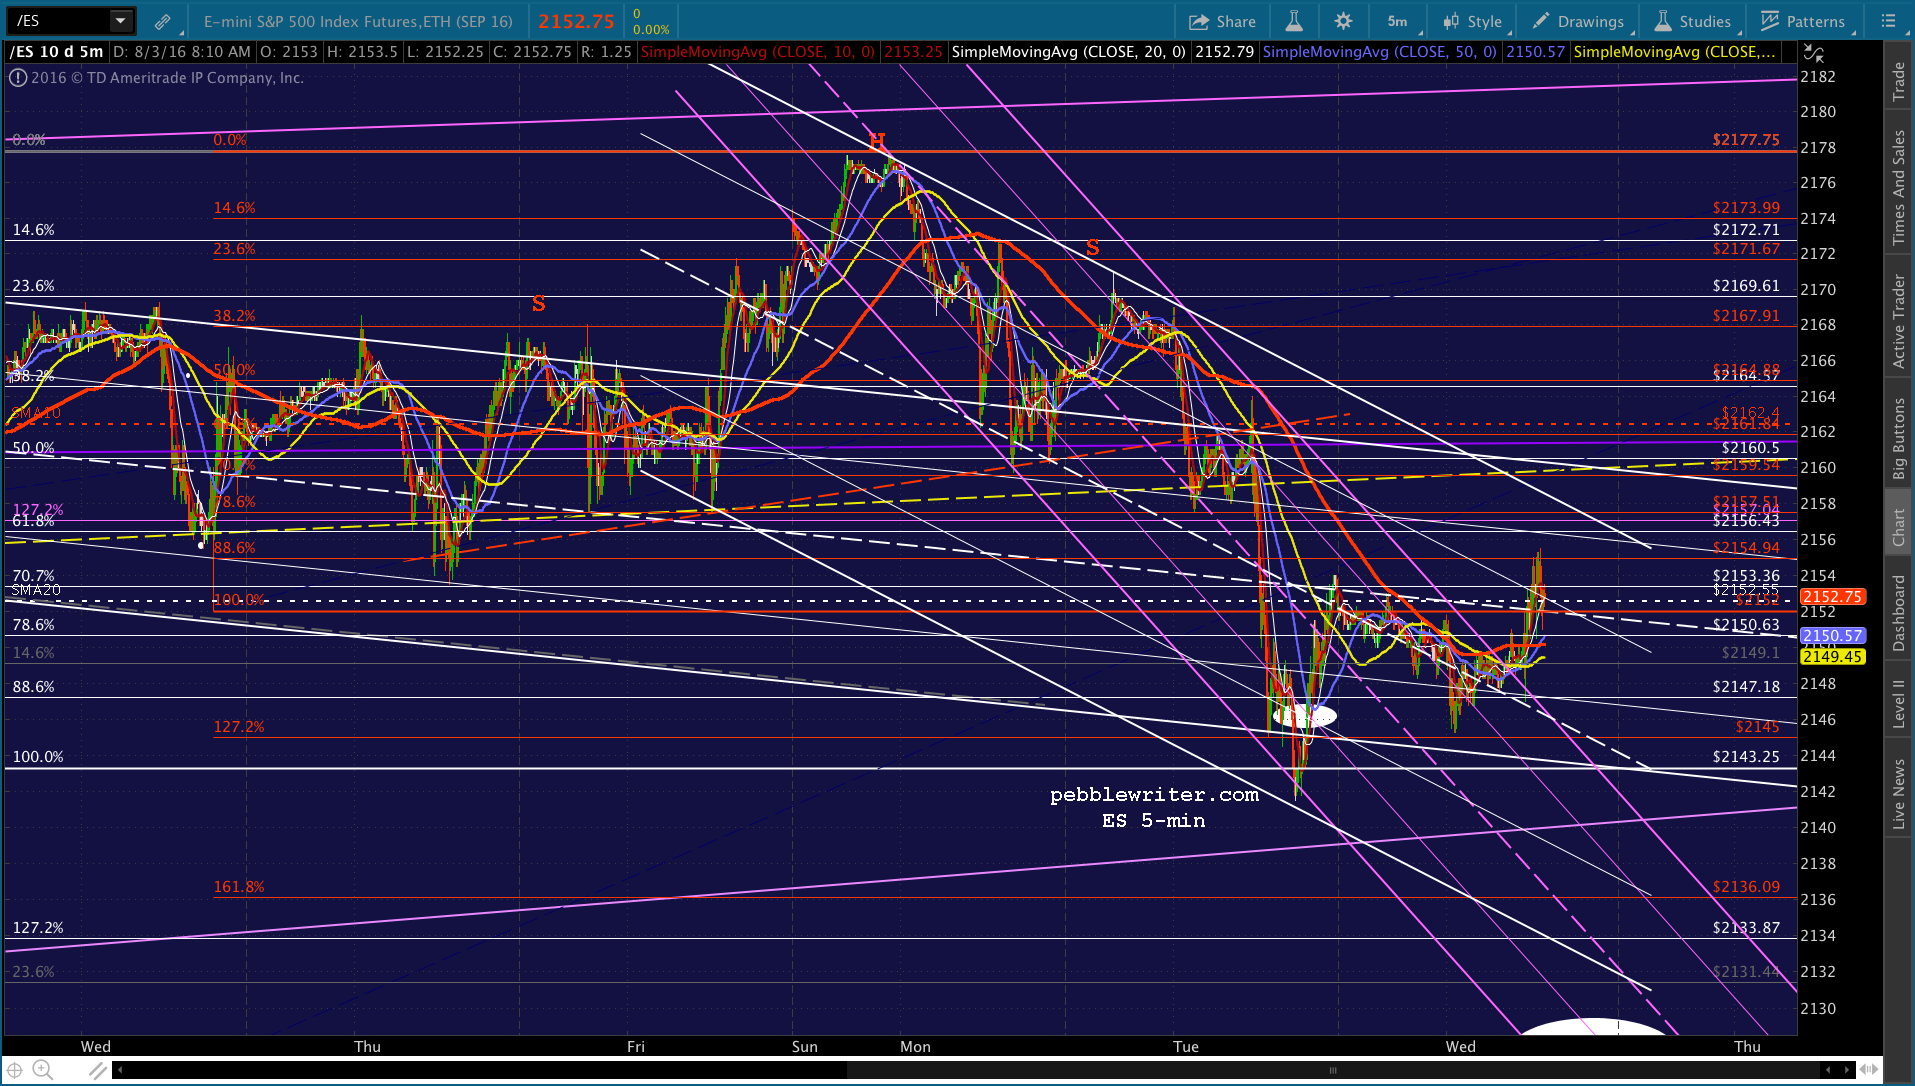
 UPDATE: 11:21 AM
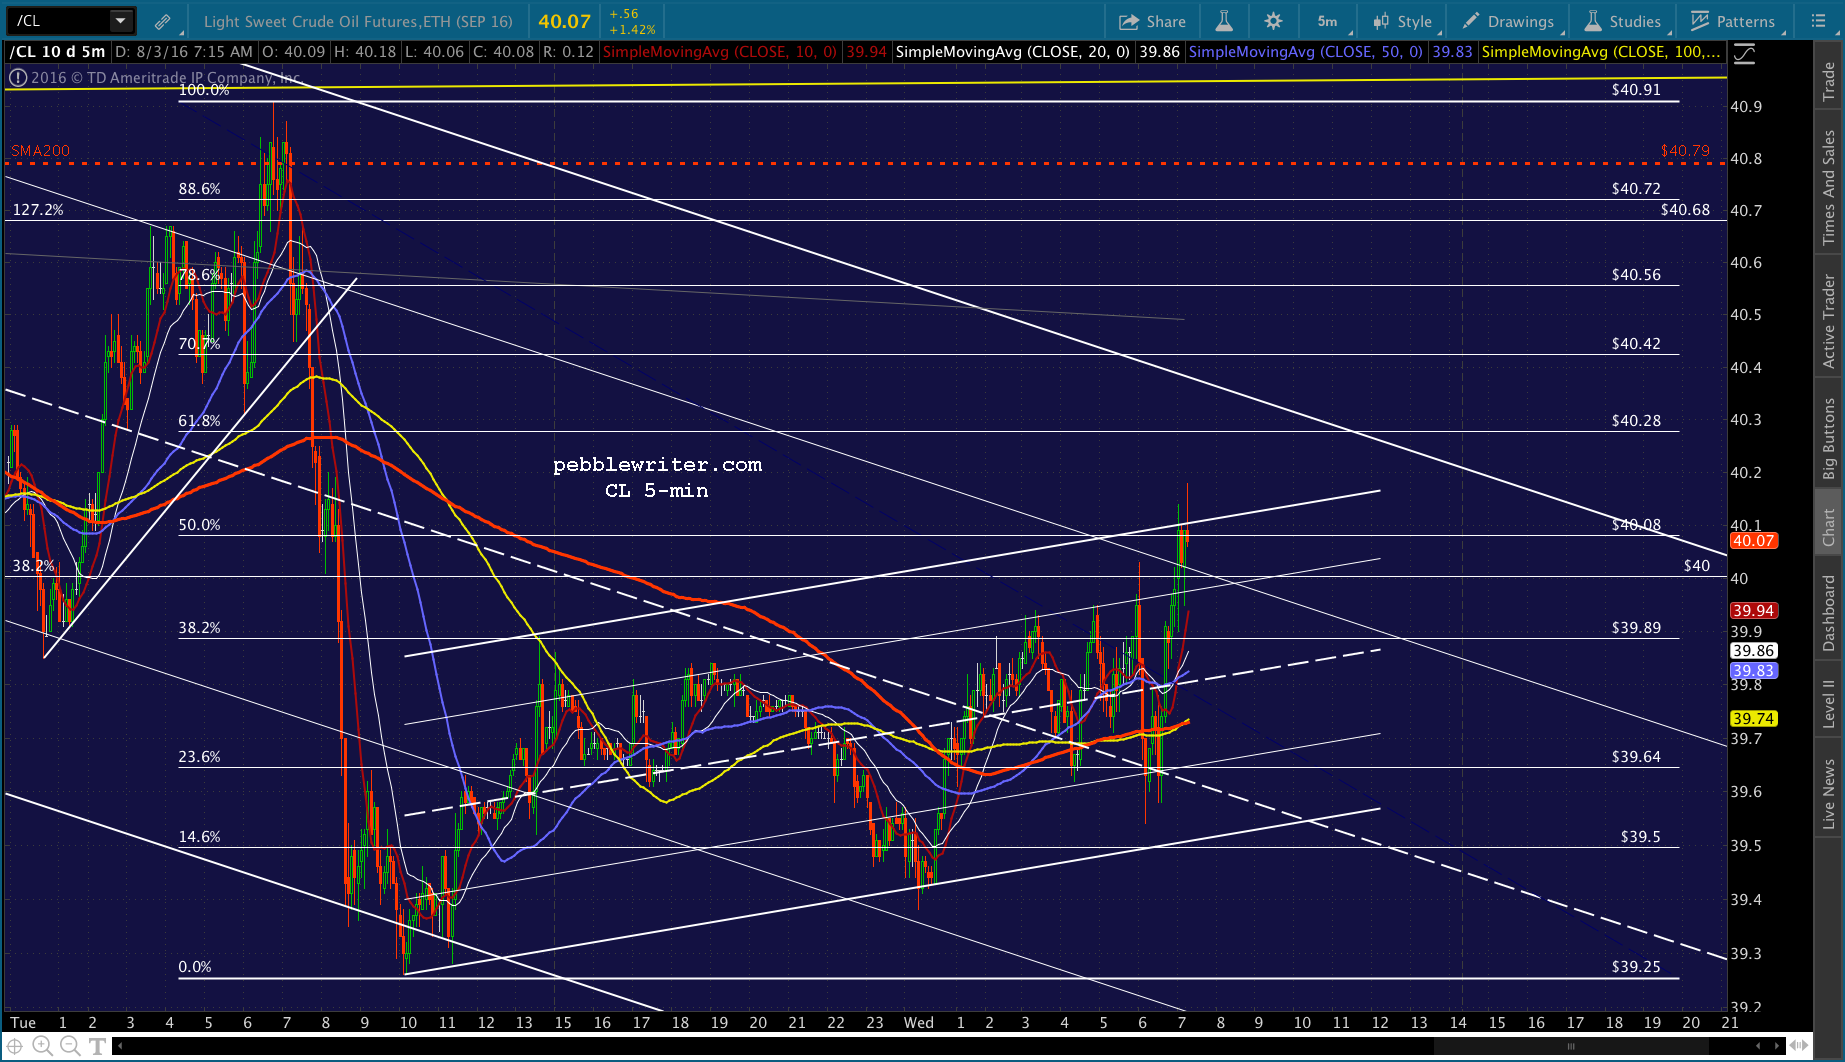
CL is popping again. Again, I’d dump the short here on any break out through the earlier highs.

 UPDATE: 11:53
The relentless holding pattern continues – now with CL breaking out and nearing its SMA200 and VIX breaking down further. Still an expectation of SPX will pop up to tag that SMA5 200 — but, no idea when. I think I’ll cash out here and wait for a better sell signal.
If CL tops its SMA200, and VIX gets slammed, SPX could easily pop up to 2165. And, from there, they could start thinking about the white channel top at 2166 or even backtesting the red channel bottom at 2170.
Besides, this will give me time to post some details on the analog I’m working on.


UPDATE: 1:25 PM
So, what I’m learning from my web hosting service is that everything I post here from now on will not make it onto the new server. I’ll simply have to save it elsewhere and then repopulate the new one once it’s live. Apparently not a big deal.
In order to simplify things, I’ll post the analog/big-picture stuff at the end of this post and continue any intra-day stuff here. That way, I can keep it segregated and hopefully, easier to follow.
UPDATE: 1:54 PM
For those watching the squiggles in SPX, the rising red channel is breaking down and will potentially result in the SMA5 100 being tagged at 2156.50ish. There is plenty of selling pressure, so it could turn in to more. However, CL has been able to stave it off with an occasional spurt back above the SMA200 like this one.
It happened about 10 seconds after SPX dropped through the SMA5 20. In other words, I don’t see any downside developing until the algos let loose of CL, USDJPY and VIX. Same old, same old… 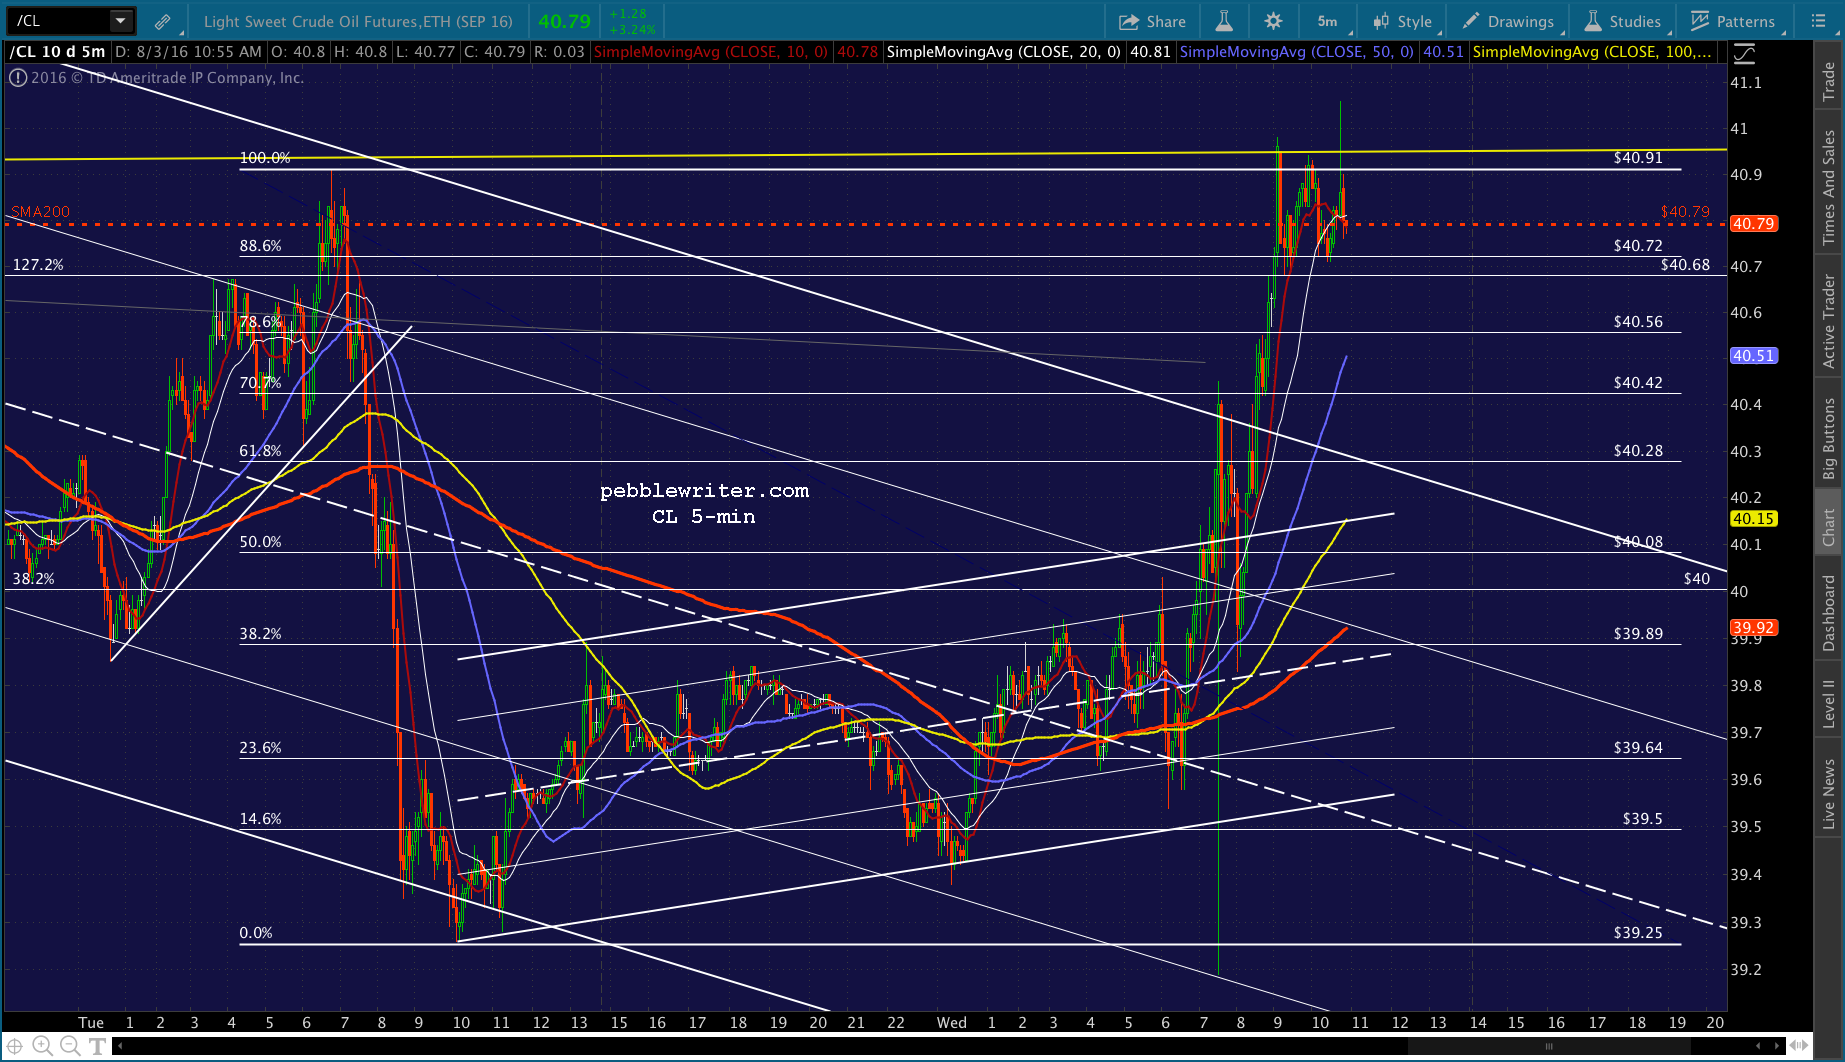 I suspect what they have in mind is to nudge it down to the white channel .786 line as the SMA5 100 arrives in 20-30 minutes, then bump it back up to the SMA5 200 and white channel top toward the close. Or, it could be the other way around.
In either case, I think it’ll trade in the range of 2157-2162 for the rest of the day unless something significant happens to shake it up. I imagine they’re saving the rest of the slide for tomorrow so as not to have two big, negative days in a row.
UPDATE: 3:30 PM
That’s the top of the falling white channel. I’d short here at 2161.09 and see what develops. Just know that we’ll probably be stuck in a situation of having to guess whether there’s an overnight ramp or the rest of the decline. Looking at CL, there’s either a good chance of a break out, or at least someone wants you to think there is.
I’m betting on more downside, and would be happy to take the chance of being short here. But, I never advise this unless you can handle the gap risk, can hedge or can at least closely watch your position.
BTW, ES isn’t quite to the top of its falling white channel, so SPX could very well slip a few points higher into the close and still reverse lower in the morning.


Comments
4 responses to “A New Analog: Aug 3, 2016”
Reading the analog post so far on 8/11, so far so good. Great analysis. As CL would decline, USDJPY would rise (depreciate of yen), it implies a strong rebound if dollar index?
All else being equal, yes. But, remember, DX is much more heavily influenced by the euro. So, we can’t rule out an impact that would outweigh the yen’s.
What a “Market”. Supposed to be bad news to CL and CL rises more than 3% instead.
same as it ever was…