

Listening to various government officials and billionaires talk about the Brexit, I’m reminded of the outstanding Barry McGuire Vietnam War classic Eve of Destruction (how many other songs can work the word “coagulating” into the lyrics?)
Would a Brexit really bring the house of cards tumbling down? And, why are TPTB so apoplectic about it? And, finally, what can we expect from key currency pairs and equity indices?
Instead of focusing on the intraday squiggles in the markets, today I’d like to take a step back and evaluate the big picture in light of what the Brexit might really mean.
First, let me assure you that I have no horse in this race. Though, given the steady stream of lies and misinformation from government sources over the years, I’m naturally hesitant to believe most of what they say.
The City of London is one of two critical financial centers of the world (the other obviously being NY) and would not disappear if the UK were to leave the EU. It would continue as before, though with less interference from Brussels.
Likewise, I believe trade would be largely unaffected. There would be winners and losers, but trade is usually a mutually beneficial exercise — or, it doesn’t happen at all. Were one party to try to press unfair advantage, the other would have plenty of ammunition with which to level things out.
Why TPTB Are Freaking Out
The biggest potential risk, I believe, is in the derivatives markets. In the wake of the Great Financial Crisis, central bankers have spun an elaborate web of interlocking relationships between currencies, interest rates, debt and risk.
Rather than reduce the $1.5 quadrillion (imagine a stack of $100 bills over 1 million miles high) in derivatives exposure that nearly destroyed the financial world, they have tried to massage it into meaninglessness by permitting participants to engage in fairy tale accounting.
Demonocracy.com has some great visuals on the amount of money involved. This one shows $1 trillion, so you’d have to multiply the number of $1 trillion towers by 1,500, but you probably get the idea.
If I write a contract limiting your interest rate and currency exposure on a $500 million euro debt facility, I’m on the hook should things move against me. If I sell pieces of the this contract to 50 different banks and insurance companies, they’re technically on the hook, too.
Yet, I’m allowed to say that I have no exposure simply by pointing out that I have other positions that offset my risk. This is called netting. And, it completely ignores the risk that my other positions might not fully offset the risk, as well as the risk that any number of the participants in the daisy chain of obligations might go belly up as did Lehman, Bear Stears and AIG a few years back.
Many other banks and investment banks would have followed them into oblivion had not TPTB decided to let them utilize fairy tale accounting. The government officials, bankers and billionaires arguing that the Brexit could be disastrous for global finance know all about the risk. In fact, they’re deeply familiar with them.
This past November, I updated the biggest banks’ Wipeout Ratios. As the table below shows, a mere 0.25% decline in the value of their derivative portfolios would wipe out the Tier 1 Capital of JPM, C, GS and BAC. Is it possible that a 0.25% decline might occur in the wake of a Brexit?
 The Bureau of International Settlements sure seems to think so — unless you believe the timing of the all hands on deck meeting scheduled for Jul 23-28 in Basel is a coincidence.
Let’s take a look at some of the key currencies and indices that might be affected by a potential Brexit, and why TPTB cannot afford for the referendum results to stand.
The first currency that comes to mind, of course, is the British pound. In euro terms, the EURGBP, it has followed some fairly well-formed patterns.
Note that the EURGBP represents the amount of pounds sterling it takes to buy one euro. So, as the value increases, it represents an increase in the amount of pounds it takes, a relative weakness in GBP. As the value decreases, it represents a relative strength in GBP.
In general, EURGBP has maintained an inverse relationship to the S&P 500 — meaning that EURGBP strength (GBP weakness) has been negative for stocks, and vice versa. To put it another way, a strong GBP is good for stocks, and a weak GBP (rising EURGBP) is bad for stocks. The rising white channel, in general, represents a gradual decrease in the value of the GBP relative to the euro, while the falling purple channel represents a gradual increase in its value.
The chart above shows six distinct periods of valuation shifts.
(1) From the advent of the euro until May 2000, the GBP strengthened relative to the EUR. Note that SPX topped out two months prior in Mar 2000.
(2) For the most part, the EURGBP recovered while stocks plummeted.
(3) While SPX climbed from its 2002 lows to its 2007 highs, EURGBP went mostly sideways.
(4) As stocks plunged again, EURGBP spiked higher, topping out 3 months before SPX bottomed in Mar 2009.
(5) As SPX recovered from its 2009 lows, EURGBP began a slow, steady decline to the bottom of the white channel.
(6) EURGBP began a sharp rise again in Jul 2015, rebounding about 1/3 of the way back to the top of the channel. EURGBP bottomed out on Jul 17, 2015, when SPX closed at 2126 — just 8 points shy of its new all-time high set on May 20, 2015. Over the next five weeks, while EURGBP bounced off the channel bottom, SPX shed 12.2%.
What Does it All Mean?
By now, two conclusions should be patently obvious. First, a sudden devaluation in the GBP could do a great deal of damage to stocks. We can argue sovereignty and national pride all day long, but this is the relationship that has TPTB’s knickers in a bunch. It’s also why you’ll find few cabbies or maids warning about the dangers of a Brexit.
The other conclusion one should draw is that the latest bounce off the white channel bottom hasn’t produced much of a decline in stocks. The first two in 2000 and 2007 produced crashes of 51% and 58% respectively. By contrast, SPX is currently trading 2% below its all-time highs. We’ve had plenty of days with 2% rallies this year, so SPX is conceivably only one good headline away from new all-time highs. What gives?
First, it wasn’t as though the past year has been happy and carefree. Each time EURGBP bounced off the channel bottom, SPX tumbled about 12-14%. If there hadn’t been huge bounces after each, SPX would be about halfway to a 50%+ decline instead.
The huge bounces, you ask? Each were produced by algo-fueled recoveries in USDJPY and CL — the prices of which were propped up by our old friends: the central bankers. The first involved a 6.2% bounce in USDJPY and 35% bounce in CL. The second was almost entirely the result of a near doubling (98%) in the price of CL since Feb 11.
 I’ve written about the manipulation of stocks using CL and USDJPY countless times, so there’s no point in rehashing it here. Suffice it to say that CL is likely nearing its upper bound. It’s producing actual inflation, an inconvenient truth for central bankers trying to sell us on the need to continue ZIRP and NIRP.
USDJPY, on the other hand, has fallen so far since Jun 2015 that it could drive stocks to new highs simply by recovering some of those losses.  To be sure, a little extra pain at the pump (for the have-nots) is NOT going to stand between TPTB and their inflated balance sheets. If EURGBP starts screaming higher and stocks start plunging, don’t be surprised to see CL pushing higher. I have a 54.76 upside target that could easily come into play if the Brexit happens.
Likewise, the BoJ has a long and distinguished history of throwing its citizens under the bus when necessary to prop up stocks [see: The Yen Carry Trade Explained.] Their need is a little more pressing, in fact, since they have borrowed trillions of yen in order to “invest” in global equities. The USDJPY recently bounced at an important Fib level, and there’s very little in the way of overhead resistance.
Given all the above, what can we expect if the “Leave” camp prevails? Destruction, or something a little less dramatic?
continued for members…
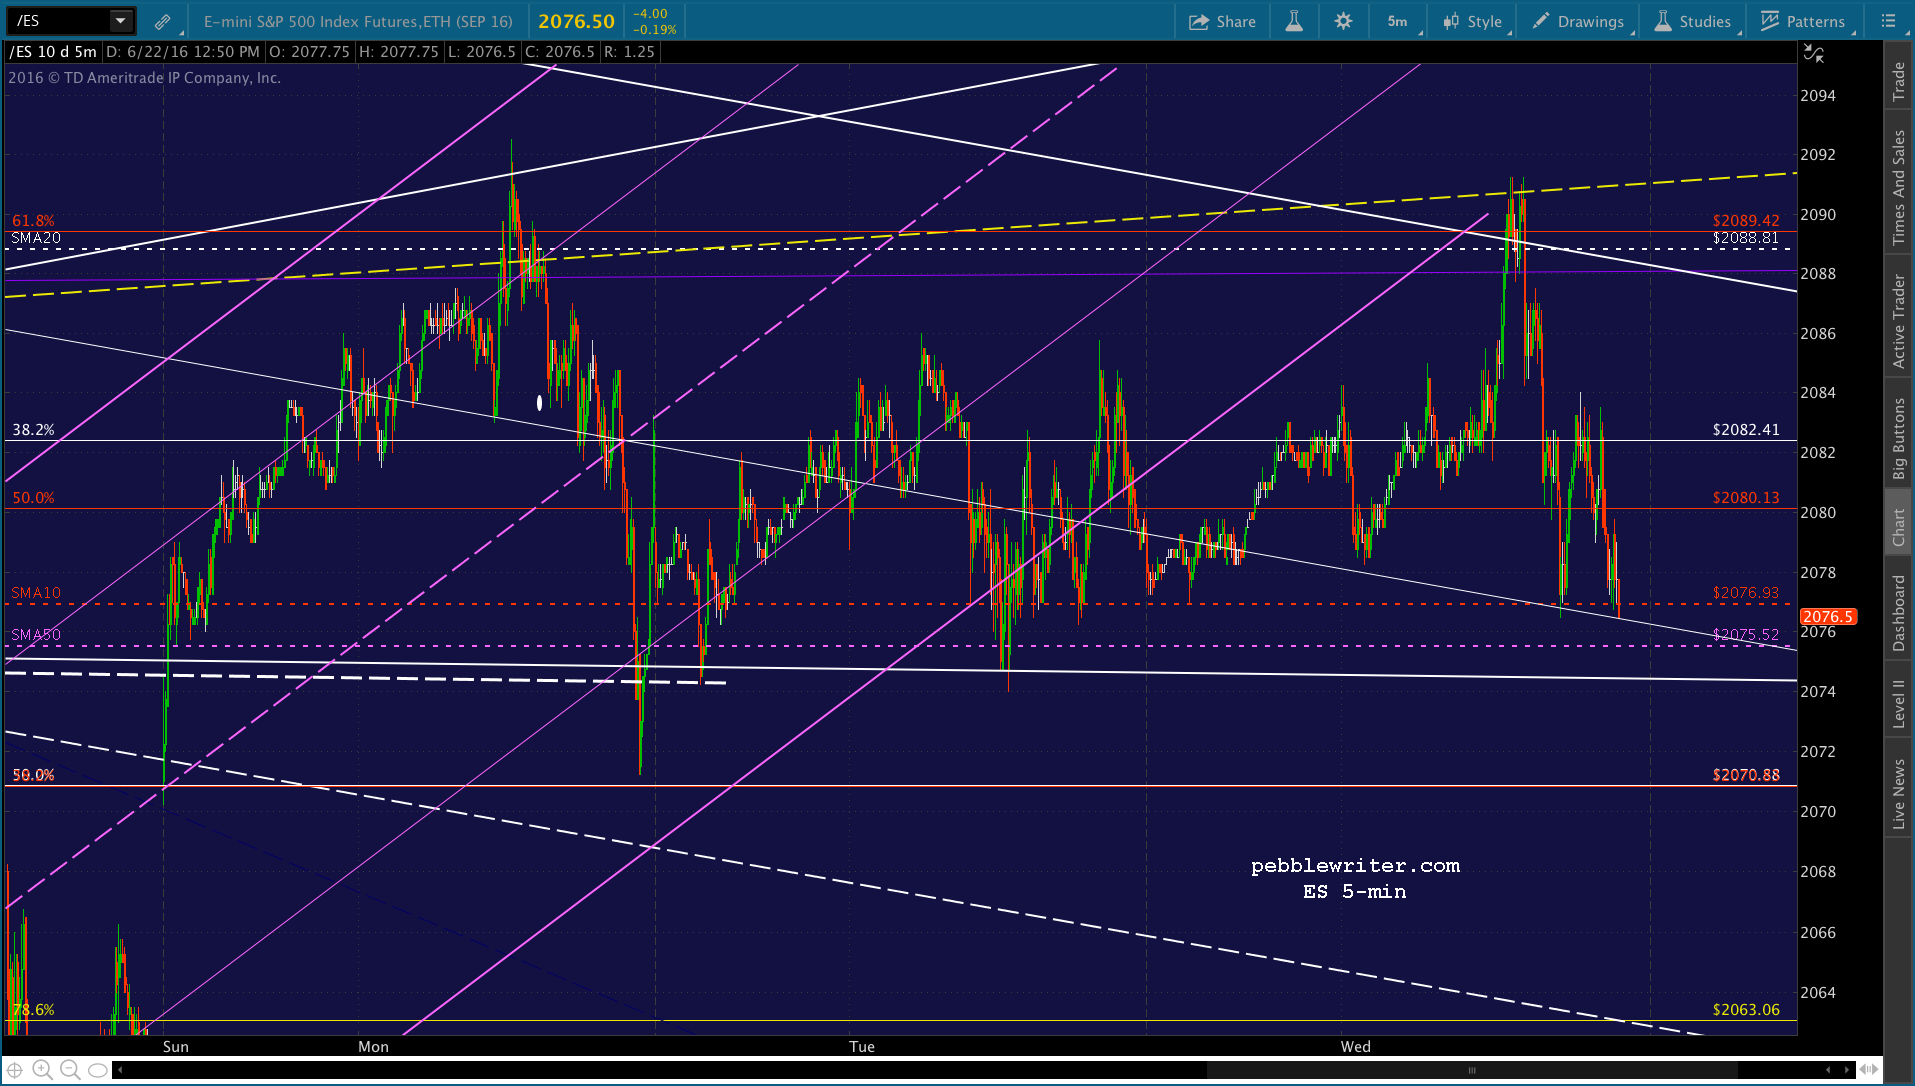
First, given how binary the situation is, charting is of little help in predicting which direction EURGBP will break. I believe there is plenty of selling pressure in the markets right now, so would want to be short over the next 36 hours if ES dips below its SMA50 at 2075.52. It’s clearly been propped up there for the past several days.
 Charting can, however, give us an idea of where EURGBP might go in the even it breaks out or breaks down. And, this might help us with an equity forecast.
First, let’s look at the key channels. EURGBP bounced off the bottom of the large, rising white channel in Jul and again in Nov 2015. In Feb 2016, it pushed above the white channel’s .236 line and made it halfway to the rising white midline before being slammed back below the .236 line in May.
It stayed below just long enough to flesh out the rising red channel (May 31), at which point it bounced up to the rising red channel midline and returned to the red channel bottom. The closeup below shows that is backtesting the small, falling white channel — ordinarily a sign we get right before a breakout.
However, the fact that the pair returned to the red channel bottom rather than working its way higher within the red channel and to the top of the falling purple channel supports the idea that TPTB are trying to force it lower. Remember, a drop in EURGBP means stocks rally.
 If the red channel does break down, the first stop is likely to be the purple channel midline at .7549 (also the white .500 Fib level, the red dot.) If that doesn’t hold, then I’d look to the bottom of the small, falling white channel where it intersects the white .618 Fib level at .7415 (the white dot.)
It would be a little sloppy, as the pair already broke out of the falling white channel. To reenter it is a technical faux pas. But, these sorts of things are more and more common, now that TPTB are manipulating markets more often.
If EURGBP drops through the .618 at .7415, the next levels of support are the .786 at .7224 and the .886 at .7111.
The upside case (stocks fall) is more compelling. The nearest upside target is the purple .707 at .8262 where it intersects with the top of the falling purple channel (the purple dot.) If the pair breaks out of the purple channel, however, the intersection of the red channel top with the .786 (at .8411, the yellow dot) makes an appealing target.
If it keeps going, then the red dot up at .8599 is a very strong candidate. It marks the rising white channel midline, the purple .886, and the top of the rising red channel.
Implications for Stocks
As discussed above, if EURGBP’s rising red channel breaks down, it’ll send stocks higher. TPTB have been working diligently to get SPX back above 2134 – a mere 34 points (1.6%) above today’s high. There have been several opportunities, but I believe they were waiting for an event big enough to: (1) justify the move, and (2) send SPX much higher than 2134.
When EURGBP broke down through the red channel midline between May 16-25, a 5.2% drop, it was good for a 70-pt (4%) increase in SPX. The 6.8% drop between Oct 13 – Nov 18 corresponded with a 13% SPX gain.
So, it stands to reason that a 3.7% drop to .7415 could trigger a rally in SPX of at least several percent — particularly since it represents a break of a year-long trend. An 8.2% drop back to the white channel bottom would likely produce gains on the order of 15% or greater. Think 2250+.
If it slides back down after the initial push, no problem. The key is to break through 2138 (the actual 1.618 extension of the drop from 1576 to 666 between 2007-2009.) Once that bogey is out of the way, every single bearish harmonic pattern in existence goes away.
If, on the other hand, EURGBP rebounds as the result of a successful Brexit campaign, we can expect a rather impressive sell off. Unlike last Fall’s sell offs, this one would presumably involve a fair amount of unraveling as the result of a fundamental change (as opposed to a temporary fluctuation) in the relationship between the two currencies.
Another 12-14% decline from today’s close would put SPX at 1793 – 1834 — near or even below Feb 2016’s lows. A summer of 2011-style sell-off would put SPX around 1650. A 2000-2002 or 2007-2009 sell off would, of course, be much more devastating.
Our big red target near the intersection of the .618 Fib line and the falling yellow channel would put SPX at 2010-2020, a modest 3.6% decline. An overshoot to test 2000 is also a good possibility. While we’re talking about SMA200s, remember that tags of this important moving average have been few and far between, this year. To be clear, SPX could stop tumbling there if it had adequate support from USDJPY and/or CL.
 I’ll play around with these figures more tomorrow, when I’m a little fresher. With fresh charts, it should be easier to illustrate various levels of support. In the meantime, it’s safe to say a big move is coming. Whether we’re on the eve of prosperity or of destruction will be revealed soon.