

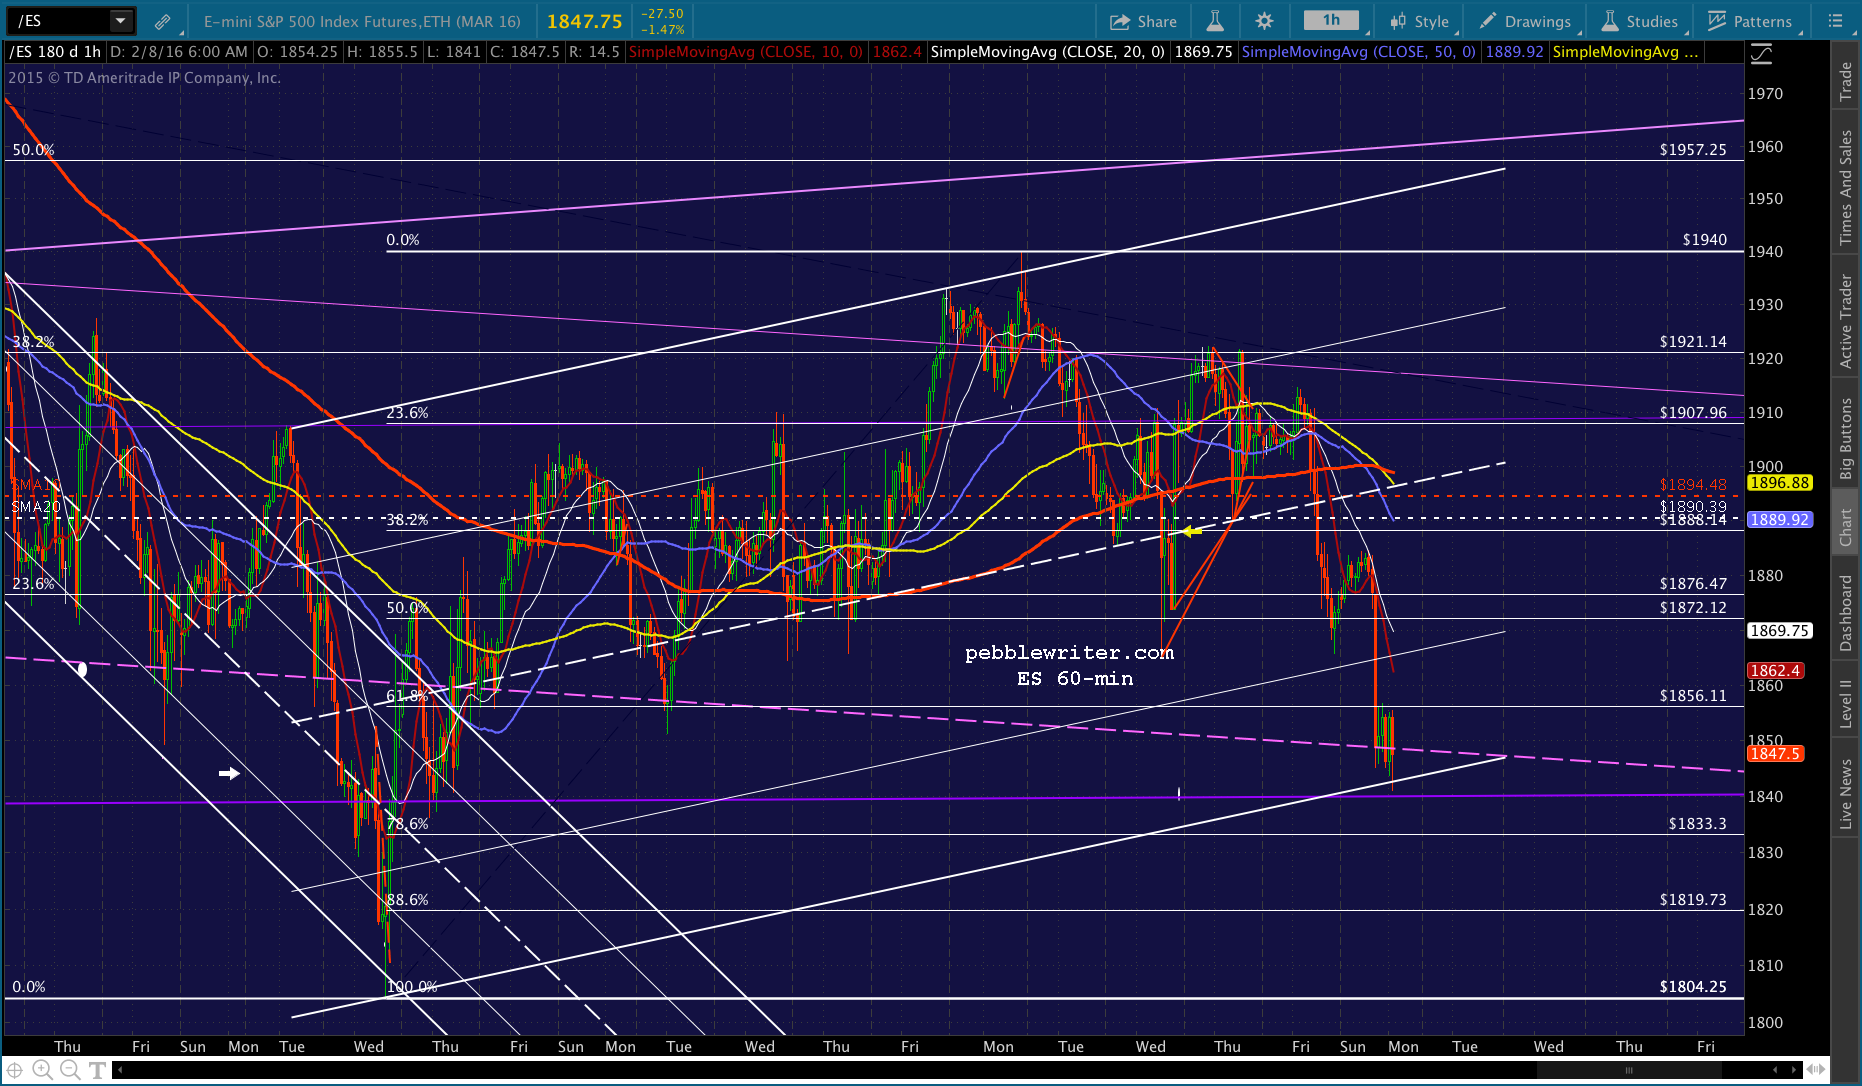
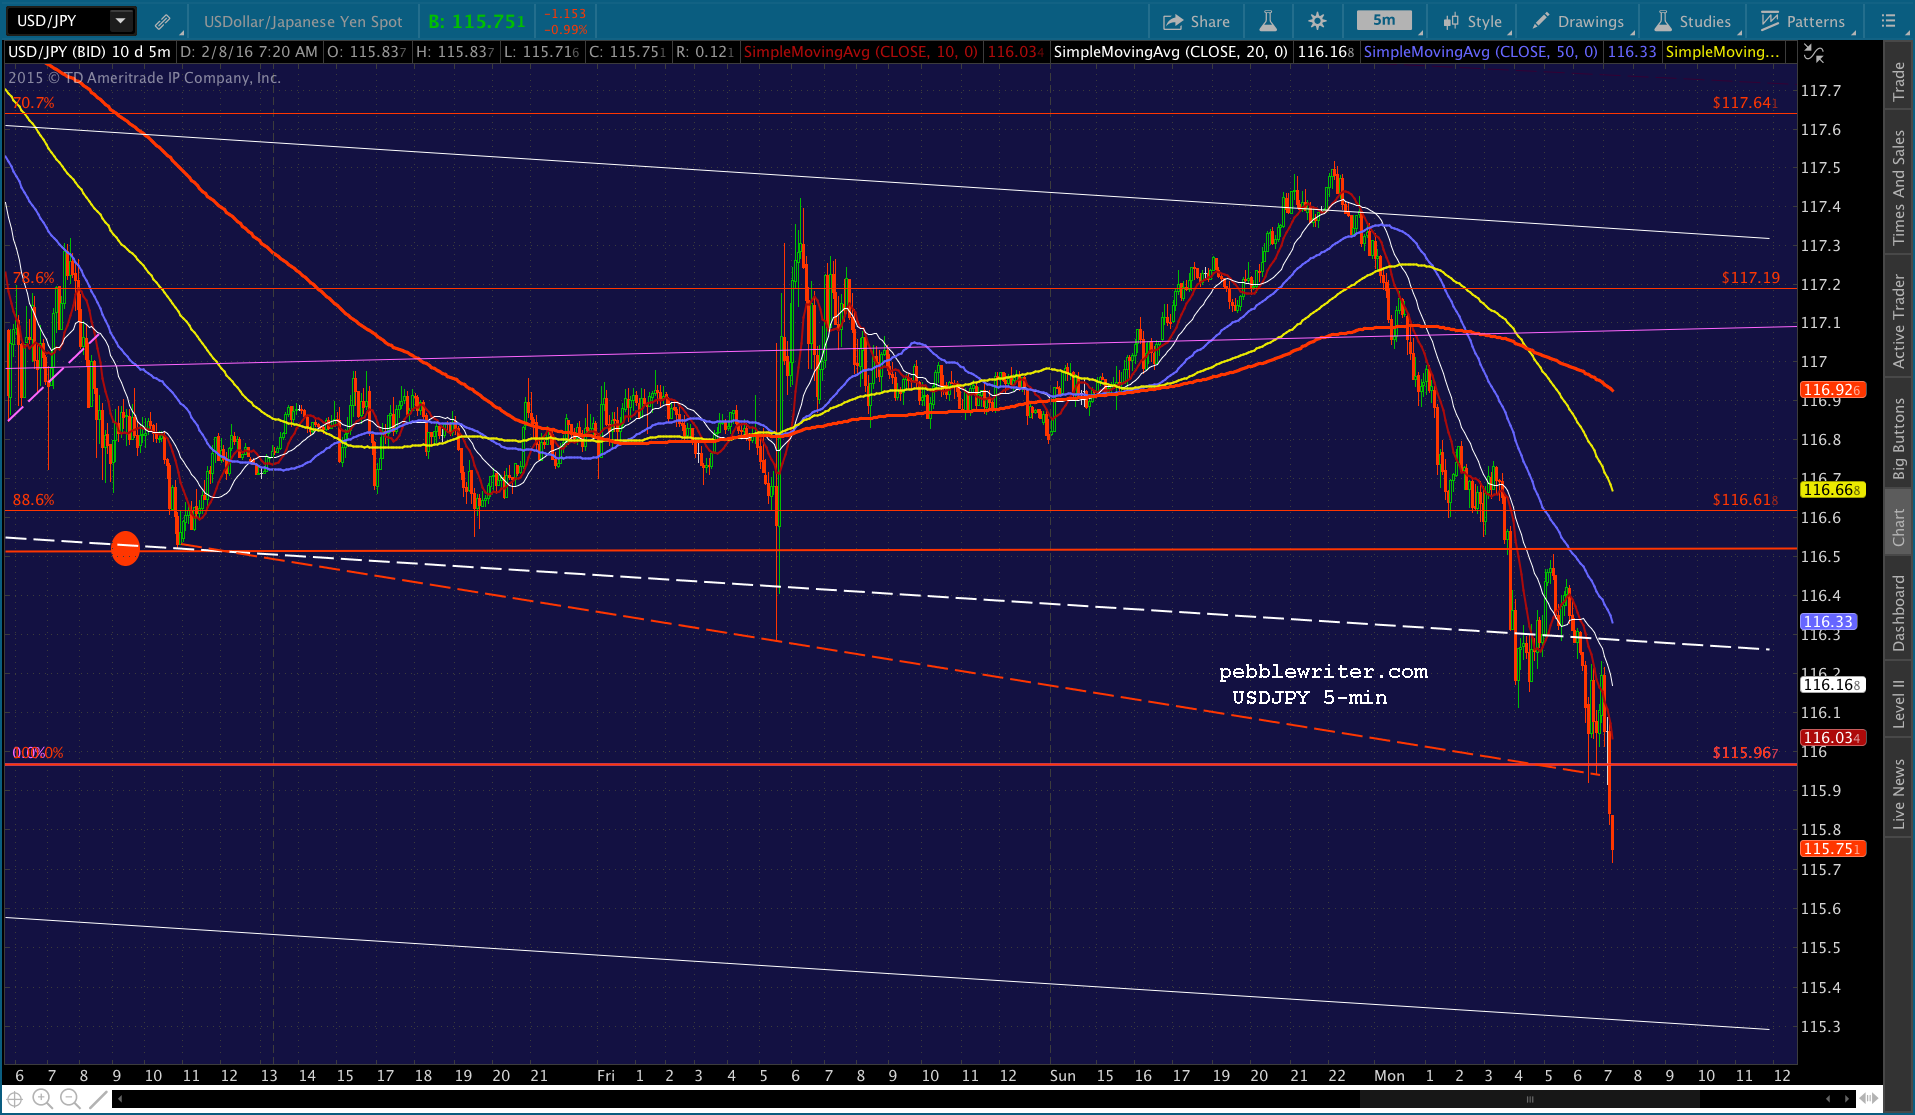
I’ve been beating the yen carry trade drum so long, I can’t remember when it didn’t matter. Today, as on Jan 20, USDJPY has dropped below the bottom of the red channel. And, stocks are not amused. S&P futures were off over 31 points overnight before attempting the latest bounce. ES has dropped 100 points since USDJPY reversed at our upside target on Jan 29 following the BoJ’s ill-fated attempt to turn things around [see: BoJ Underwhelms.] Now, as USDJPY drops through the channel bottom again, the “market’s” fate rests on whether or not the central planners will elevate the USDJPY yet again.
continued for members…
In another view, we can see the BoJ bounce, and USDJPY’s subsequent return to the falling white channel.
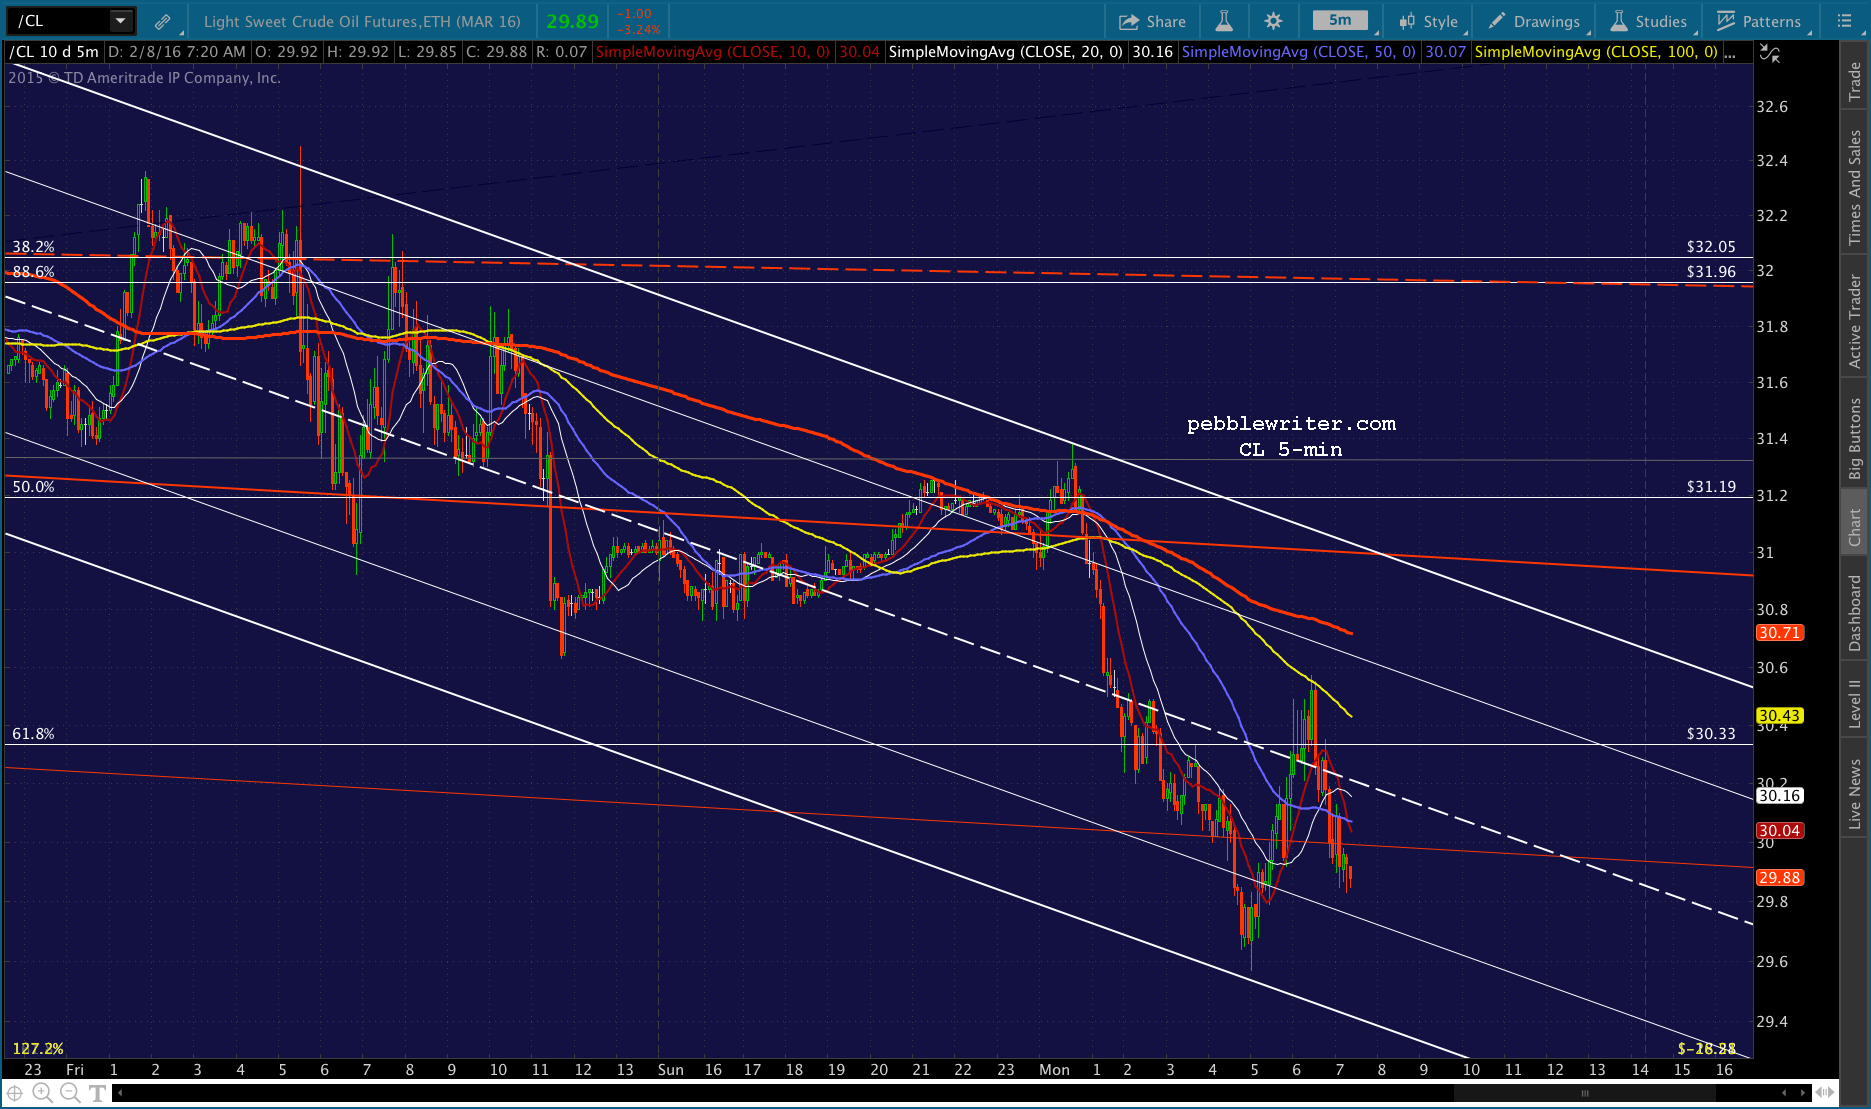
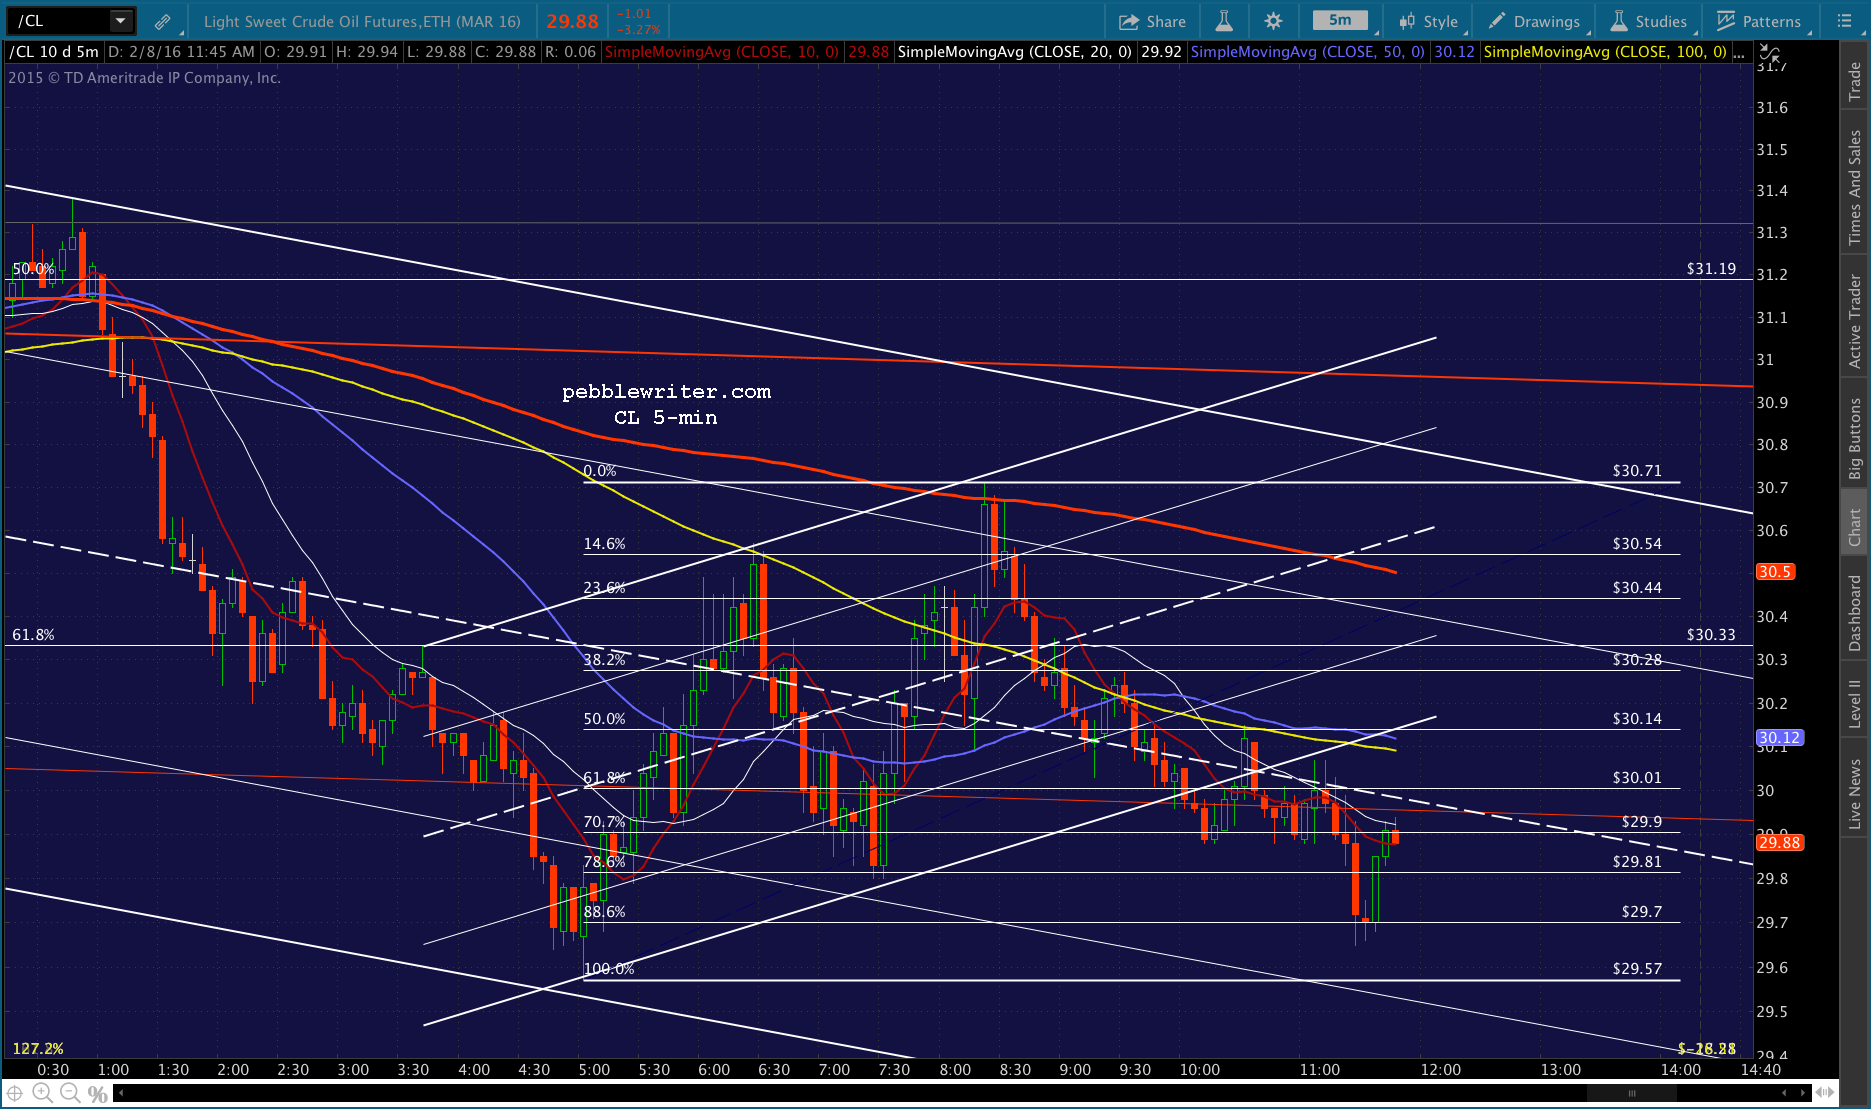
 Stocks have given up all their BoJ gains, but, as yet, have only retraced about half of their post-Jan 20 gains. Why? CL ramps have been very effective. Popping up out of the falling red channel, in particular, helped sow the seeds of a recovery. Note that CL has since dropped right back into the channel.
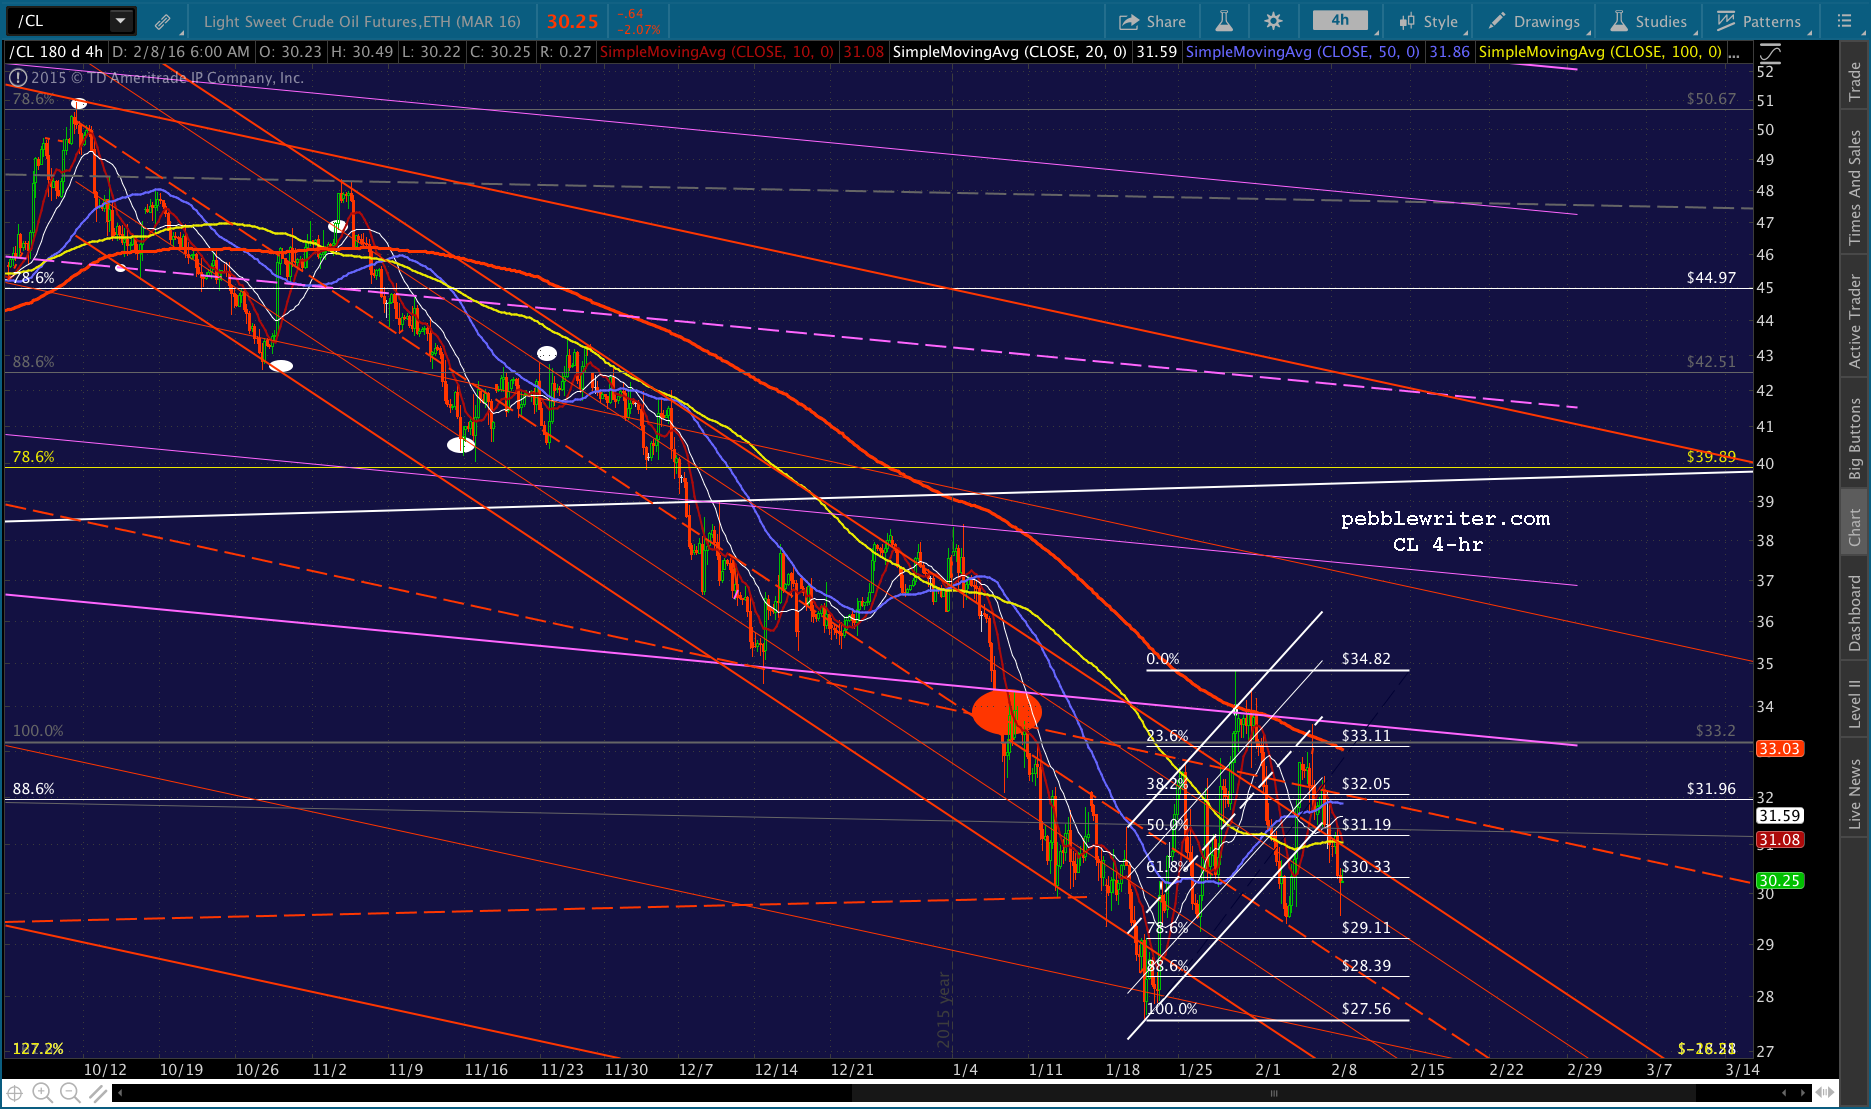 Look for this trend to continue unless USDJPY can get off the mark.
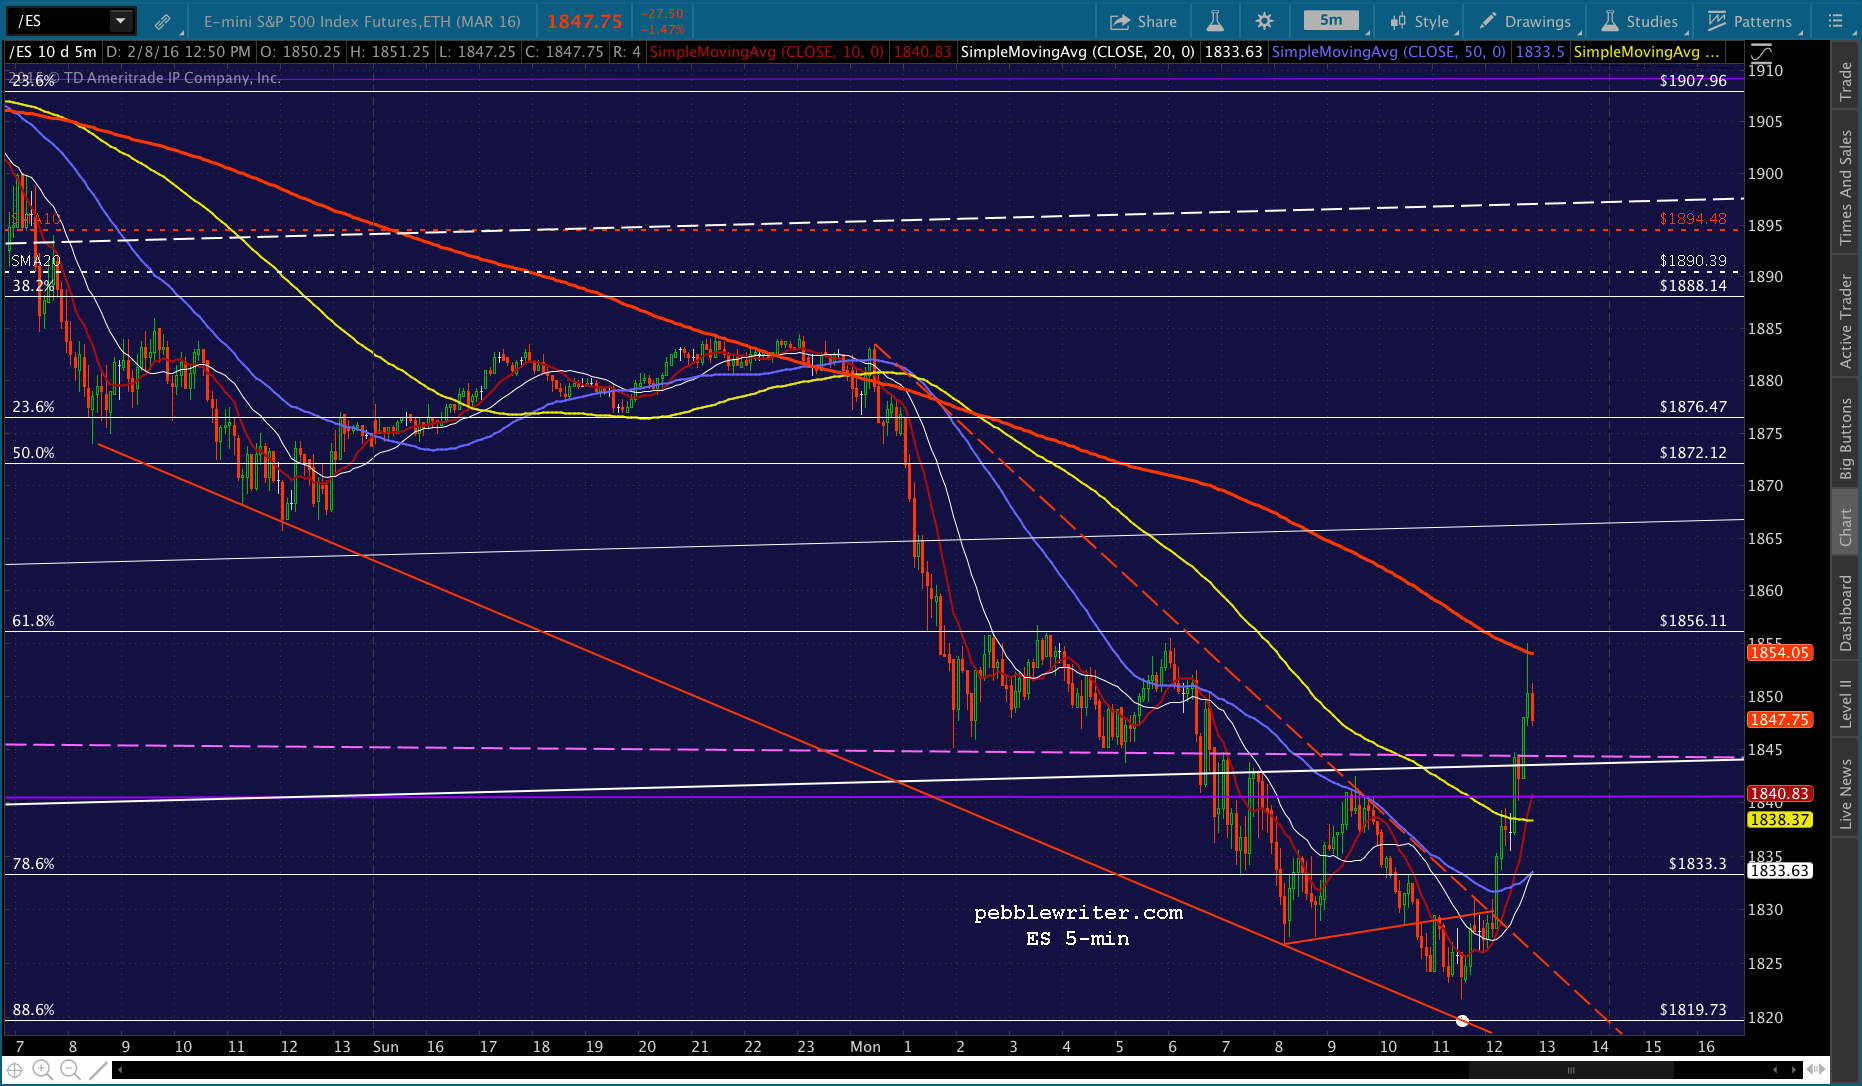
As for SPX itself, it has had numerous opportunities to complete IH&S Patterns. But, the only one that seems likely to complete at the moment is the bearish red one targeting 1797. As we pointed out Friday, SPX is back below the neckline of the much larger H&S Pattern we’ve been tracking (the purple channel bottom at the yellow arrow.) Remember, this one targets 1605. So, the onus is on the central planners to prevent it if they can.
Today, the first line of defense will be the red .618 at 1863.91, followed by the white 1.272 at 1852.44, the red .786 at 1841.26 and the red .886 at 1826.66.
UPDATE: 9:37 AM
USDJPY just dropped through the Jan 20 lows, but immediately bounced back.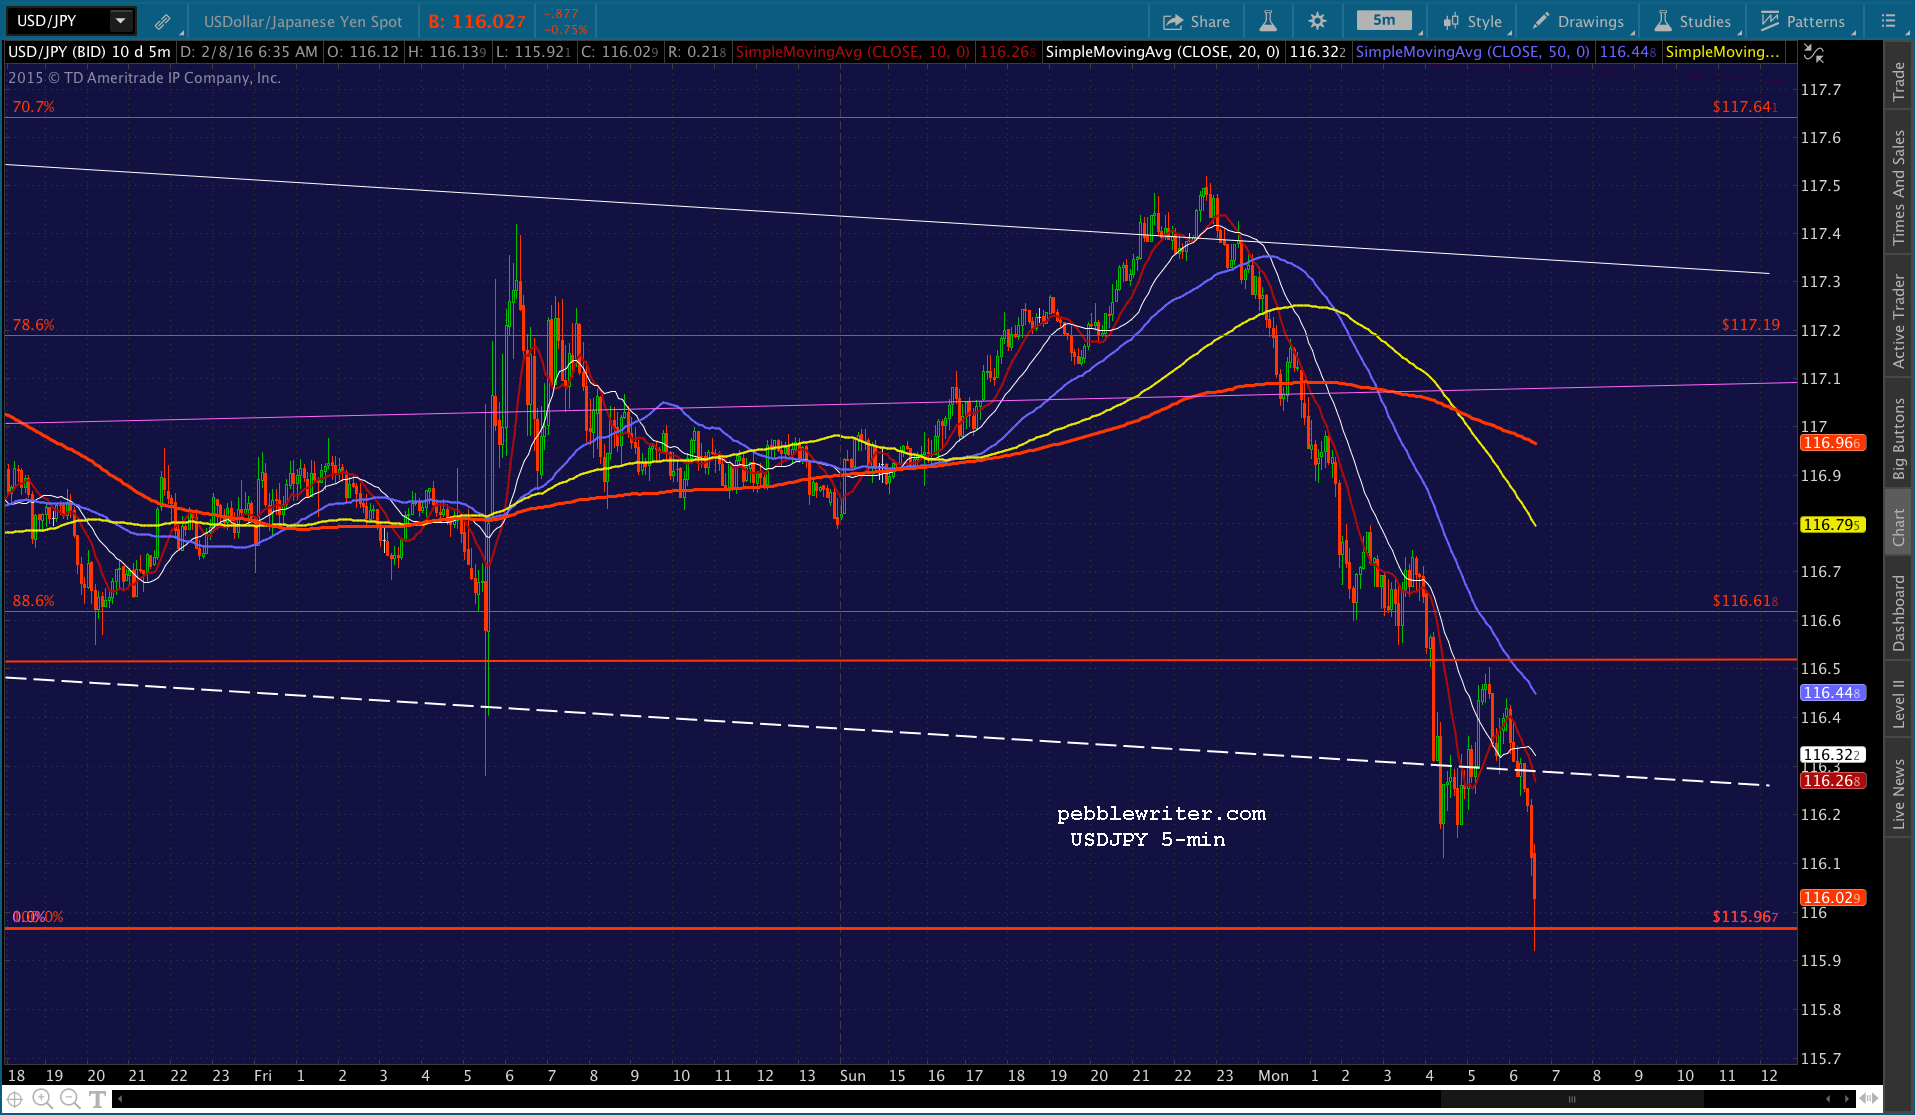 SPX is closing in on the next support at the red .786 at 1841.26.
 UPDATE: 9:41 AM
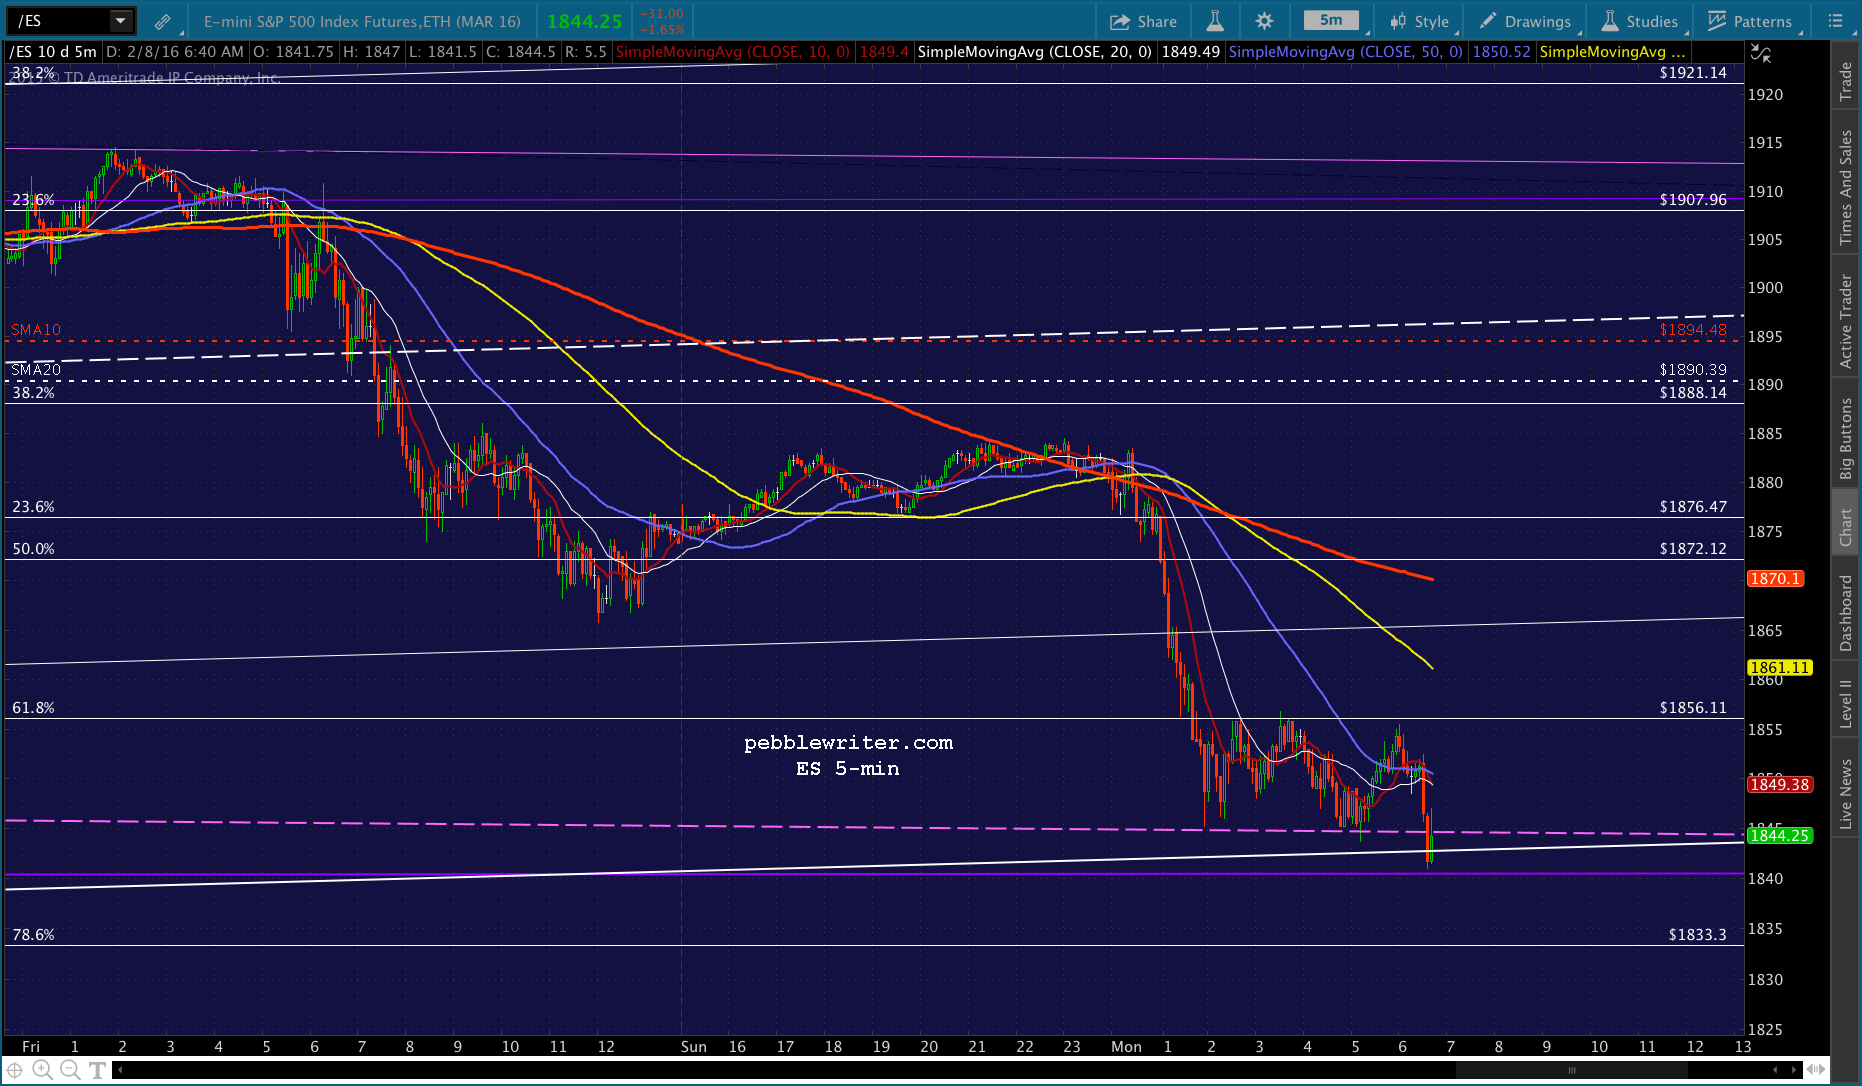
Going to cash here at 1848.73. ES just tagged its H&S neckline.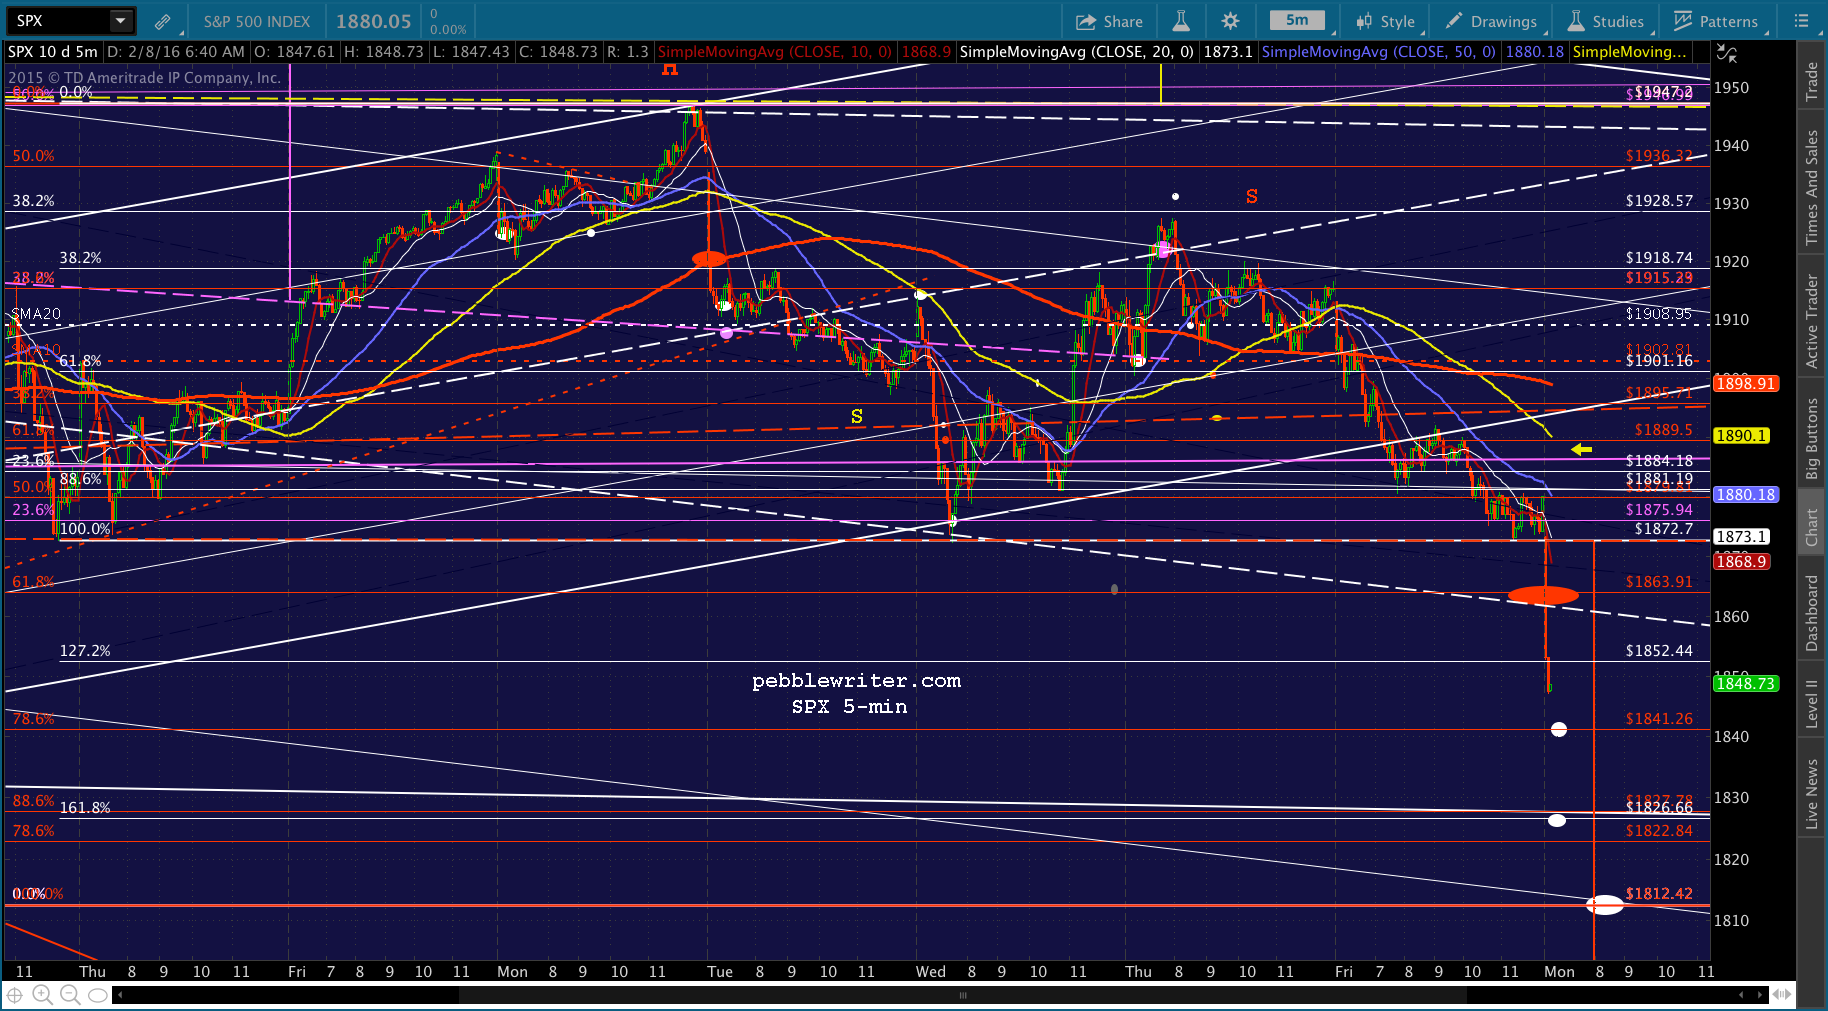
 UPDATE: 9:48 AM
Back to short at 1850.33. Hard to say whether they’ll draw a line in the sand here, as everything else is sending out bearish signals. Key for ES is around 1840.25. Might just be looking for a better bottom with some Fib significance, such as the red .786 at 1841.26. It would be a better bounce spot, perhaps up to the white channel midline to allow the SMA5 10 to catch down.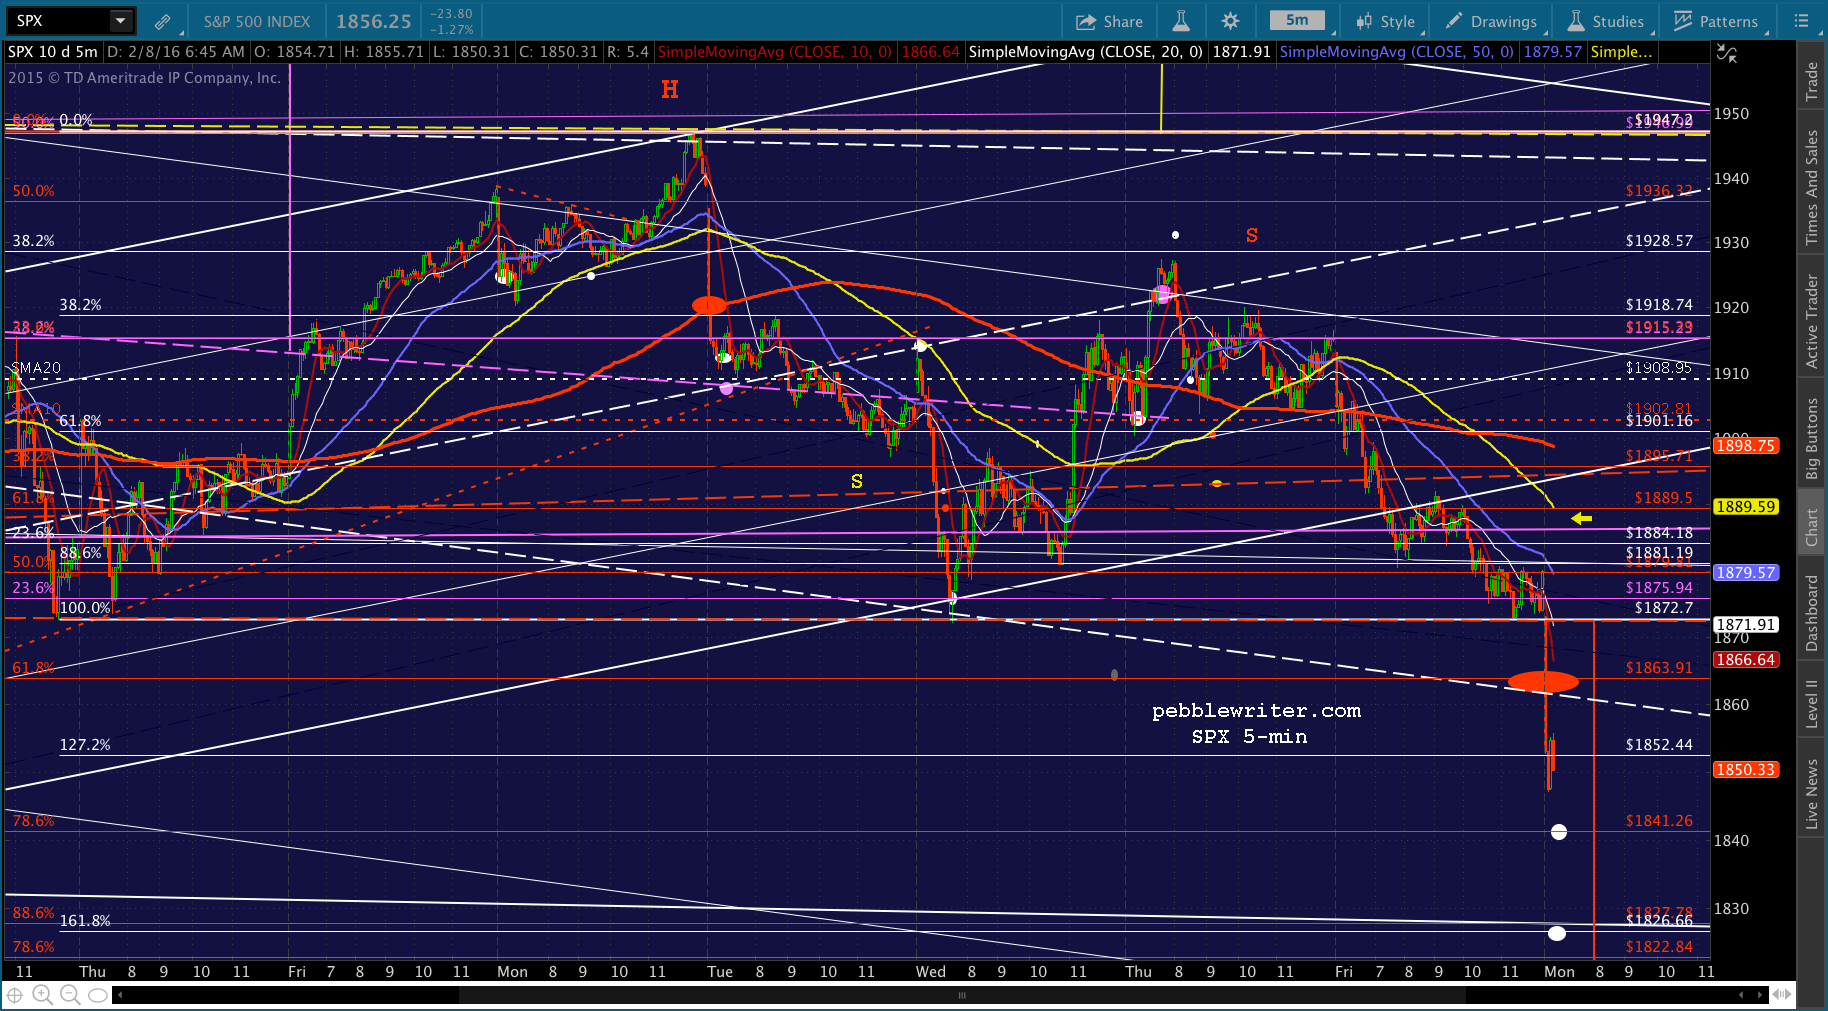 CL not helping…
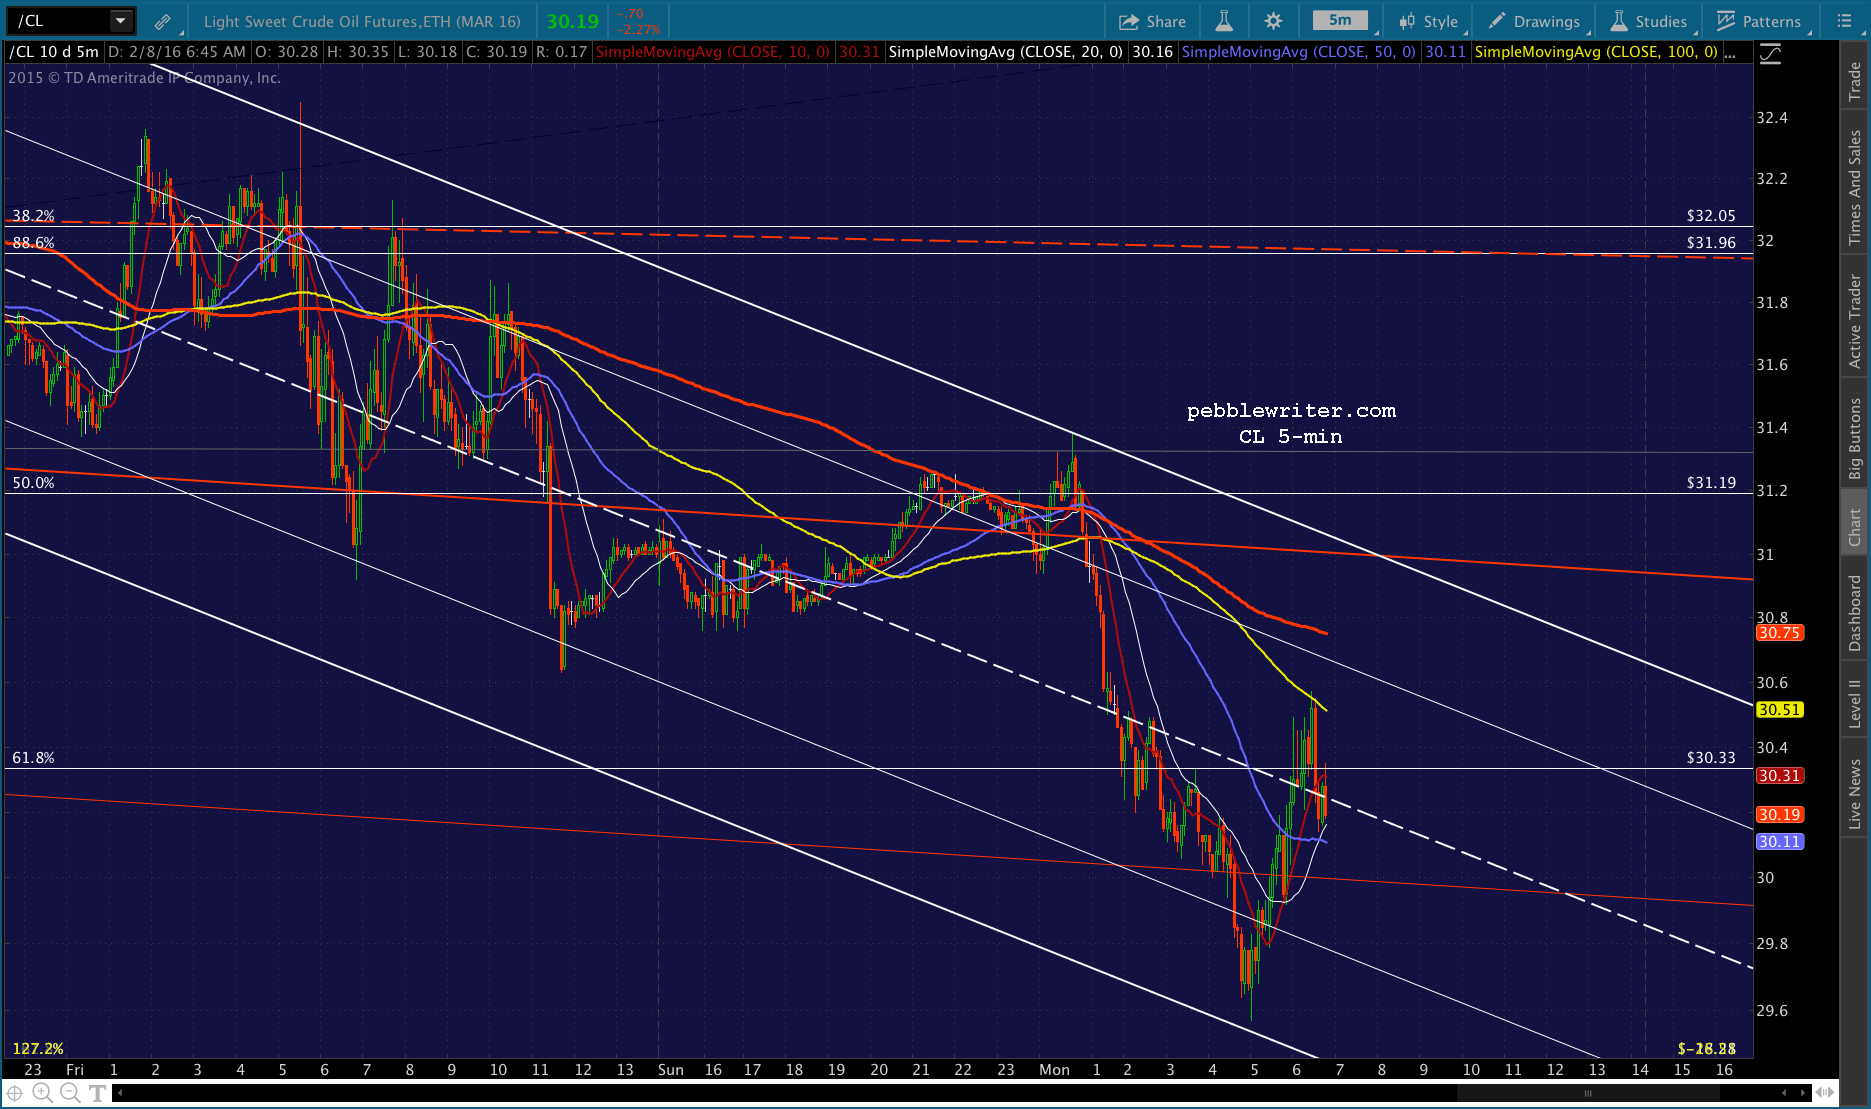 Nor is USDJPY…
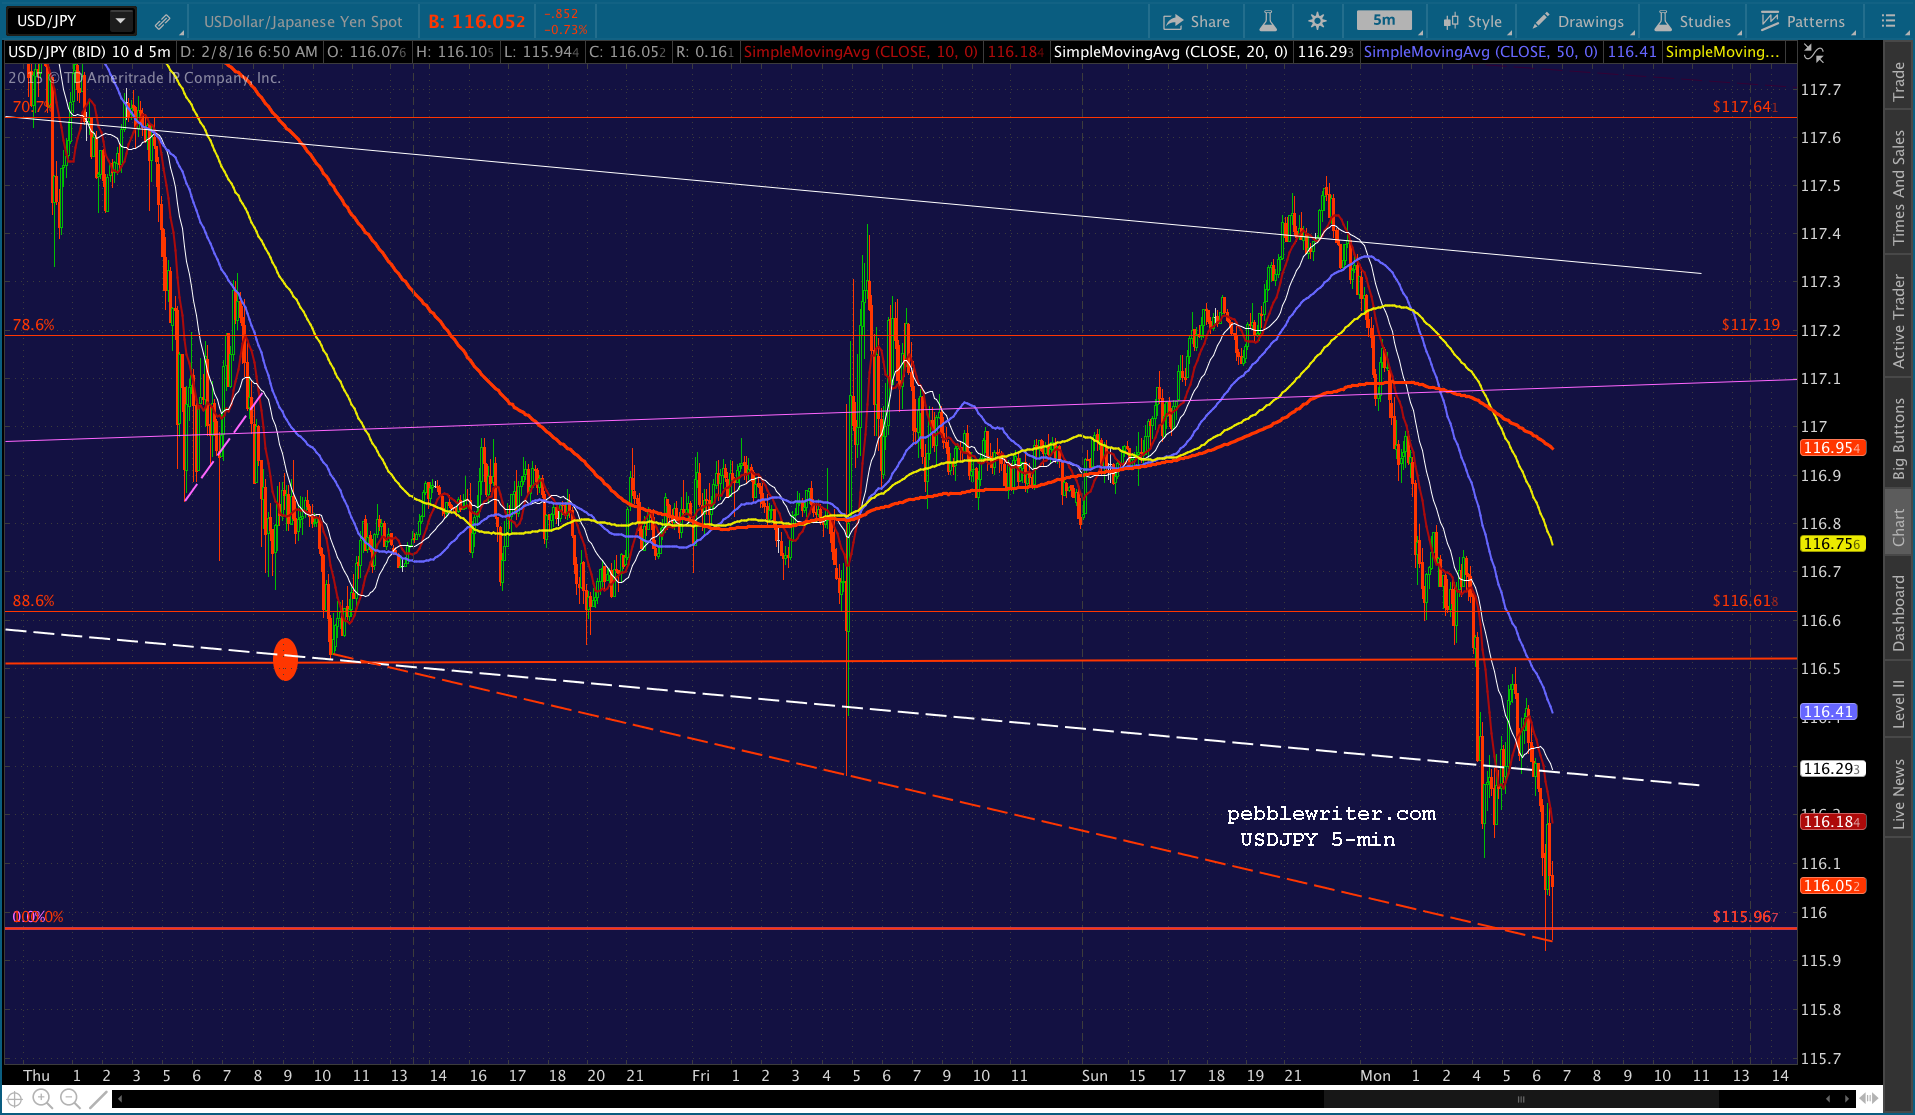 NKD just hit new lows…
 UPDATE: 10:03 AM
USDJPY putting in a big bounce. We’ll see if SPX follows its lead after tagging the .786.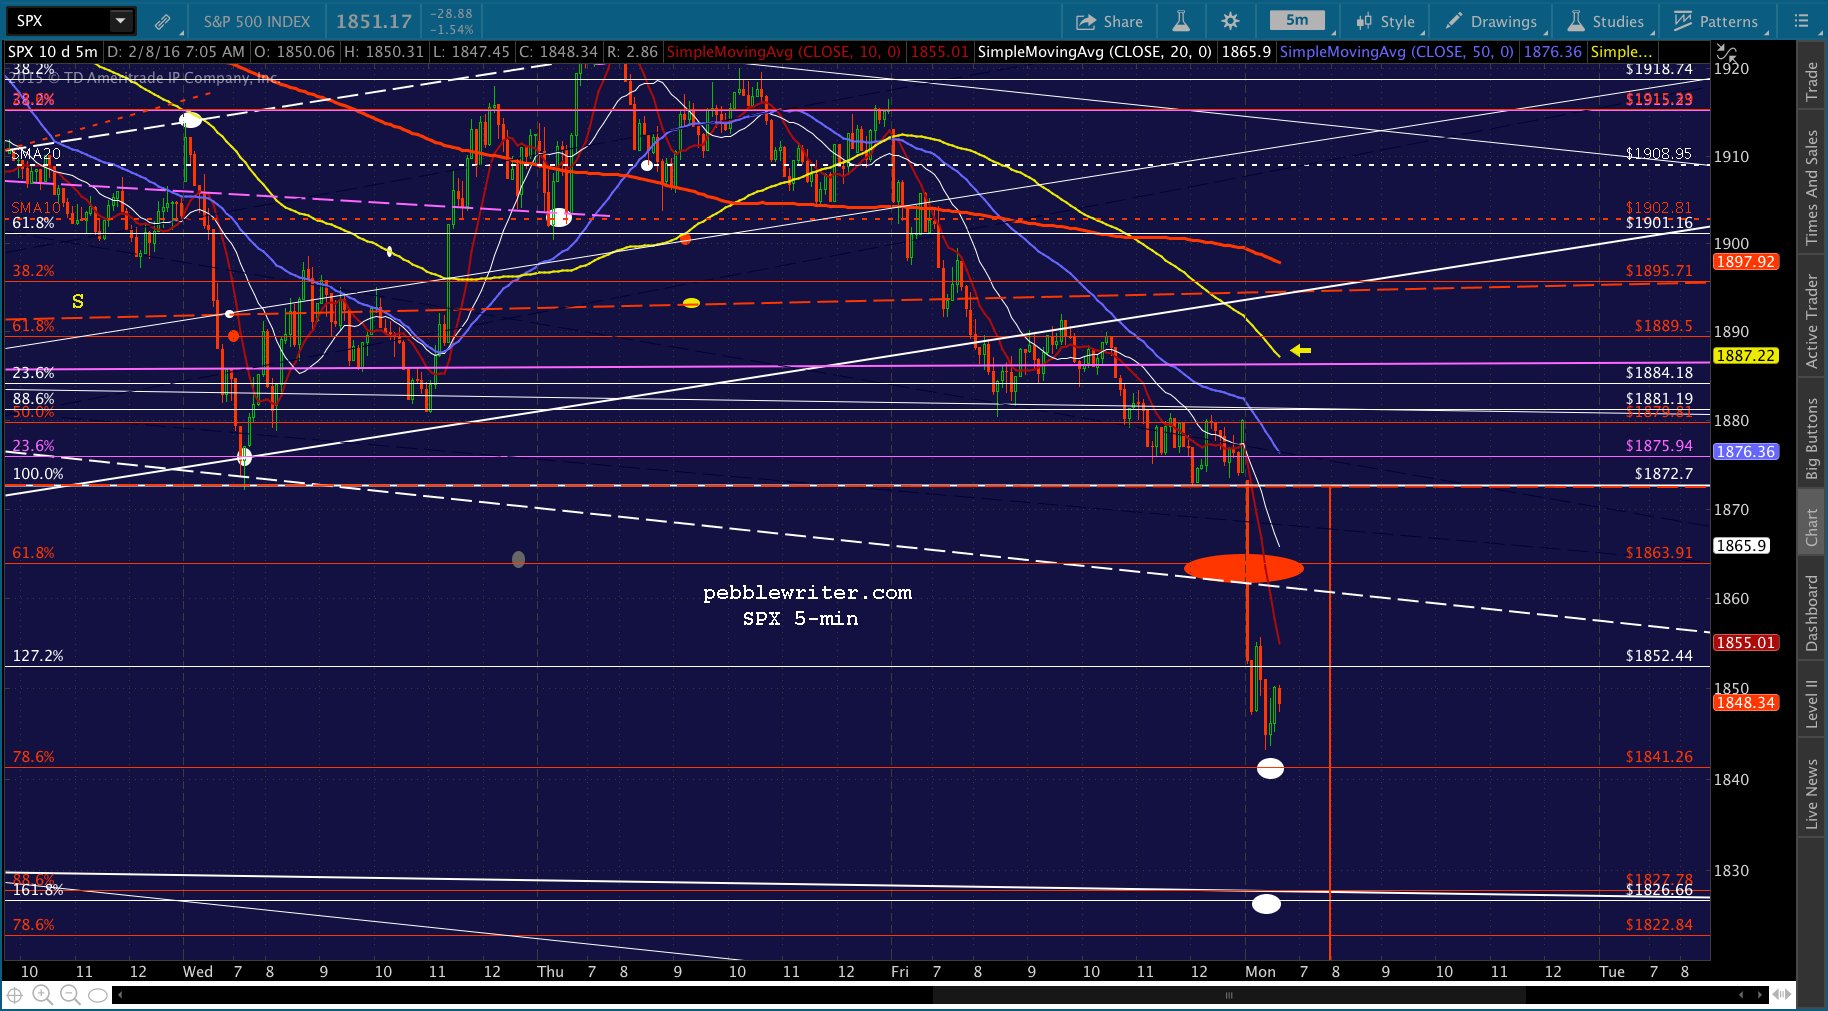
 Note that SPX and ES are out of sync in their Fibs. The ES .786 is 2 points further away than SPX, so we could well see an overshoot by SPX here or at the .886/1.618 combo, whichever is their next target. Looks like USDJPY is trying to produce a soft landing at 1841.26.
UPDATE: 10:18 AM
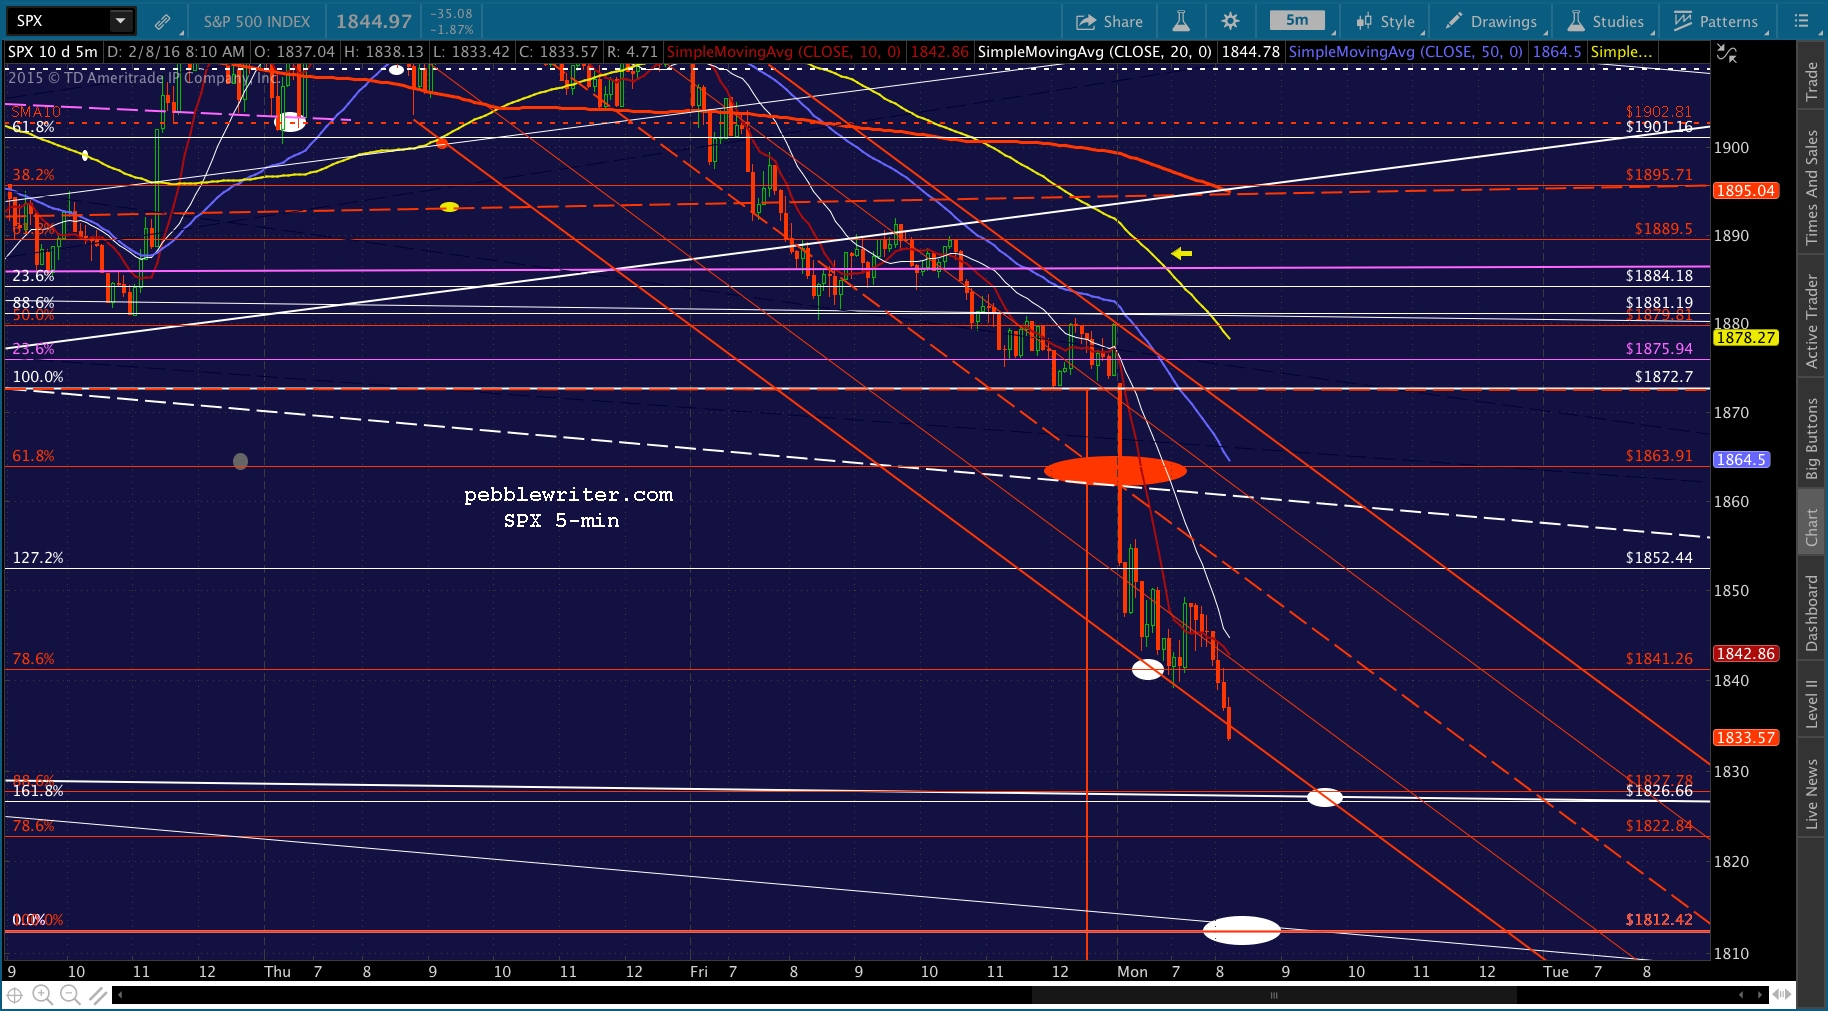
There’s the .786. USDJPY and CL still falling, so the .886 is looking more likely.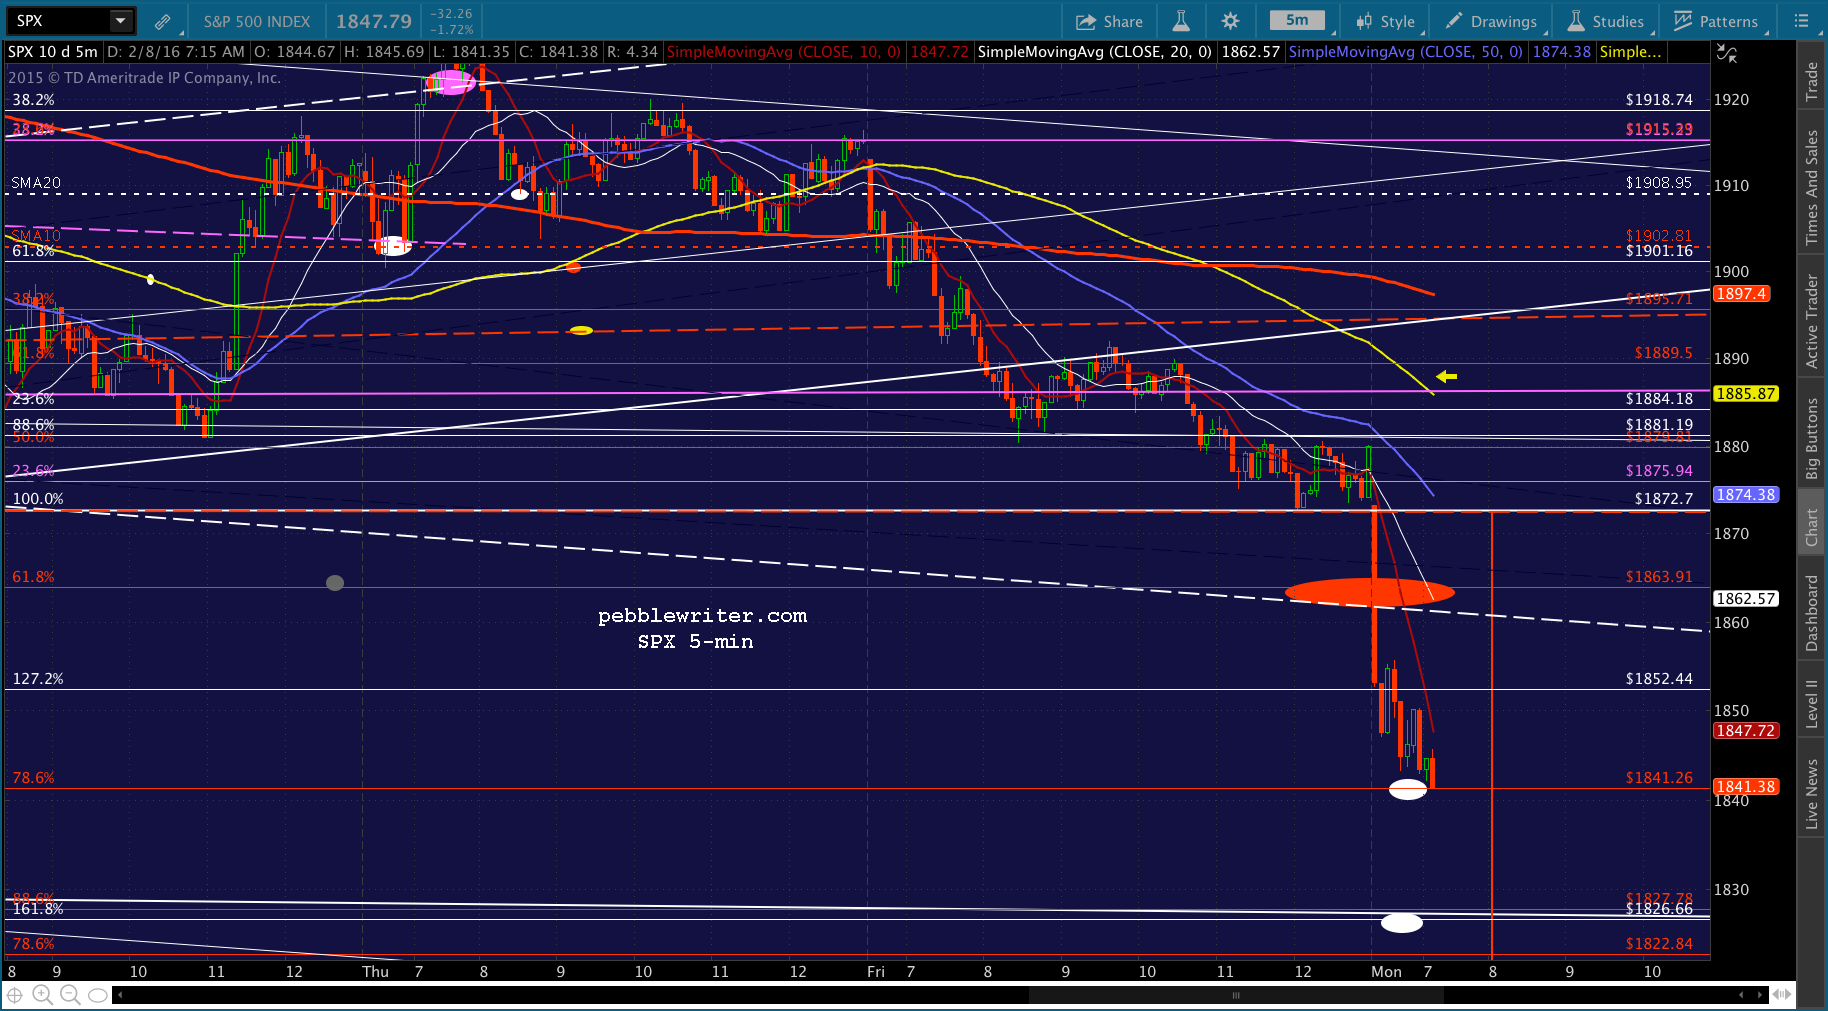
 ES just reached its .786, but USDJPY still falling…
NKD appears to be targeting the .786 at 16275. UPDATE: 10:30 AM
ES seems to be trying to hang on at 1833.3. I’d switch back to cash here until SPX makes up its mind. A dip back below 1841 and I’d get short in a hurry.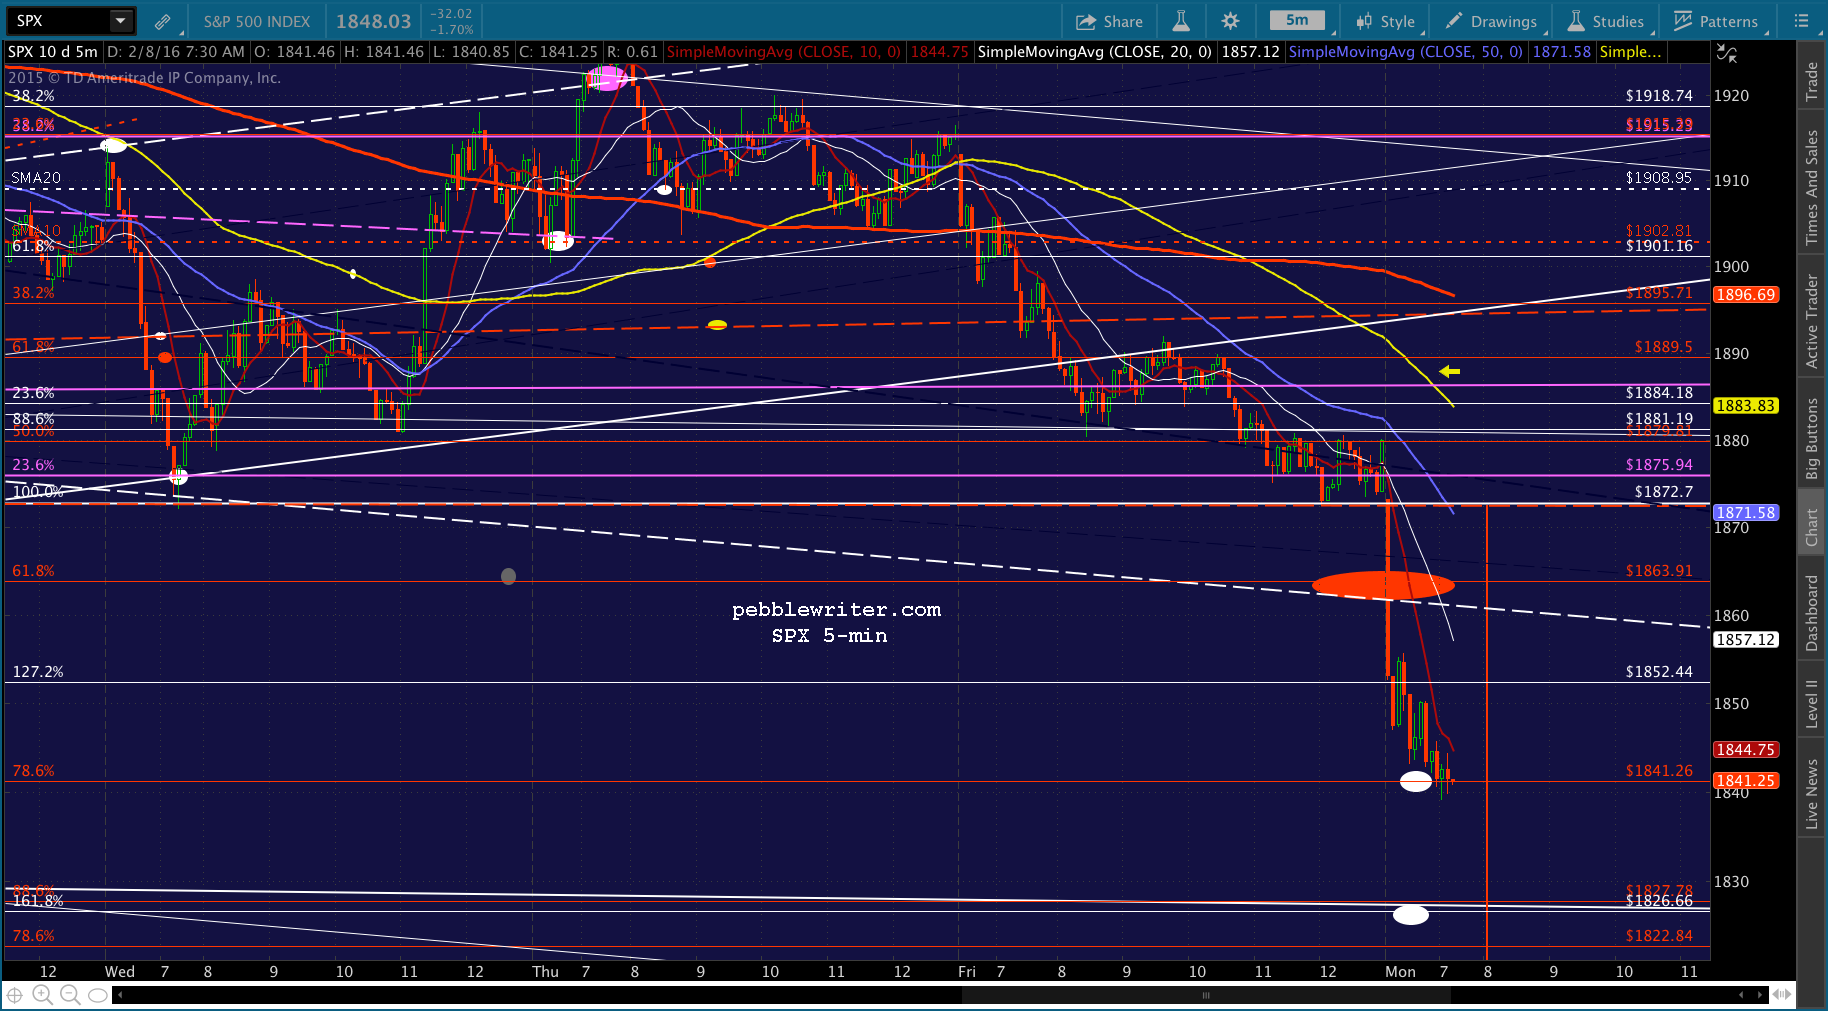 The way this has been working lately is SPX pushes up just past the SMA5 10, then uses it as support to get up to – or, at least near – the SMA5 20. At that point it continues lower IF it’s going to.
UPDATE: 10:56 AM
The SMA5 20 is looking iffy. I’d revert to short with tight stops — just in case it tries to push above the SMA5 20, too.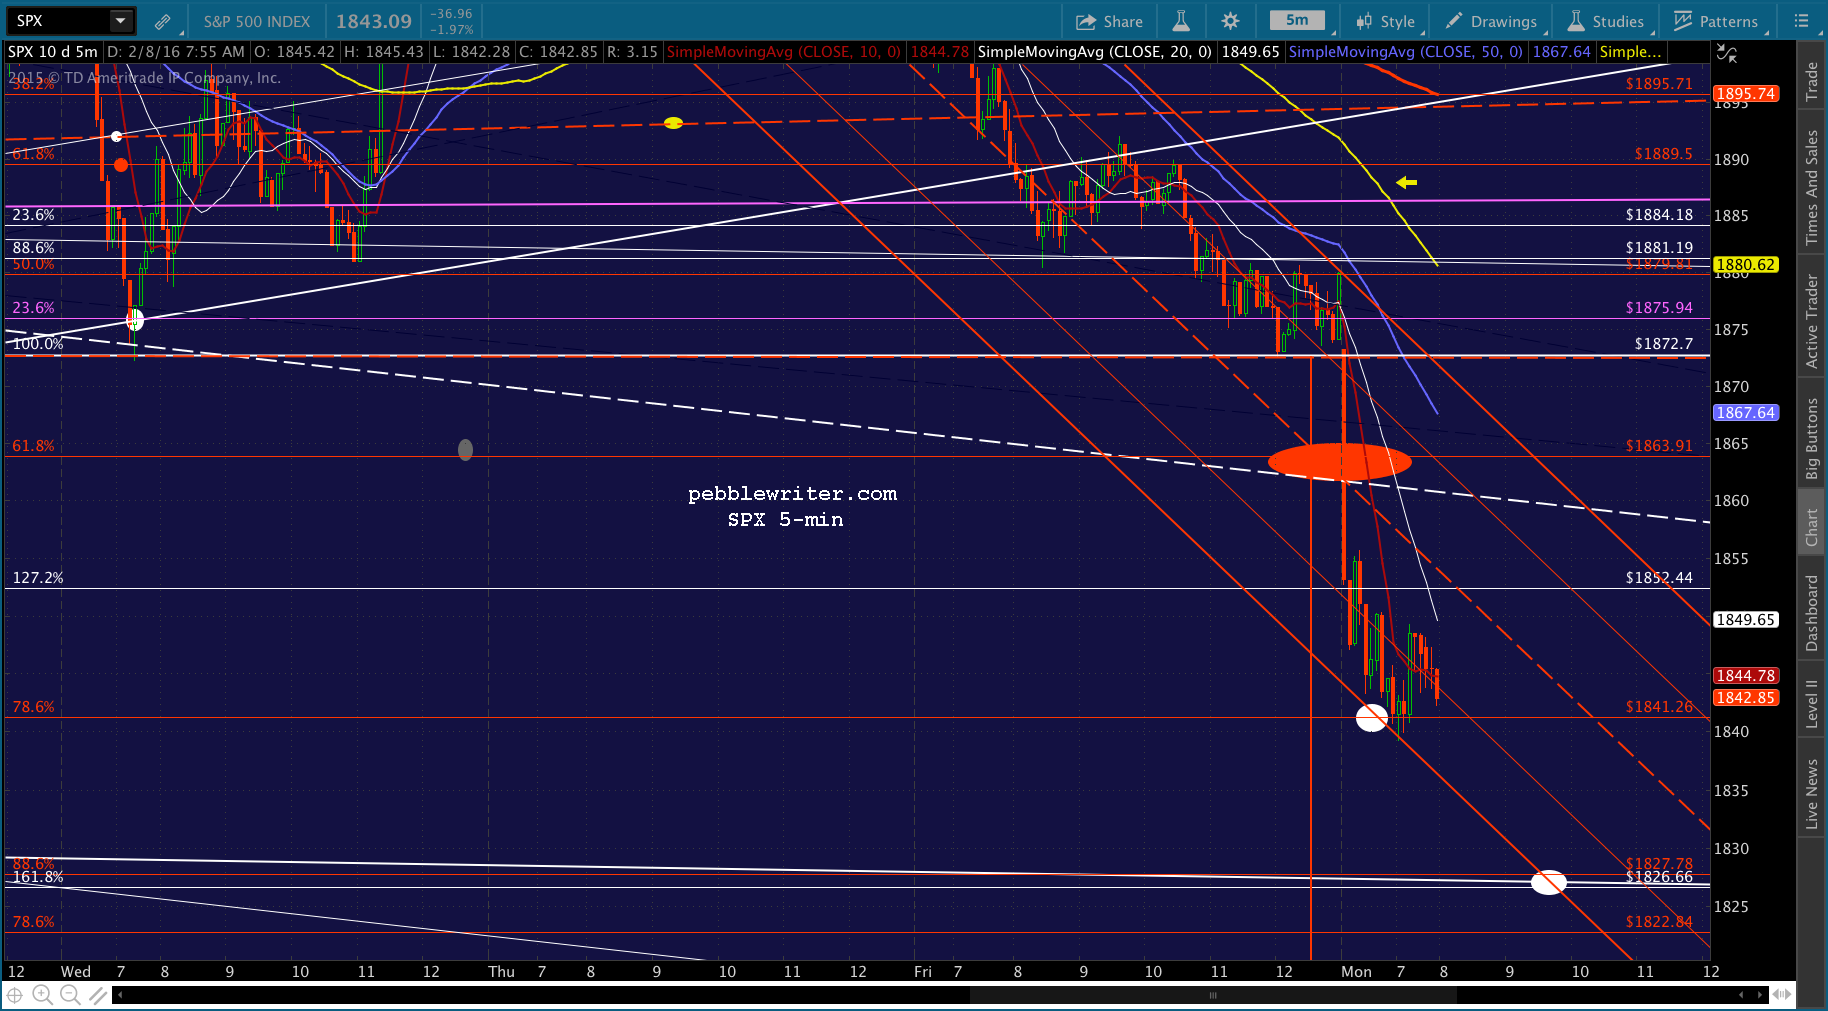 USDJPY and NKD are looking like they’re ready to drop some more.
 UPDATE: 11:14 AM
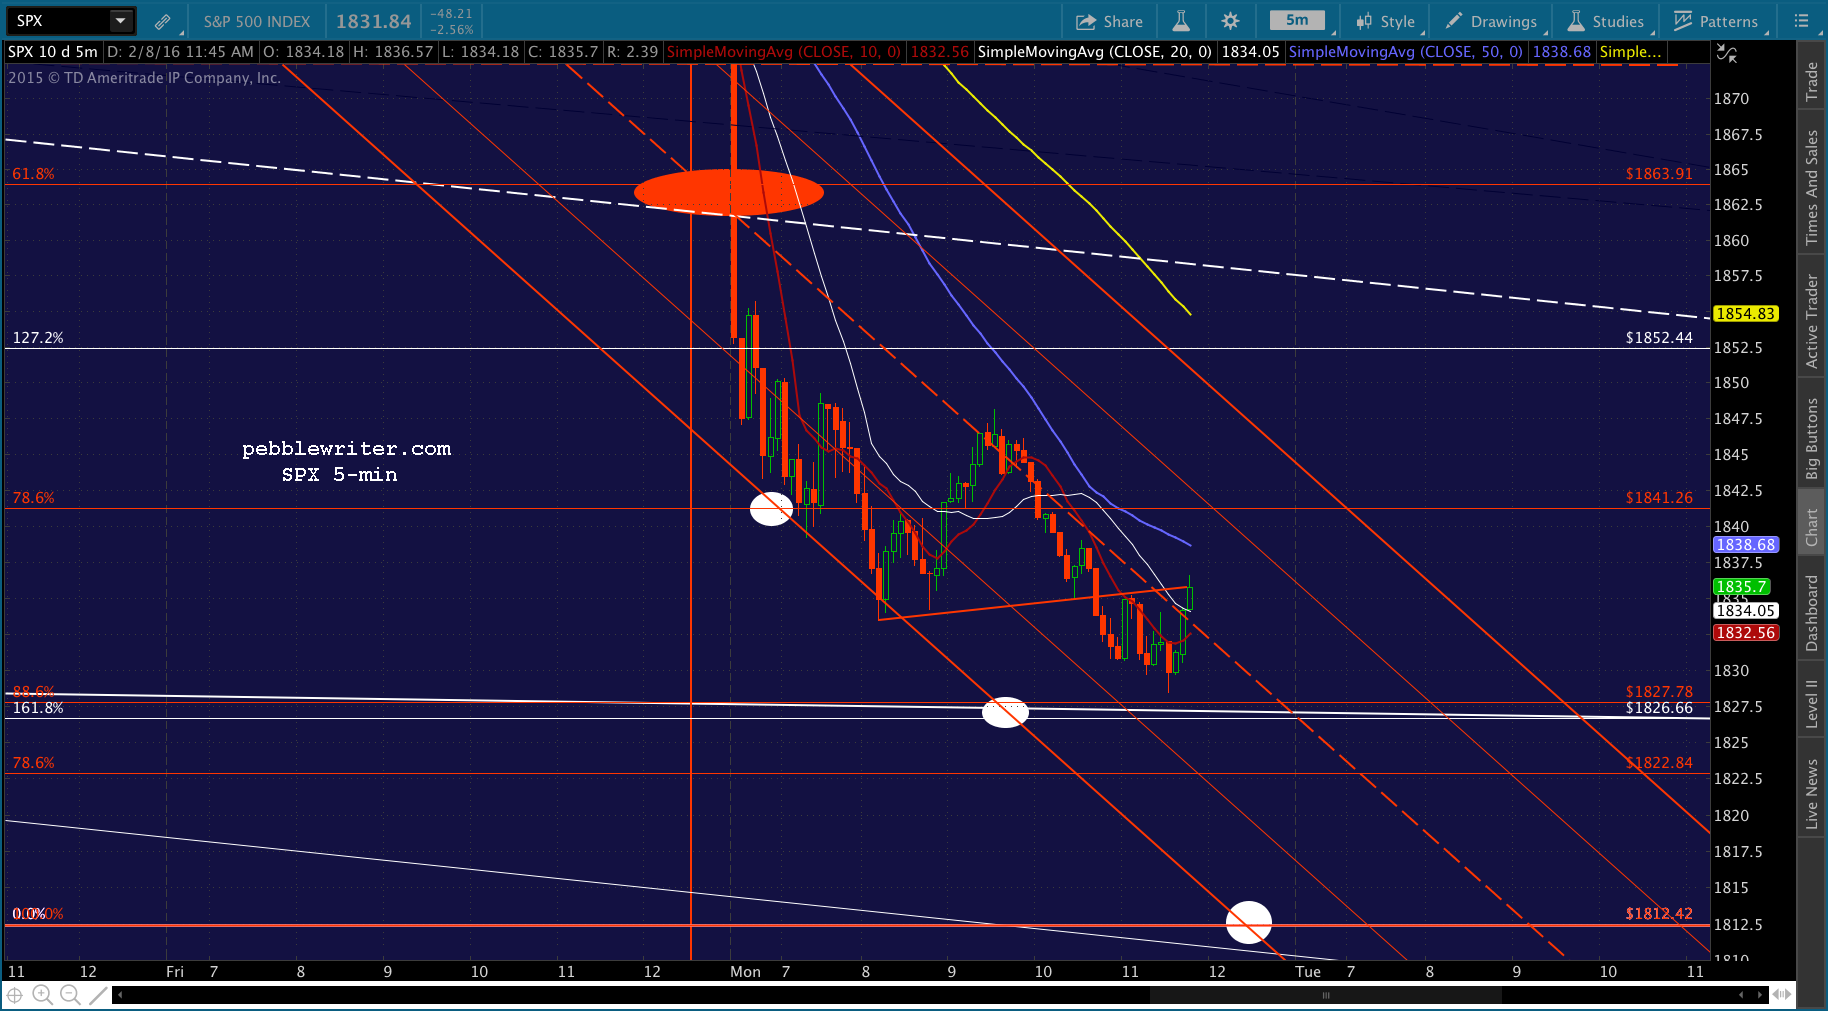
SPX reached the bottom of the falling red channel at the same time that NKD reached support. I’d play a bounce here at 1833.57 up to the red .786 at 1841.26 into the euro close. Tight stops, of course.
 UPDATE: 11:30 AM
Taking profits here at 1840.94 and reverting to short with tight stops at the SMA5 20 or so. I suspect the next stop is the 1826-1828 bundle of Fibs at around 12:35ish.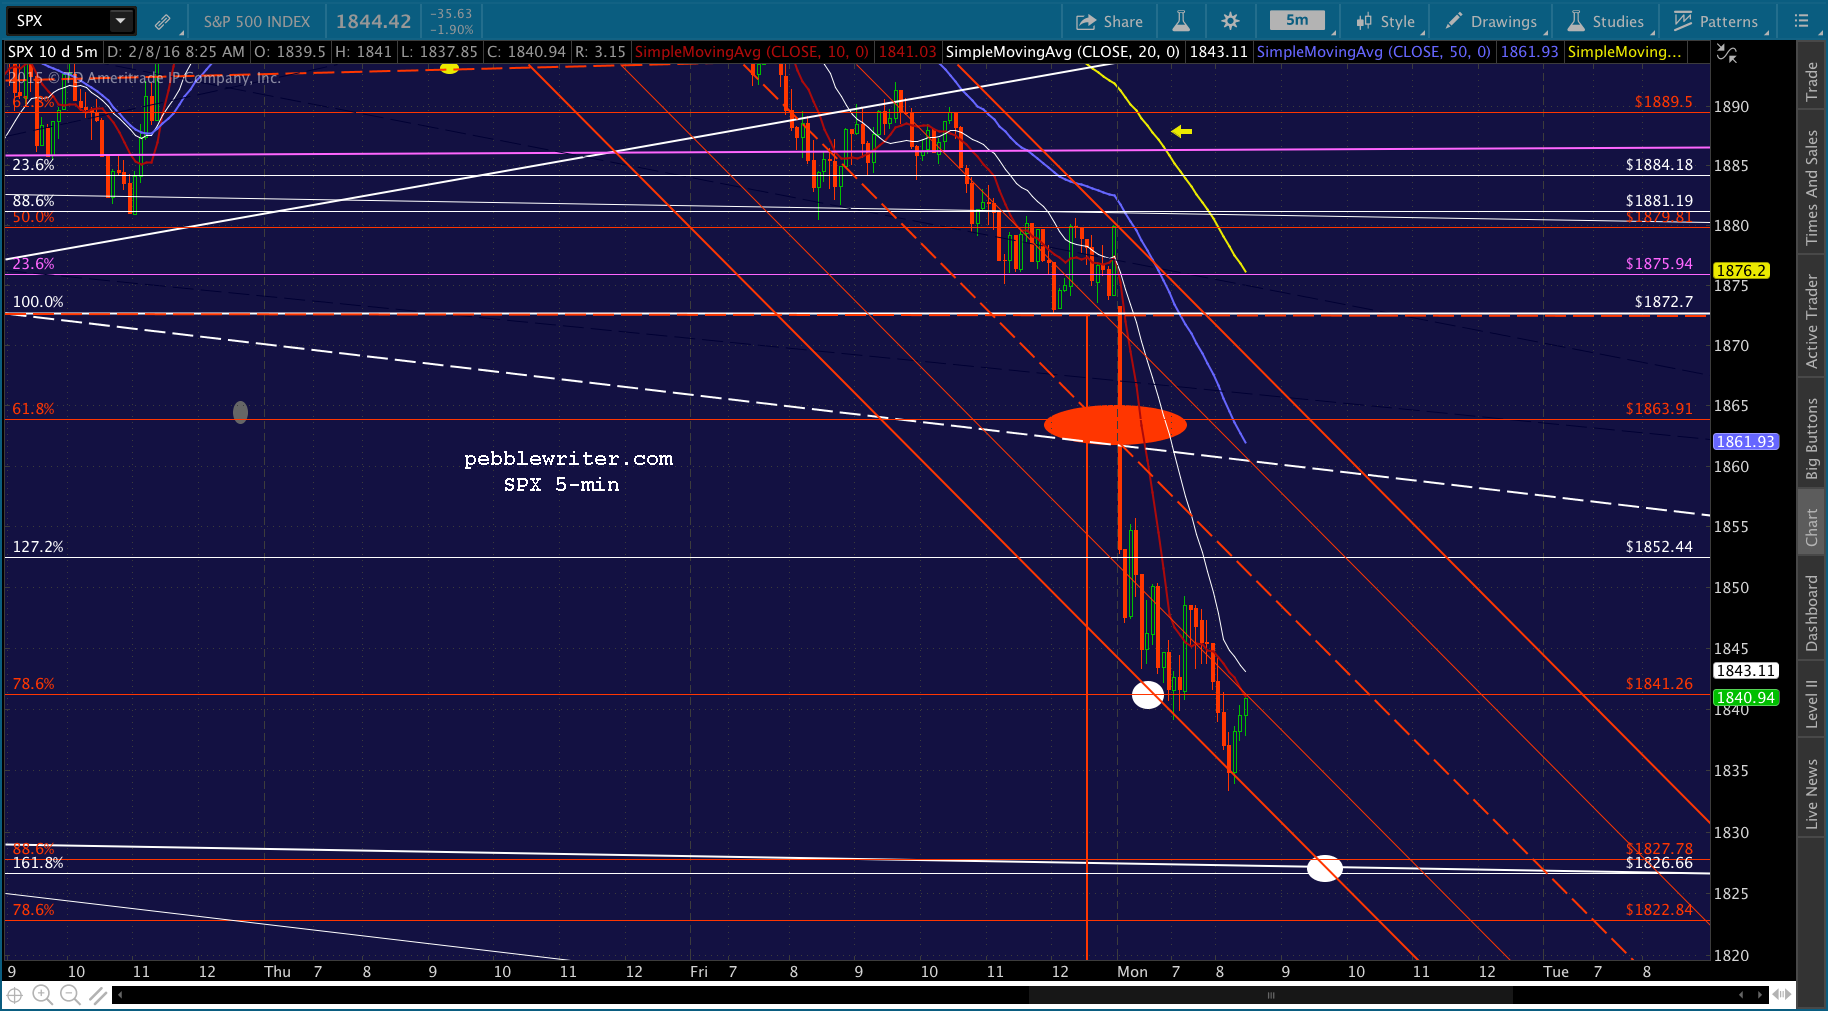 USDJPY is threatening to rebound.
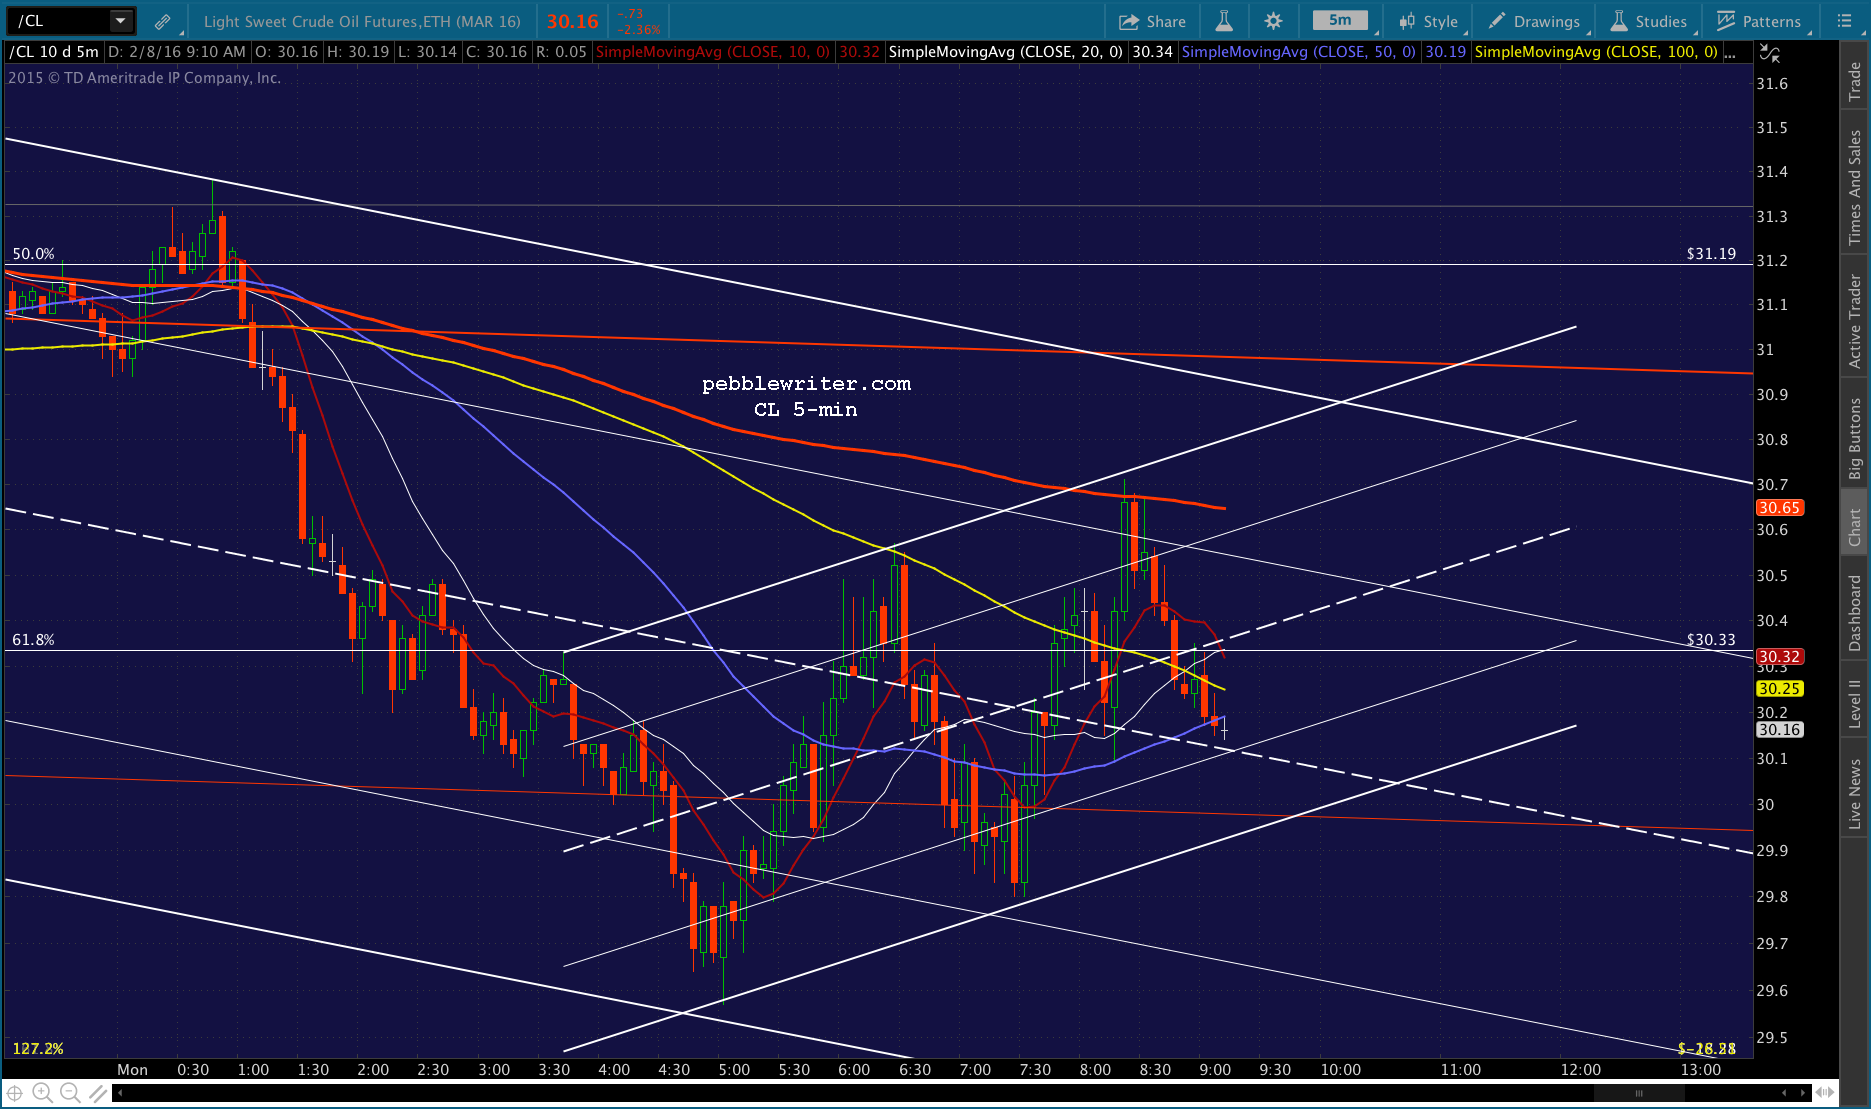
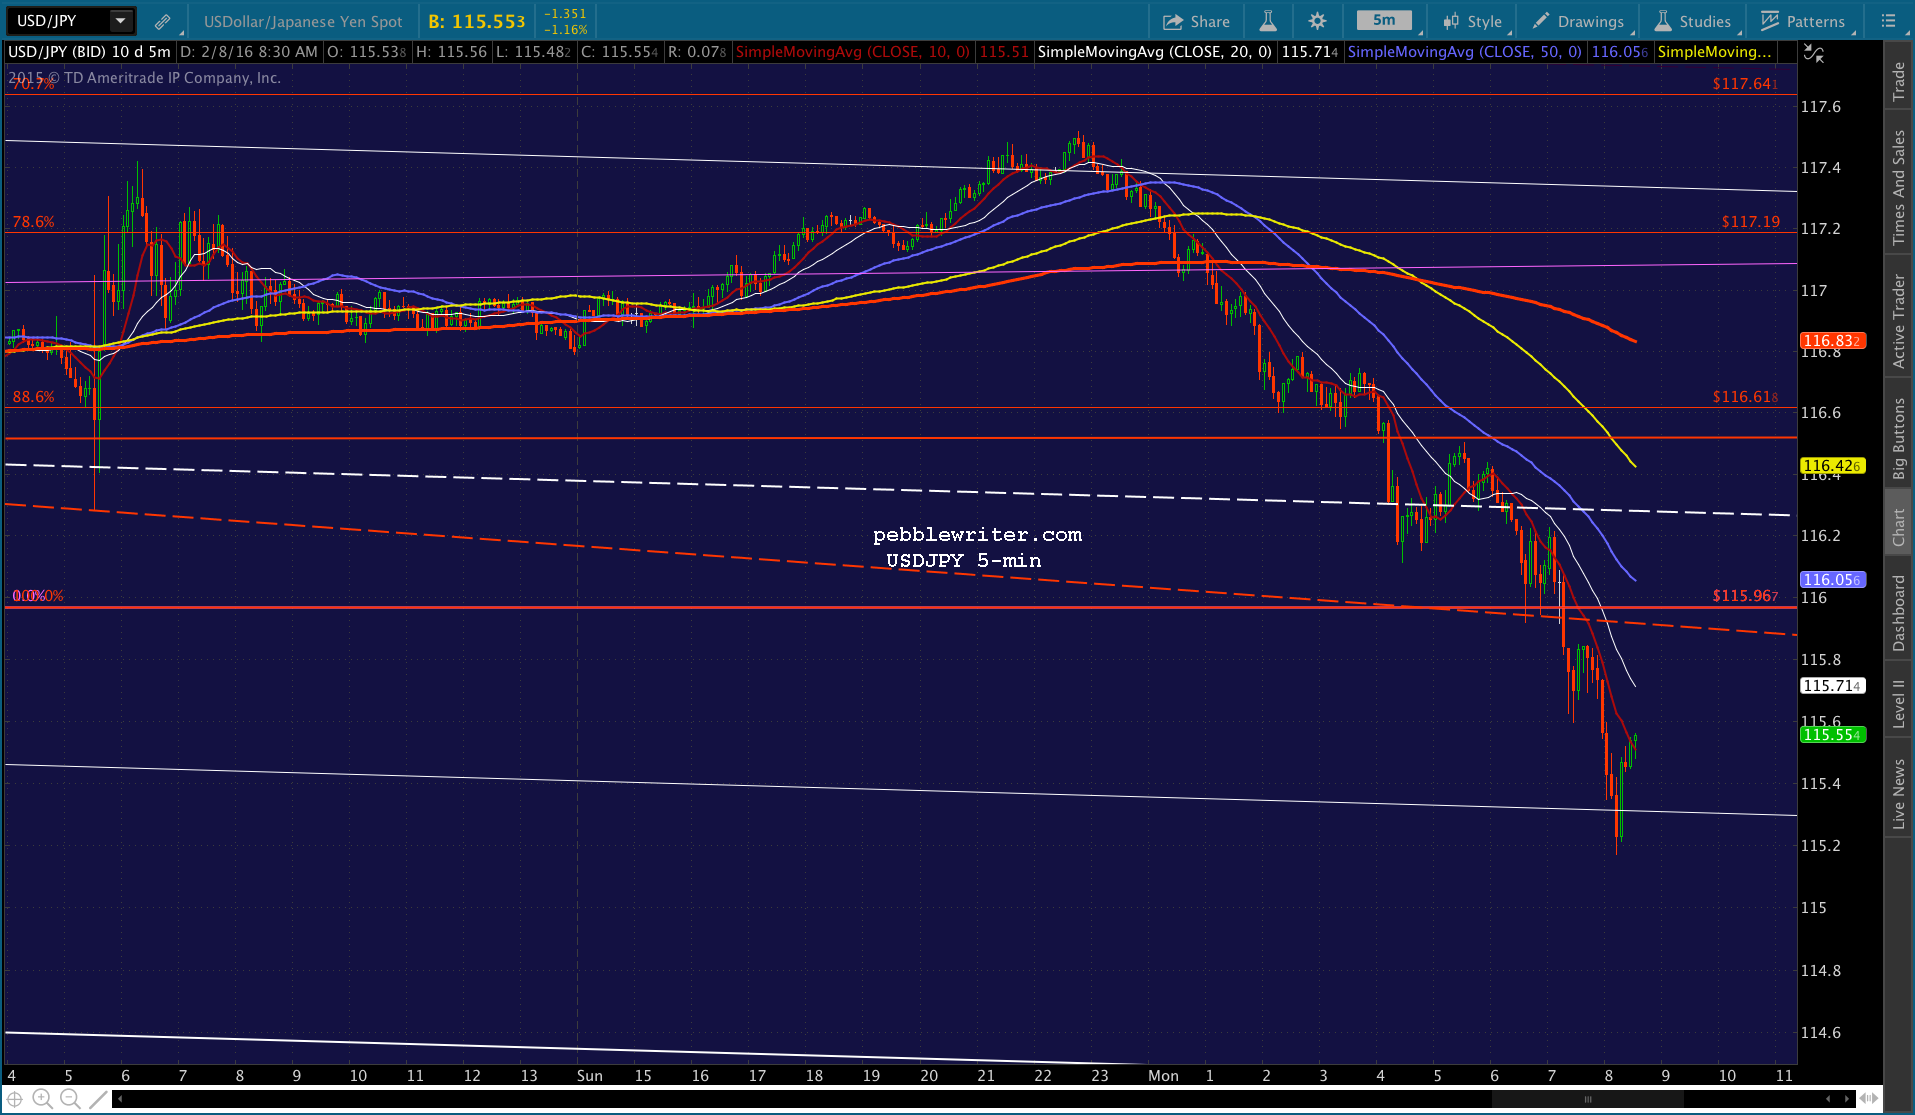 And, if CL pushes above the SMA5 200, it might give SPX an extra boost.
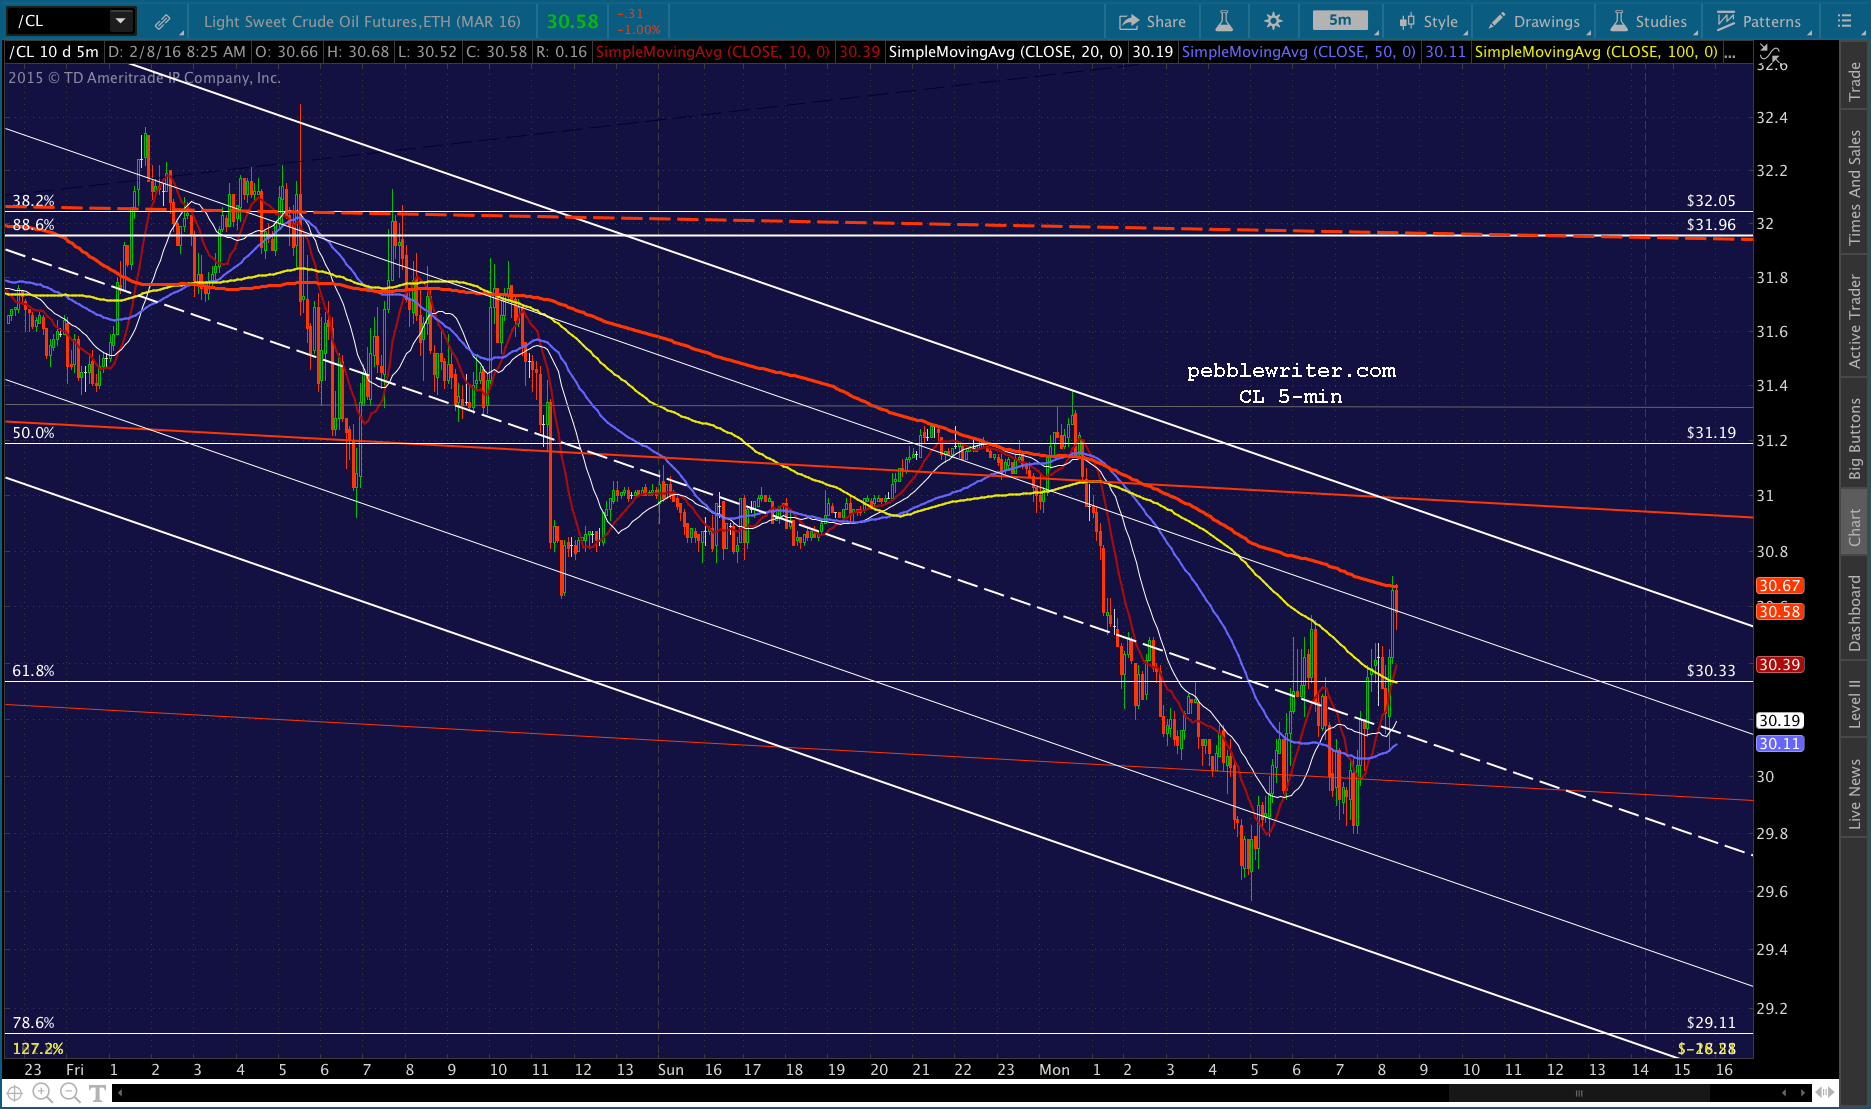 UPDATE: 12:00 PM
SPX is pushing slightly beyond the SMA5 20. I’d dump the short here and revert to cash. There’s a 50:50 chance this is a headfake, so be ready to short again in the next few minutes if it dips below the MA. NKD has a good chance of reversing here…
 …but, USDJPY seems to be heading for 115.90 at the red channel midline.
 UPDATE: 12:09 PM
CL is hinting at lower, meaning the next leg down might be coming up. But, not confirmed yet by anything else. I’ll take a chance on a short based on the timing. Very tight stops advised.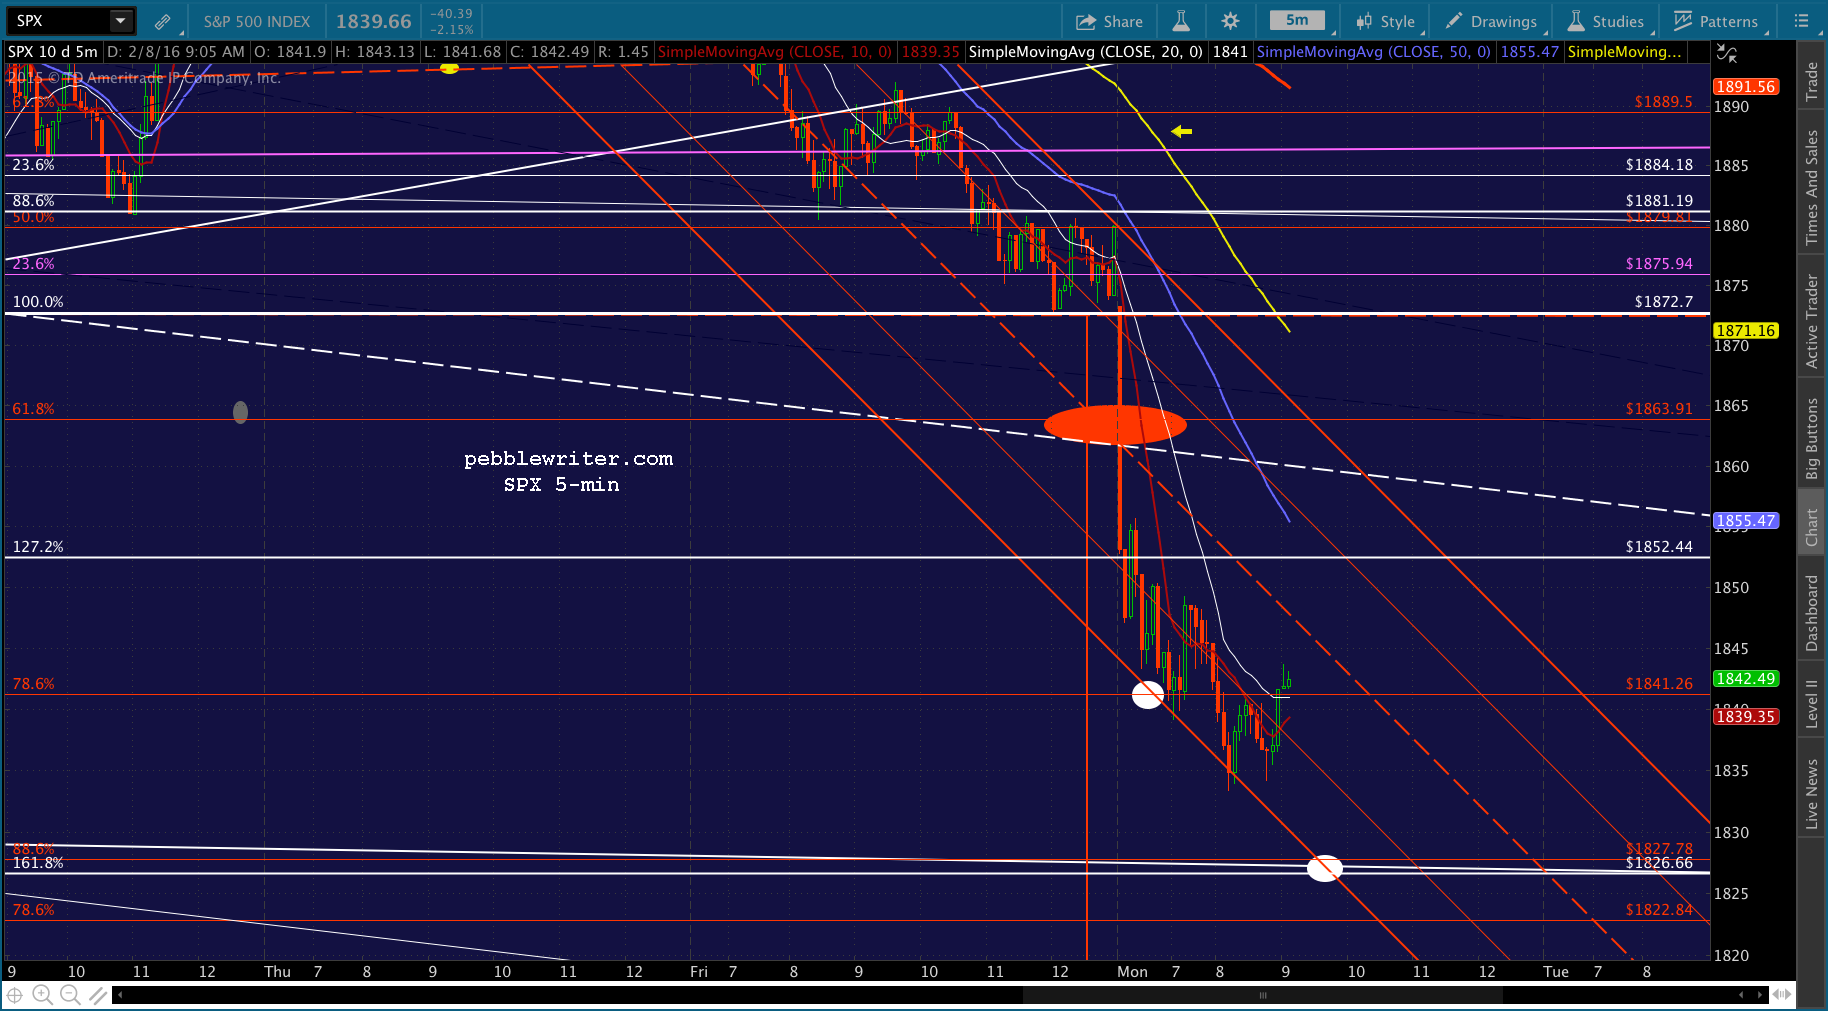 This one is iffy, because right now everything points to a continued bounce. But, we often get one last leg lower that turns the corner around 12:09. And, the next lower target looks best at 12:40ish — only 30 min away. CL or NKD could touch it off…
 UPDATE: 12:18 PM
Every time SPX looks like it wants to leak lower, CL pops up a little. And, when it starts to push higher, CL dips. I’m going to step aside here at 1843.57 until it makes up its mind. We often get a pop when the SMA5 10 and 20 cross, and that’s coming up in a few minutes for ES, SPX and NKD. UPDATE: 12:26 PM
I’ll take another stab at a short position here at the falling red midline. ES is backtesting its H&S neckline. Not a high probability trade, but worth a shot IMHO.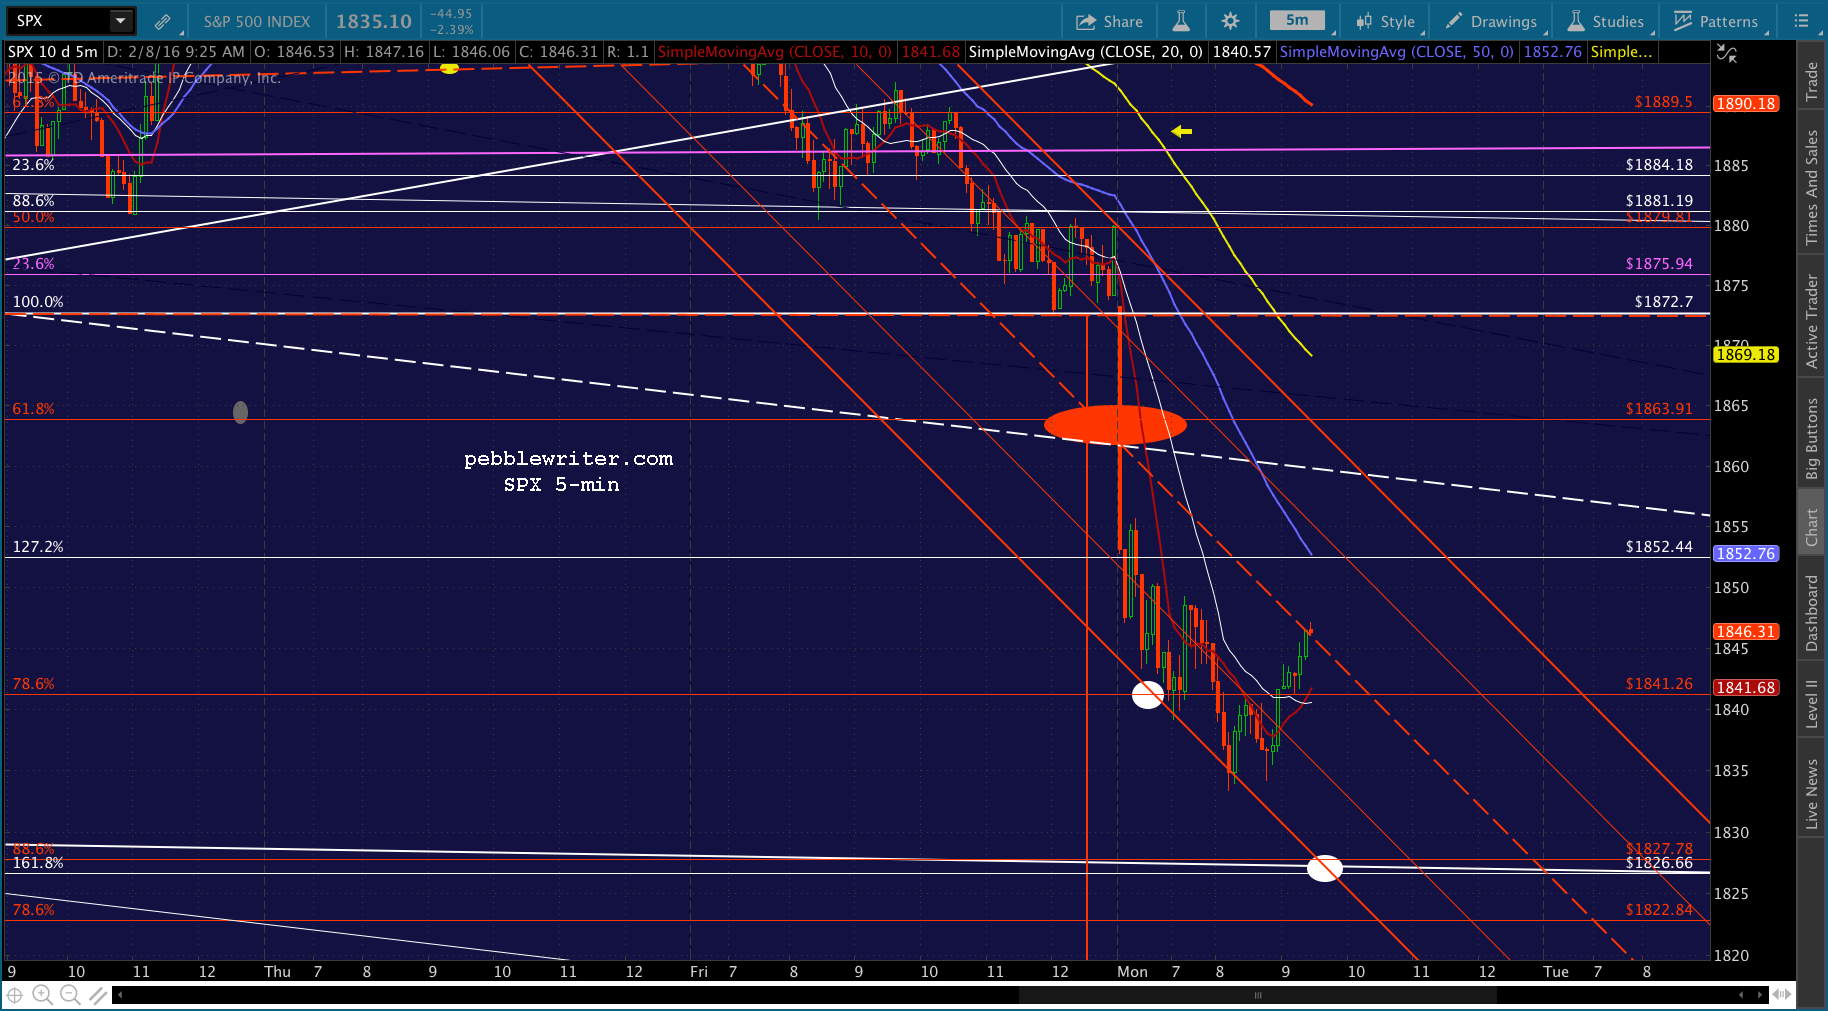
 UPDATE: 12:30 PM
Bailing. Not enough help from the others, though there might be soon. I’m just a little nervous about it popping up to the SMA5 50 and losing a quick 5 points. If the 1826-28 target is to be hit, it should start down very soon.
UPDATE: 12:38 PM
I’ll give it one last shot here. Back to short at 1845.66. UPDATE: 2:00 PM
USDJPY and NKD are getting a little lift, and this is within a few points of our target. I’m sure I’m leaving money on the table, but I’ll go ahead and take profits here at 1830.92. If it bounces, it’ll likely just delay the drop to 1826.66 for a while, and I want to get some other charts posted today.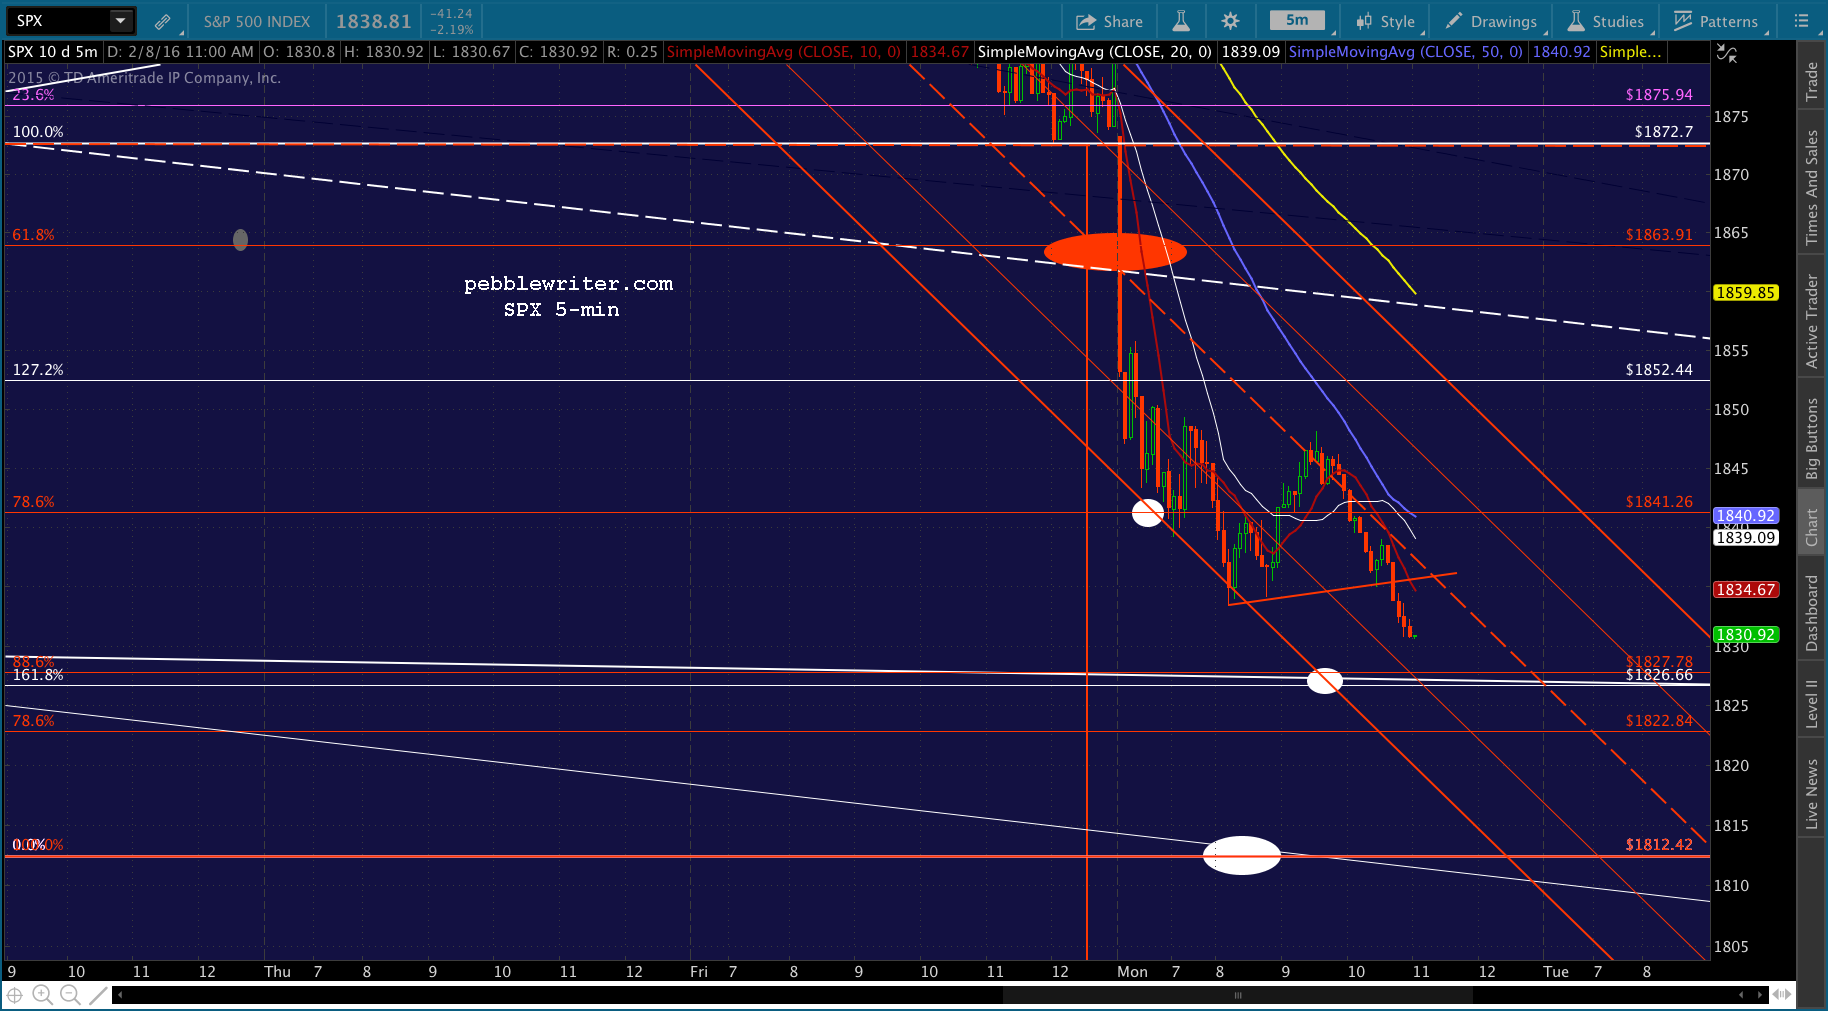 UPDATE: 2:05 PM
Can’t ignore another good setup. Back to short here at 1834.86, the TL and SMA5 10 backtest.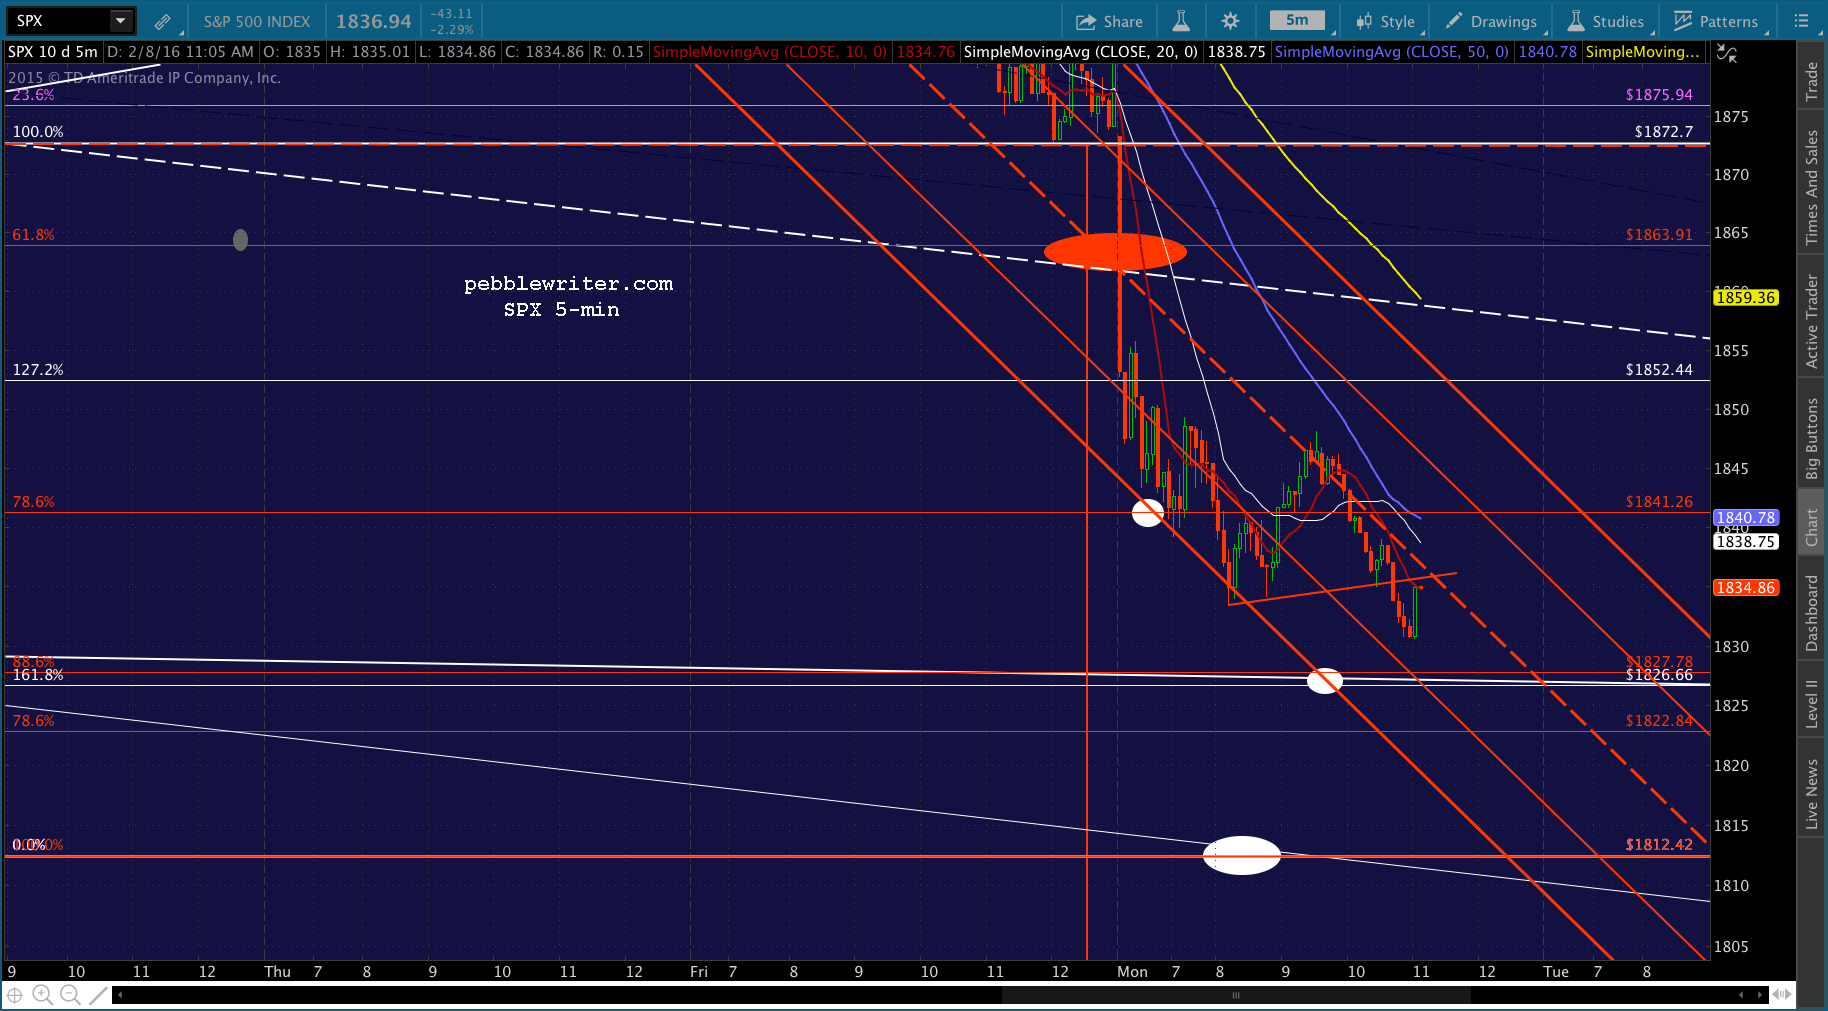 Just watch NKD, which might suddenly pop up above the SMA5 10 and throw a head fake or two.
 USDJPY has no particular support to worry about.
 UPDATE: 2:23
USDJPY is leaking a little higher again. Looks like SPX is working its way back toward the TL and SMA5 20 at 1835-36.
I’ll go back to cash here. Remember, ES and SPX are a little out of sync. SPX could leak a little lower while ES reaches its .886.
I’m going to take a 5-min break… If it reaches the SMA5 20 (now at 1836ish) before I get back, I’d short there with very tight stops.
UPDATE: 2:39 PM
Guess I should have waited a few minutes longer. Back to short here with tight stops for the drop to ES 1819.73. The way it’s going, still a good chance of popping up to the SMA5 20, now at 1834.17. UPDATE: 2:42 PM
Yep. Got caught in middle. Back to cash.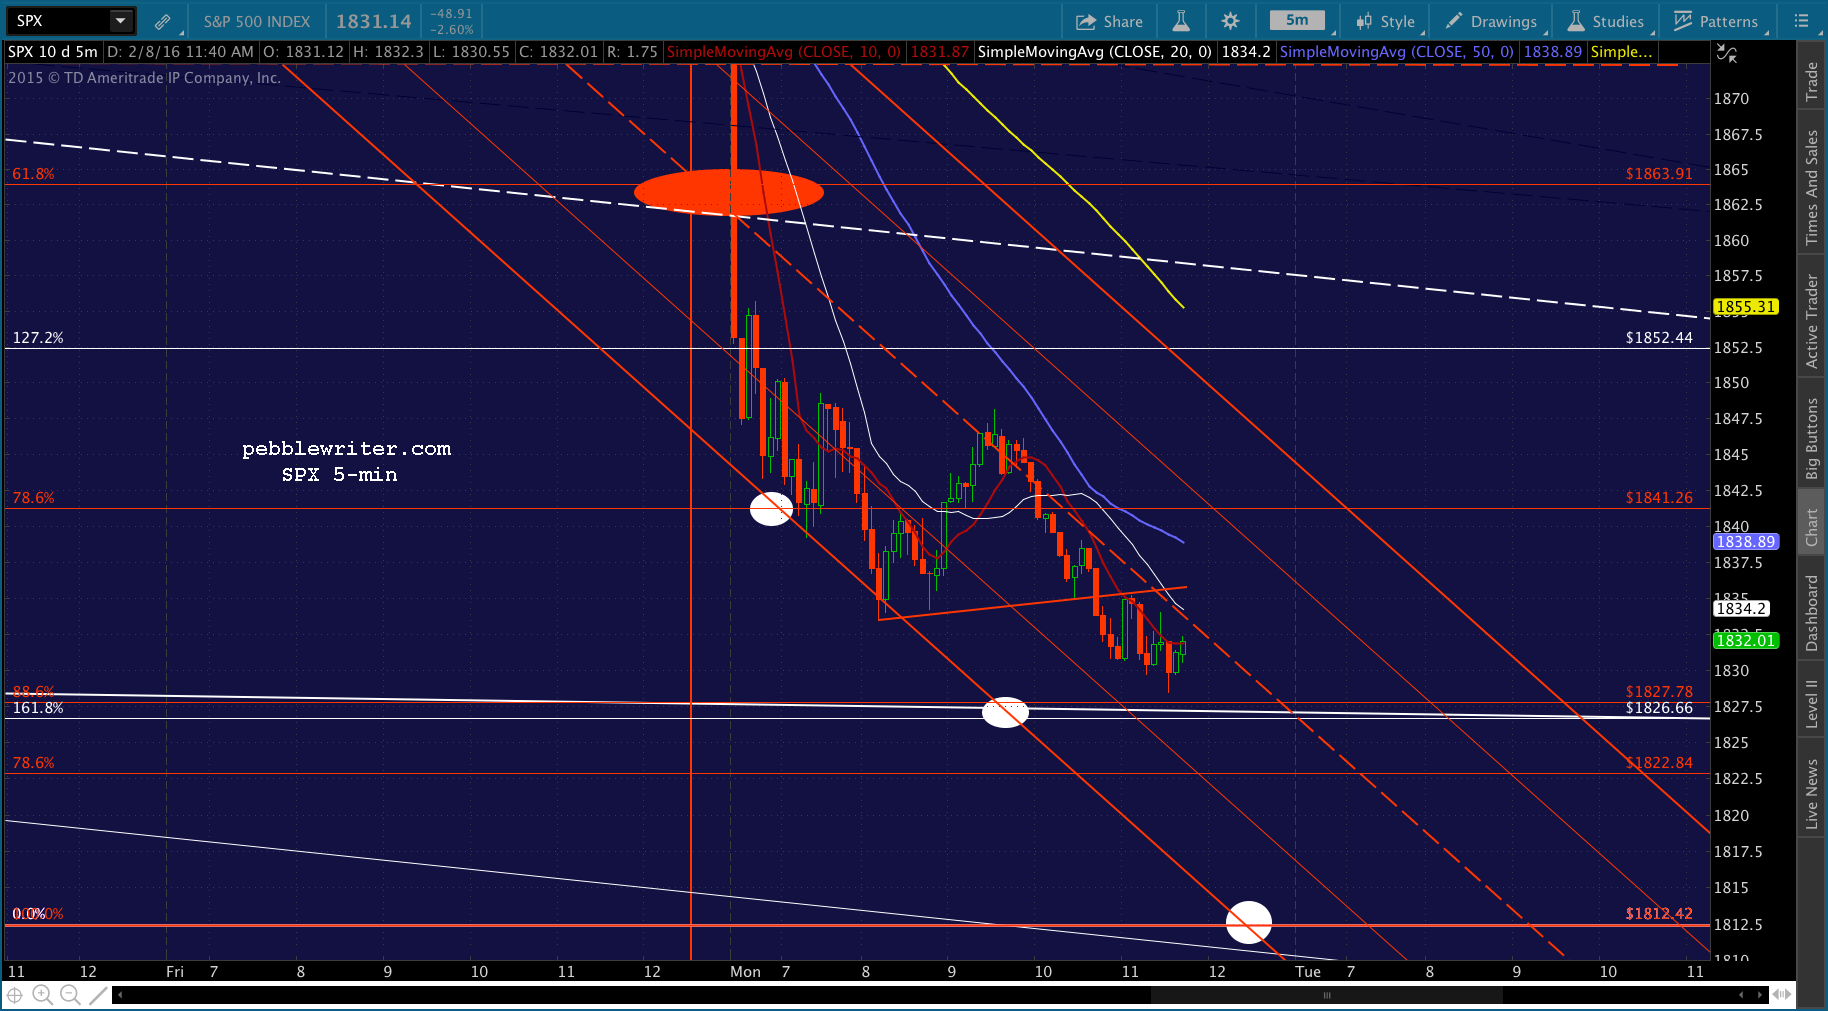 UPDATE: 2:45 PM
This is where I had wanted to short. But, now NKD is gapping higher. Craziness getting started?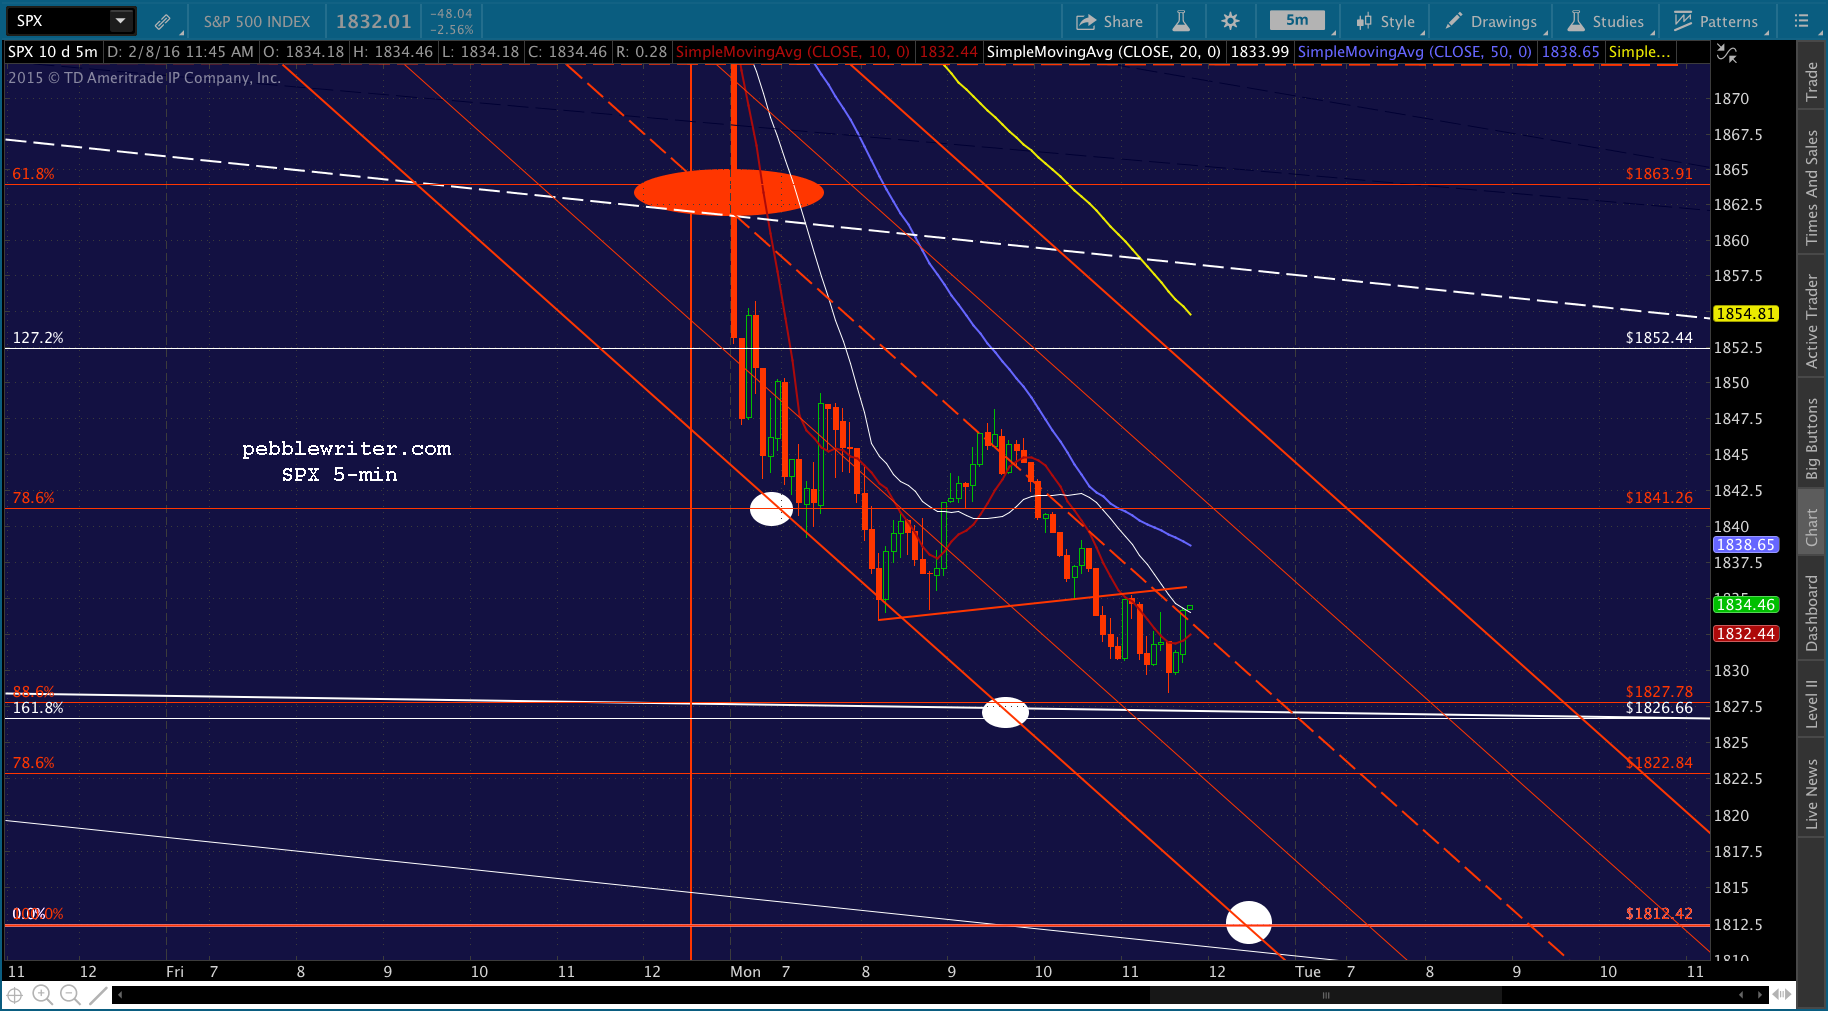 UPDATE: 2:48 PM
Backing off the exuberance. Back to short here — again, with tight stops.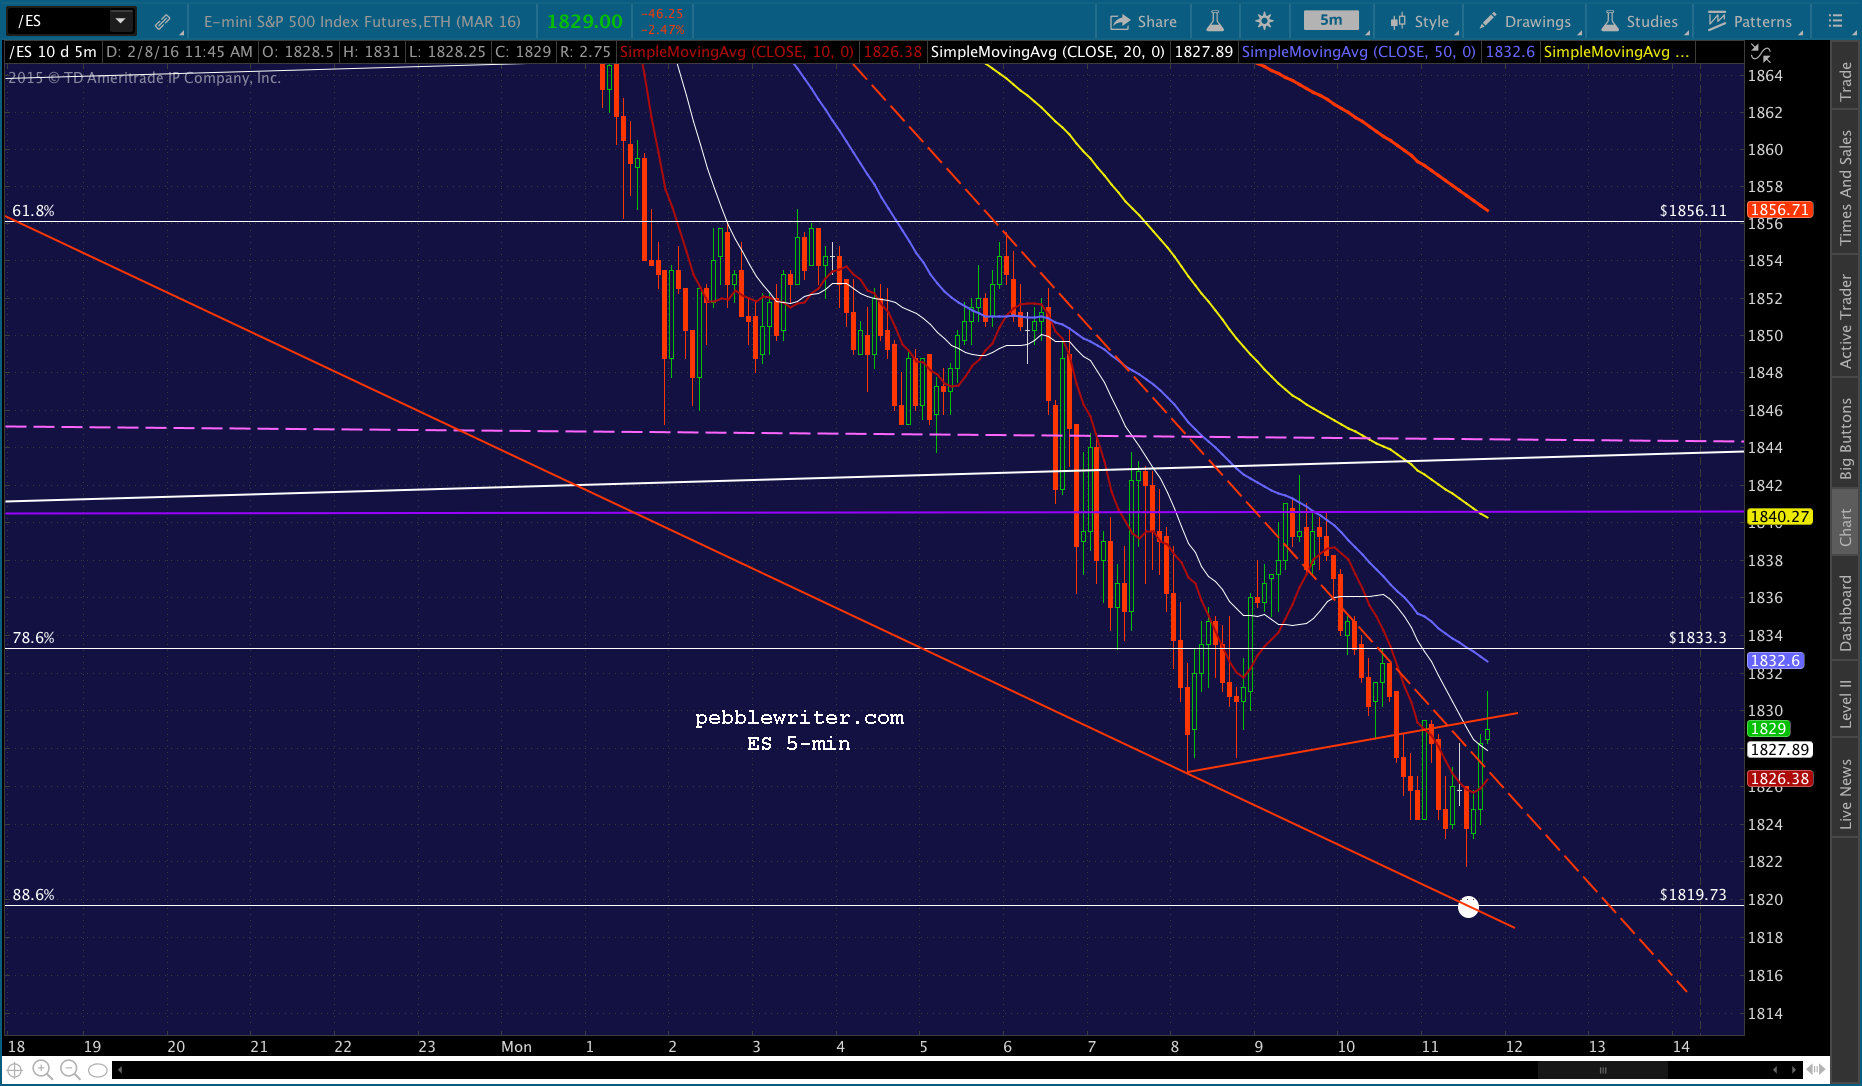

 BTW. I believe there’s a decent shot at < 1812 some time around the close. It’s been a while since we had a good stop run at closing time.
UPDATE: 3:08 PM
Not liking the way this is going. Back to cash here, as it’s likely to run up and tag the SMA5 50 at 1837-38. Not clear whether we’ll get the last second plunge or not. Watching for a sign from USDJPY — a dip through that red TL.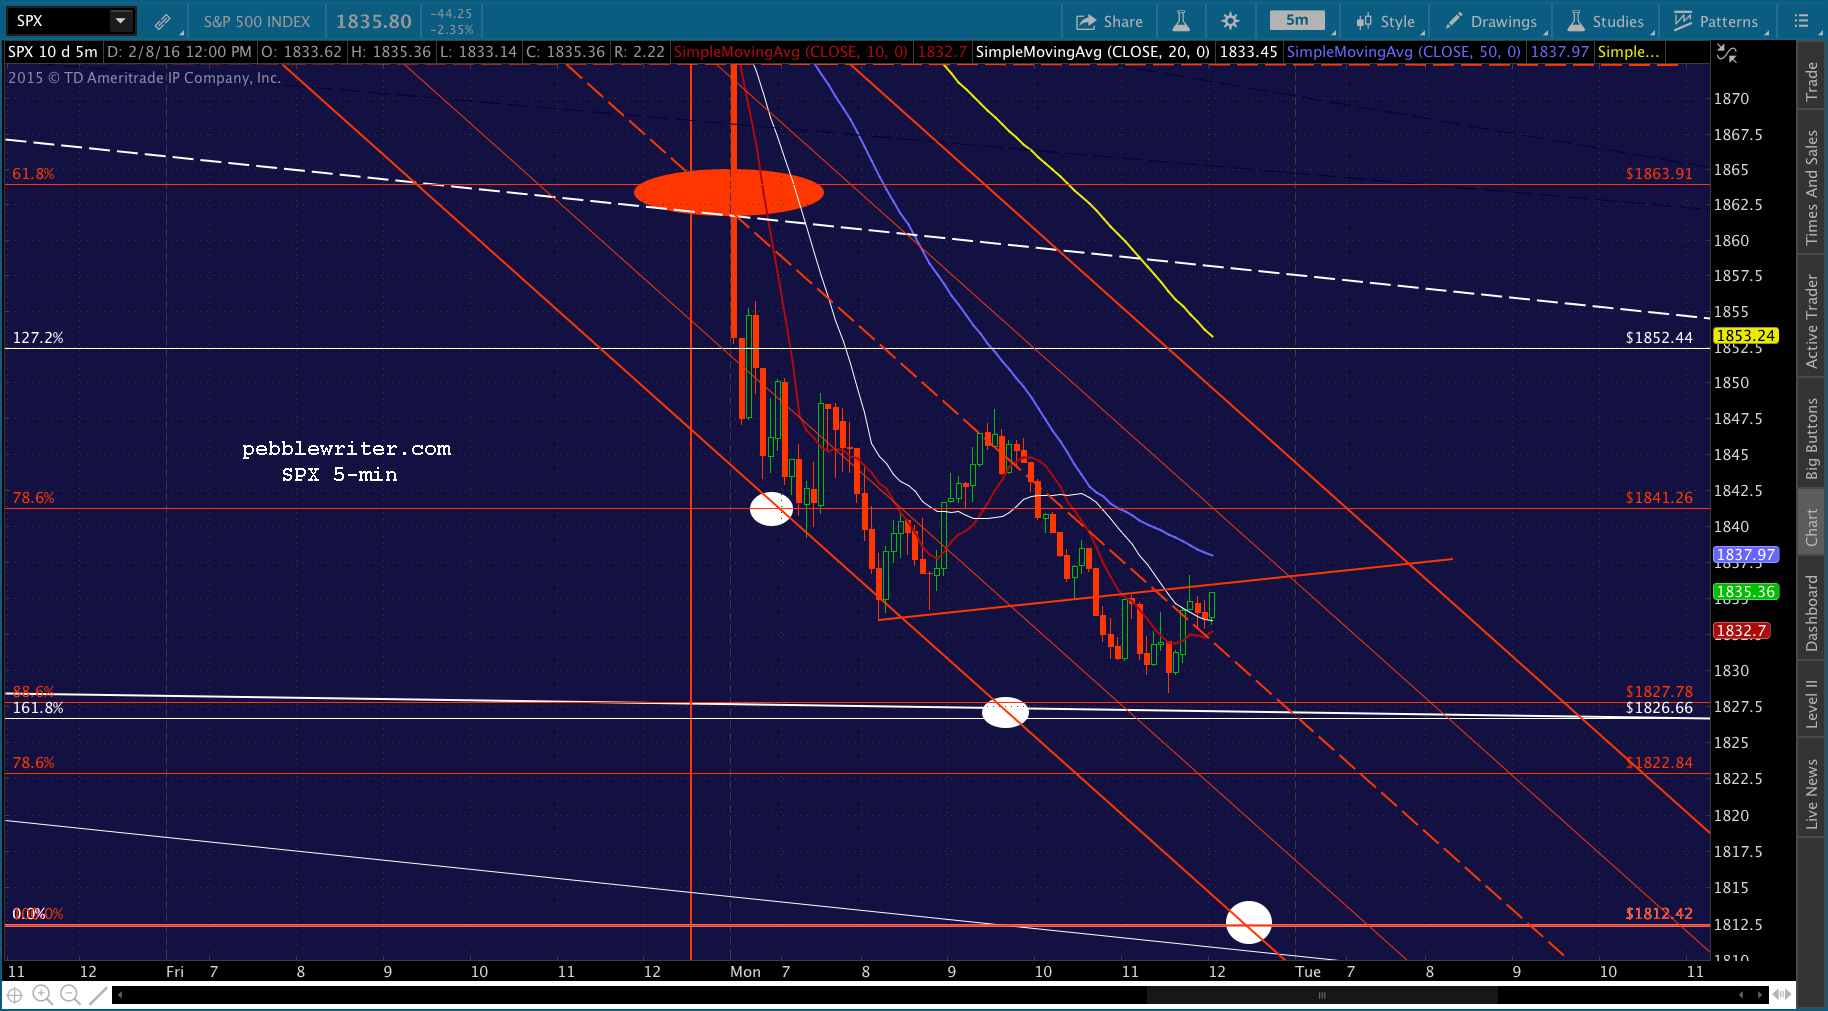
 UPDATE: 3:49 PM
Quite a spike. All algo-driven, of course, with USDJYP leaping out of its falling channel and CL backtesting the broken white channel, SPX got all the way back to the white channel midline. Should be a safe short here.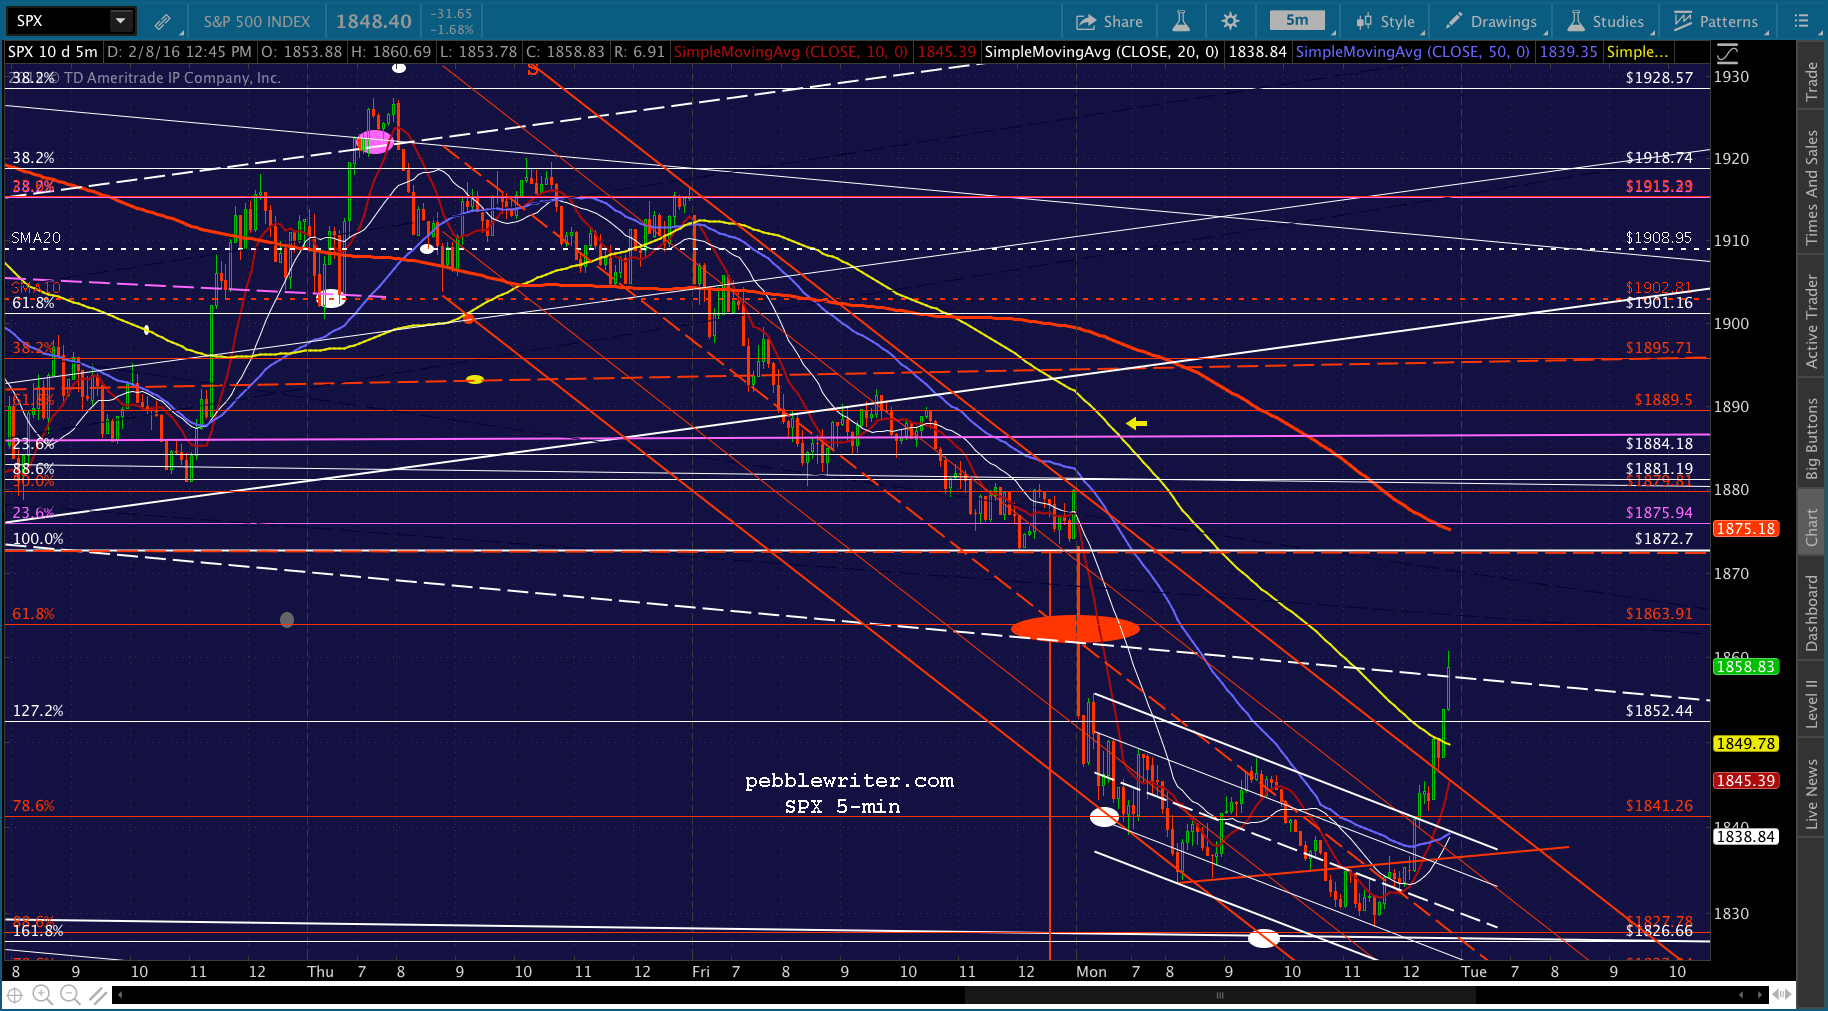 But, with only 10 minutes till the close, the gains might be limited. And, no one should hold short overnight unless they can hedge or watch the position closely. Initial support now at the SMA5 10/100 cross around 1848.50ish. Plan on closing there.
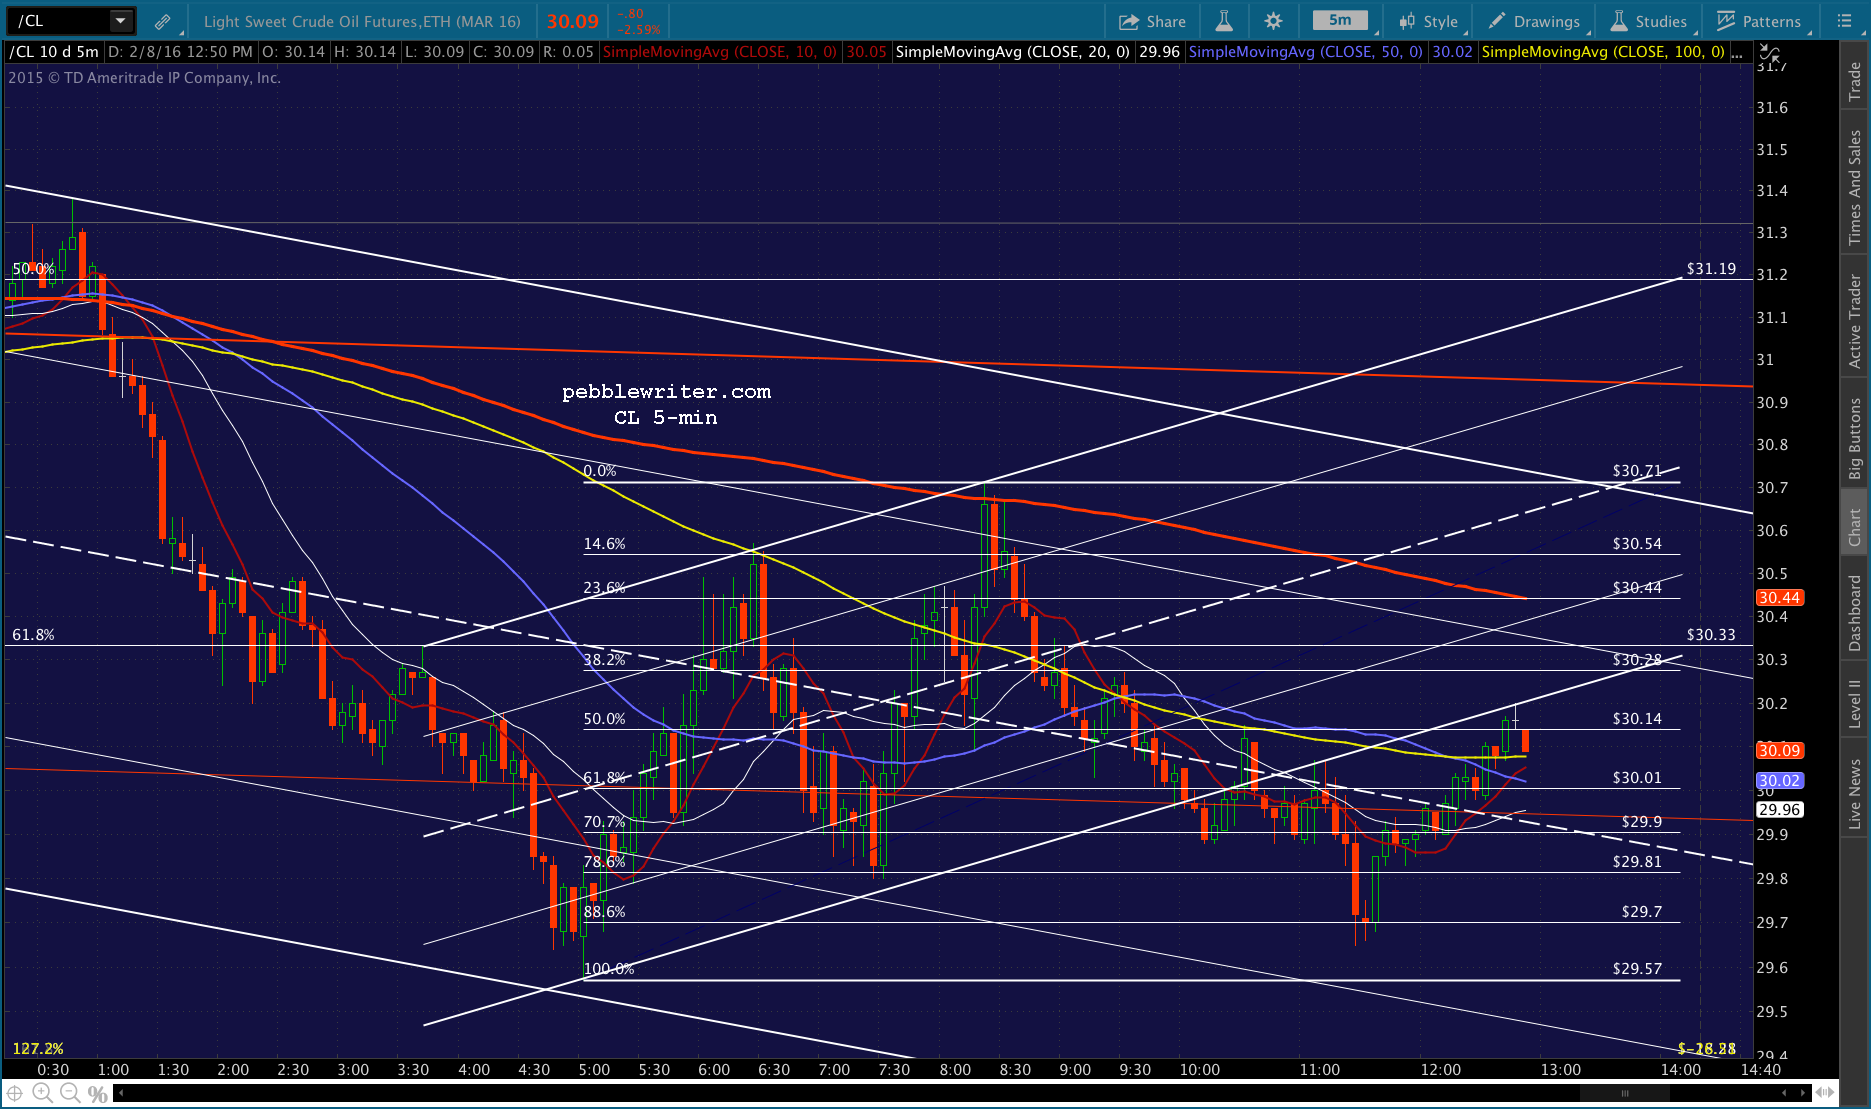
 UPDATE: EOD
Closed and out at 1853.61.
Comments
3 responses to “The Big Picture: Feb 8, 2016”
Look under learn tab and u will see his explanations of the different moving g averages and how he has them demarcated by color on his charts. Helped me when I started since his charts are busy
Hi pebblewriter, if it is not proprietary could you answer:
1) “reverting to short with tight stops at the SMA5 20”, what is SMA5 20? you put you stop loss between sma5 and sma20? what is “tight stop” in your opinion?
2) other day you wrote “the target is ….” and then “close enough, I am in cash”. I don’t understand how you put exit order. I assume you use OCO (One Cancels Others), but you have to put price both for stop-loss and for your target, if target isn’t reached yet how you go to cash?
Not proprietary at all. SMA5 20 means the 20 period moving average on the 5-min chart. The 10 and 20-period moving averages are commonly used by the algos as turning points — particularly when trying to turn around a decline.
As for exits, I’ll often set a target based on chart patterns or Fibs, but exit earlier or later depending on what USDJPY, CL or ES are doing to influence it one way or the other. The algos are so responsive these days that they can be easily used to fake traders out. Also, while I don’t have anything against price-based stop losses, I usually use more dynamic levels such as a channel or trend line or a moving average.