

Since the next two sessions will be dominated by central bank market manipulation, I’m going to focus today on the big picture.
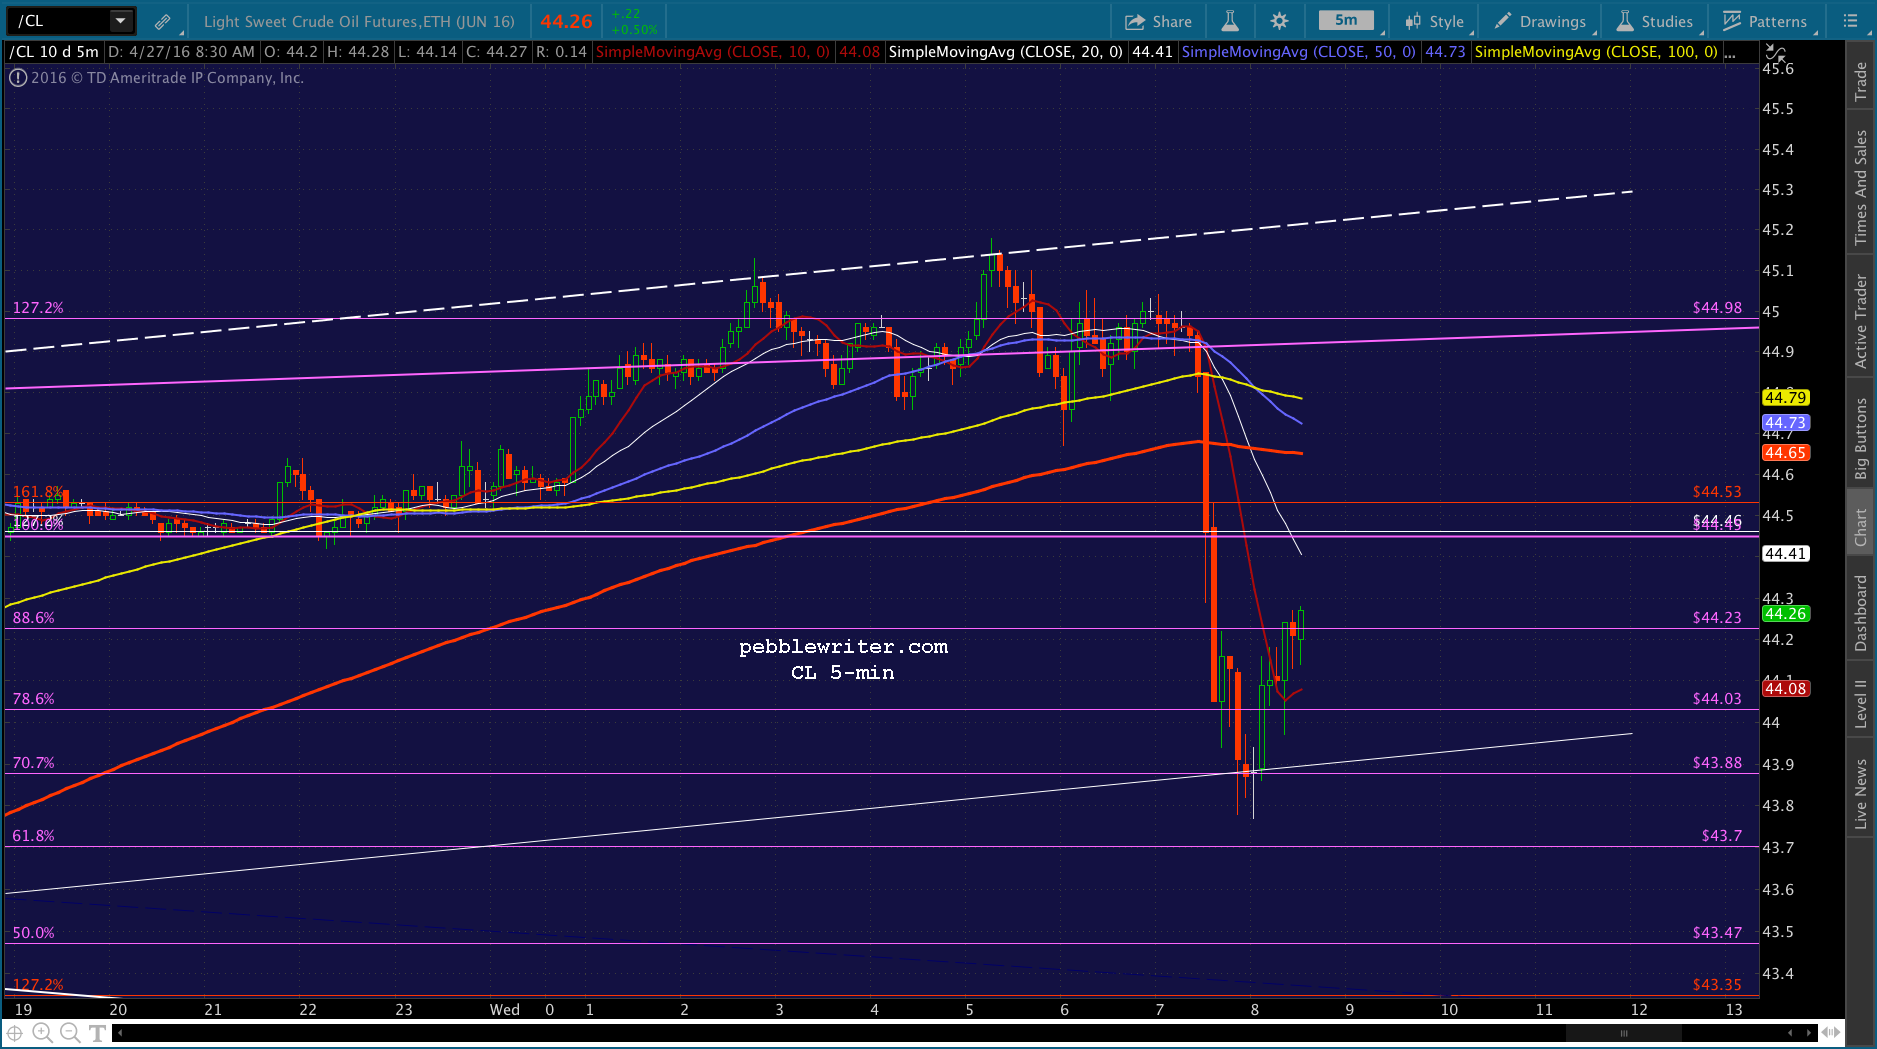
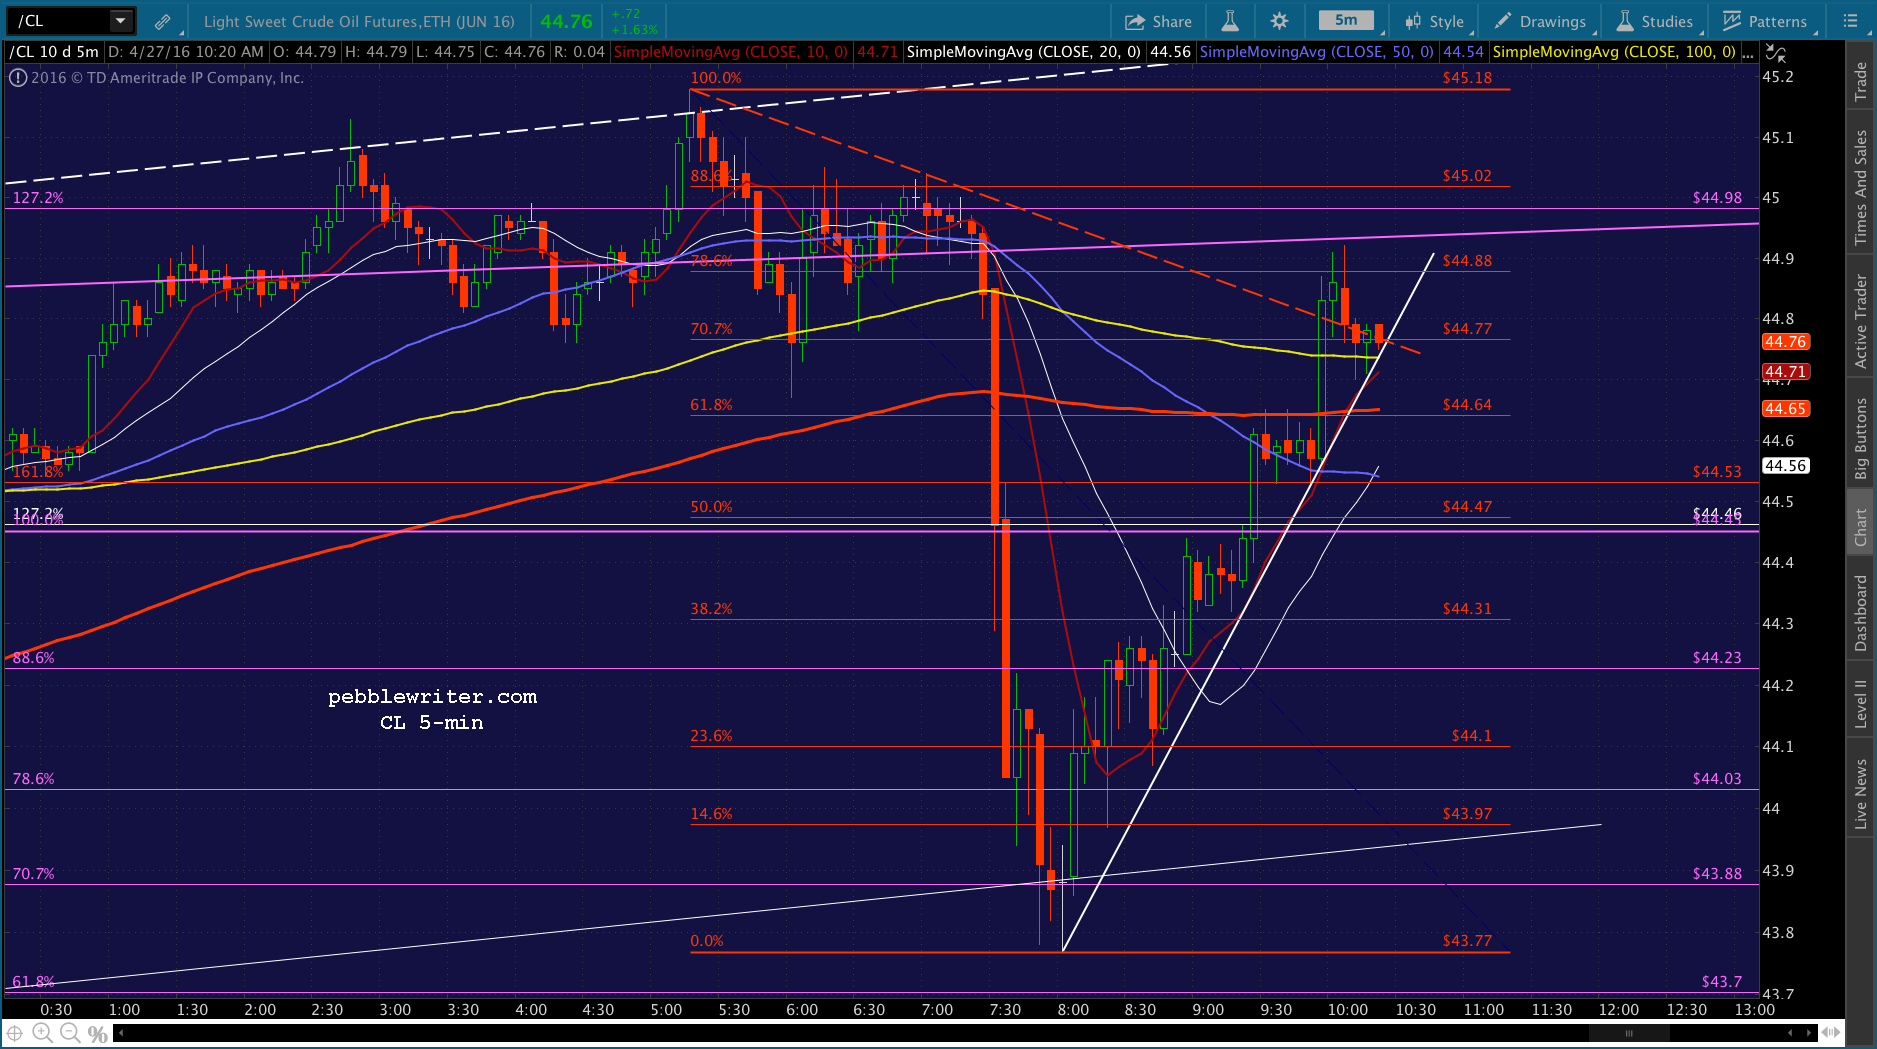
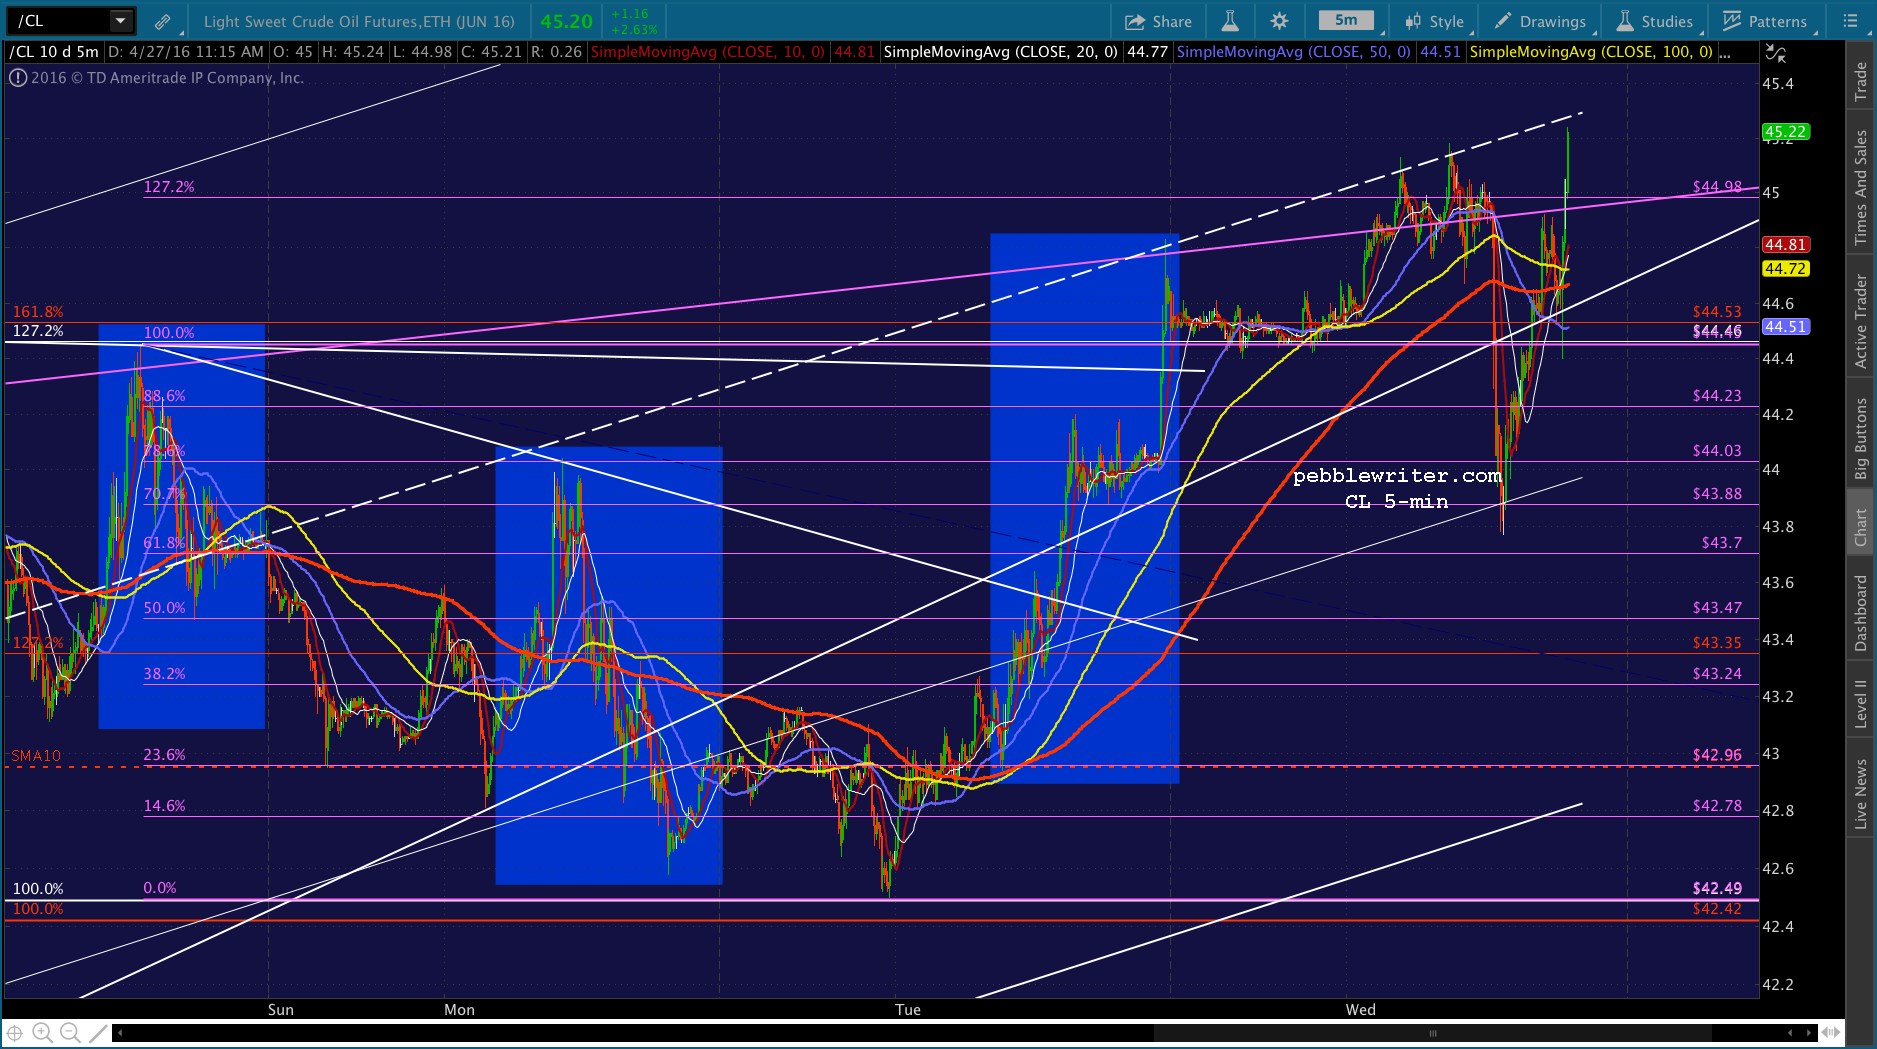
CL is up almost 2% this morning, an almost daily occurrence (market hours are highlighted in the chart below.) This allowed the sell off which might have occurred after the world’s biggest company lost $40 billion in market cap, following a disastrous earnings report, to be limited to about 8 points. Likewise, USDJPY continues to be pressed into service to prop stocks up, even though its influence has been overshadowed by CL’s. Often, like Friday’s massive 2.4% spike, its actions are designed to compensate for CL’s weakness.
 And, like CL, its spikes are generally confined to market hours in order to have the greatest impact on stocks. After hours, when futures are more easily propped up, it’s reset in order to be ready to repeat the charade the following day.
continued for members…
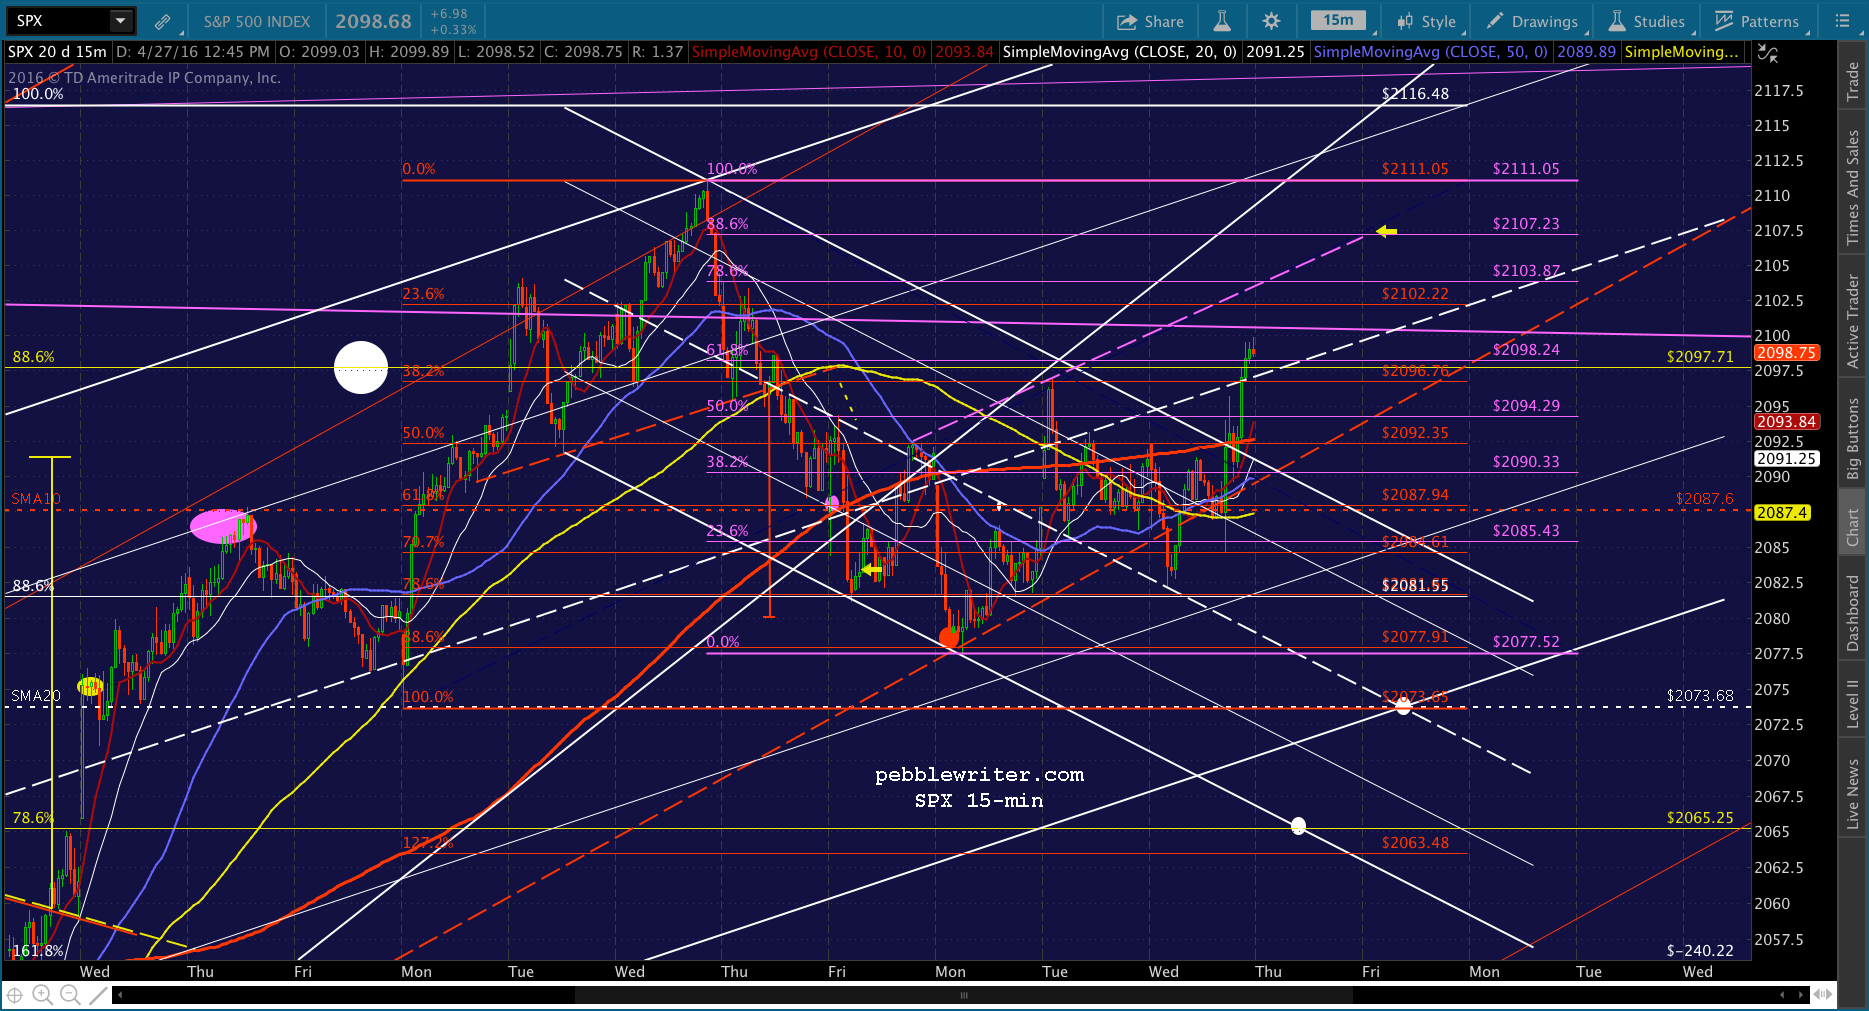
Otherwise, SPX wouldn’t have anguished so much over a drop through the midline of the rising red channel or a backtest of the 10-day moving average. Falling channels would last more than 5 days — the lifespan, so far, of the current one. We’d get a few lower lows once in a while — not just when the SMA10 finally caught up.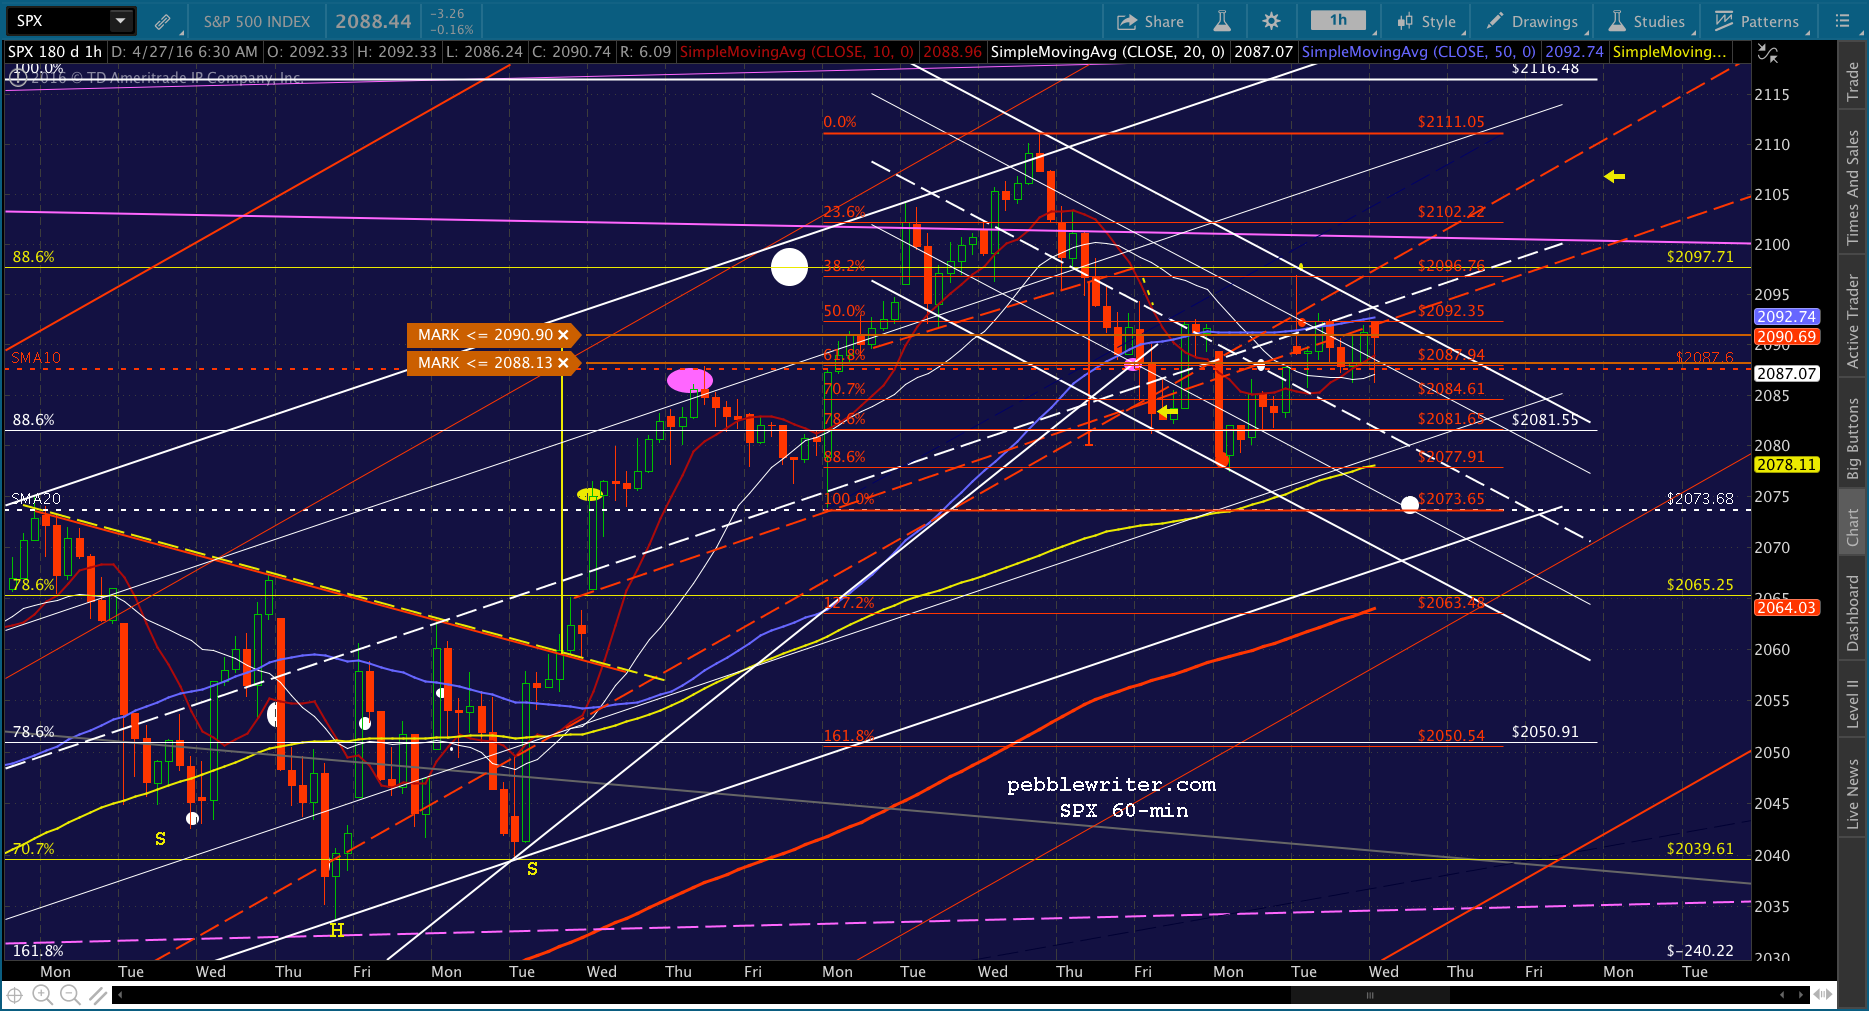 Based on lows in February and March, the rising red channel from Feb 11 would be placed such that SPX has already dropped through the midline. But, if we cheat it a little and call Apr 12 and Apr 25 midline tags, then the past week or so has remained above the midline.
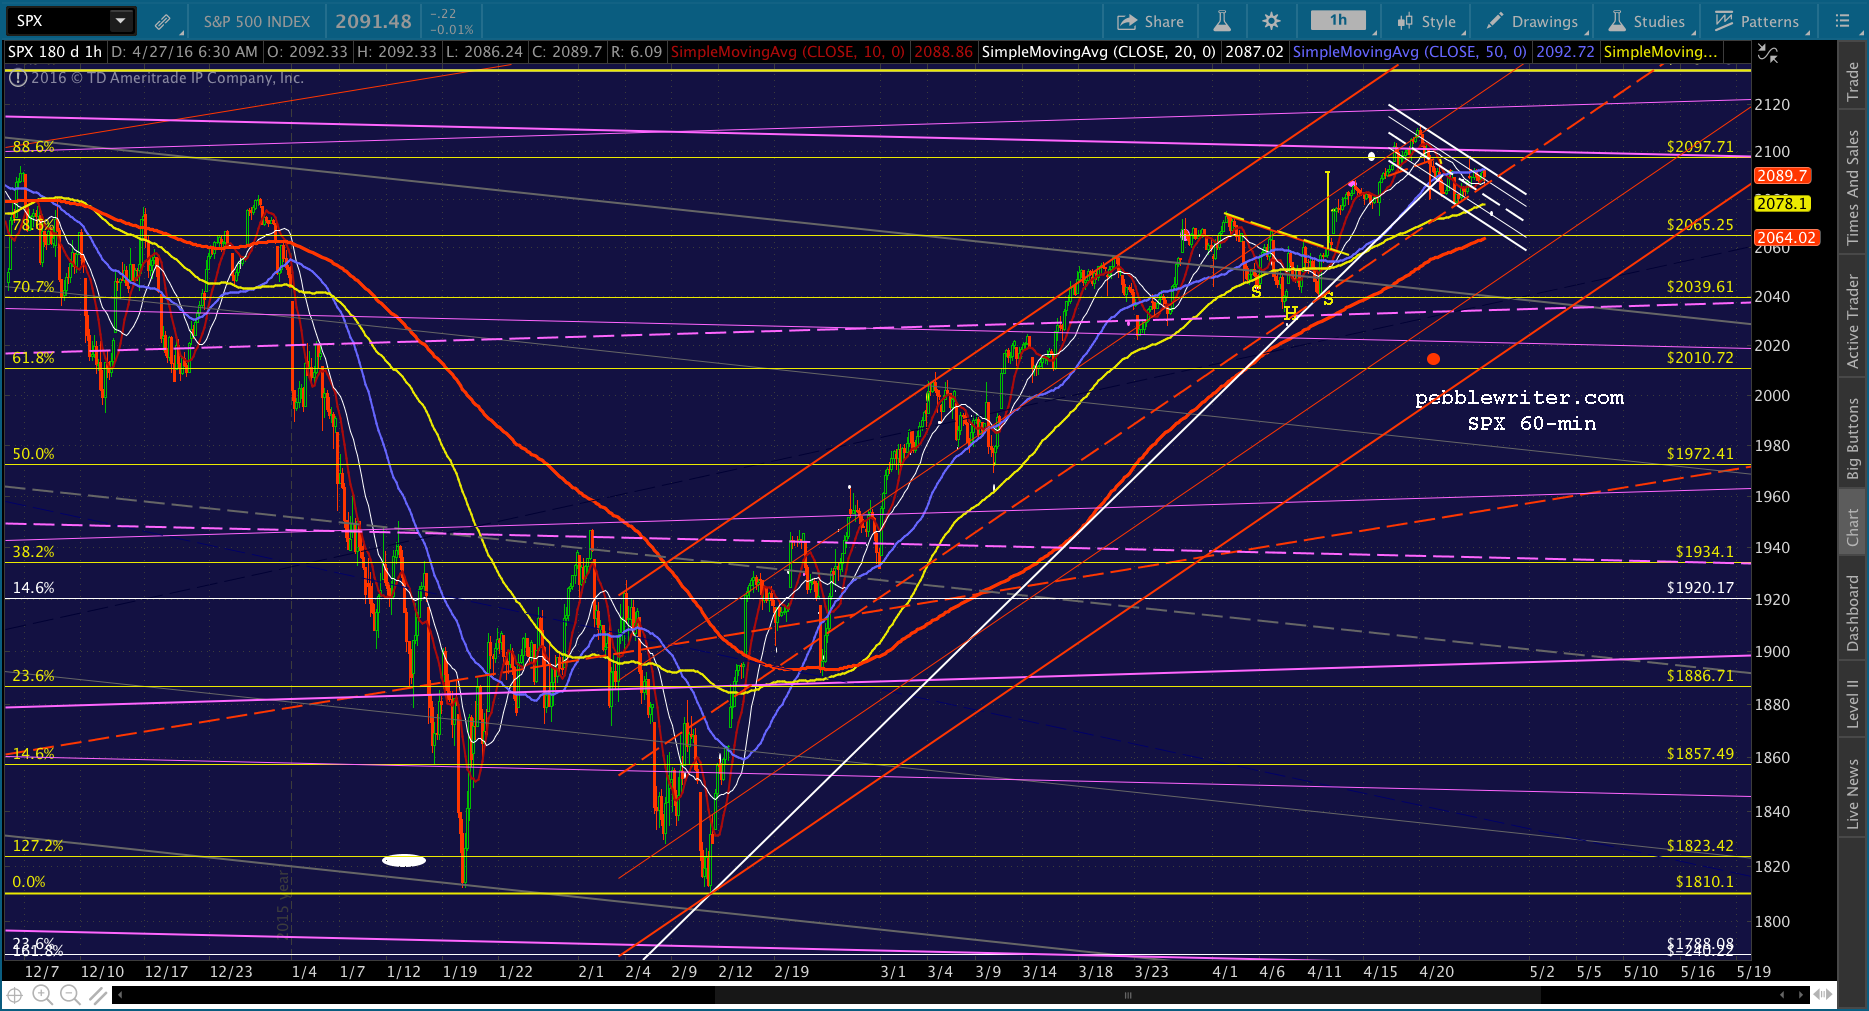 Here’s a close-up. Naturally, if SPX drops through the midline — currently around 2087, one should short. But, I’m not holding my breath.
 Let the SMA5 200 at 2087ish be your guide.
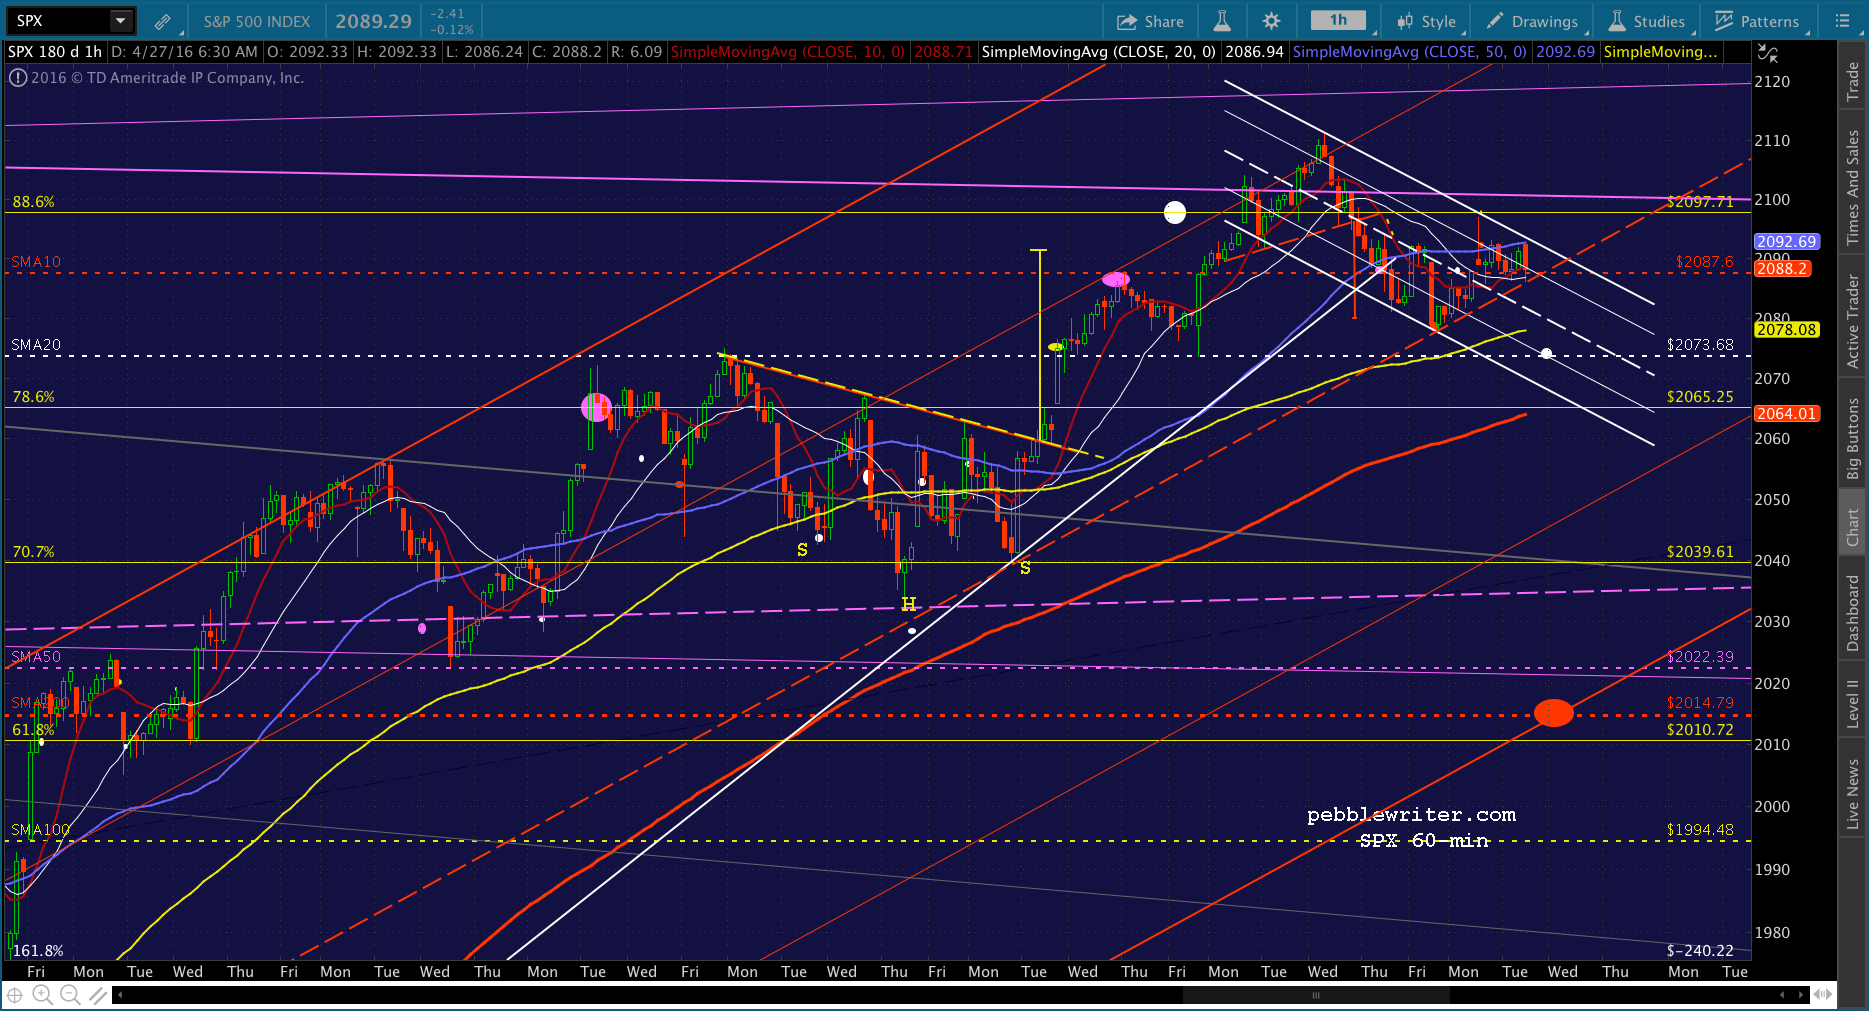
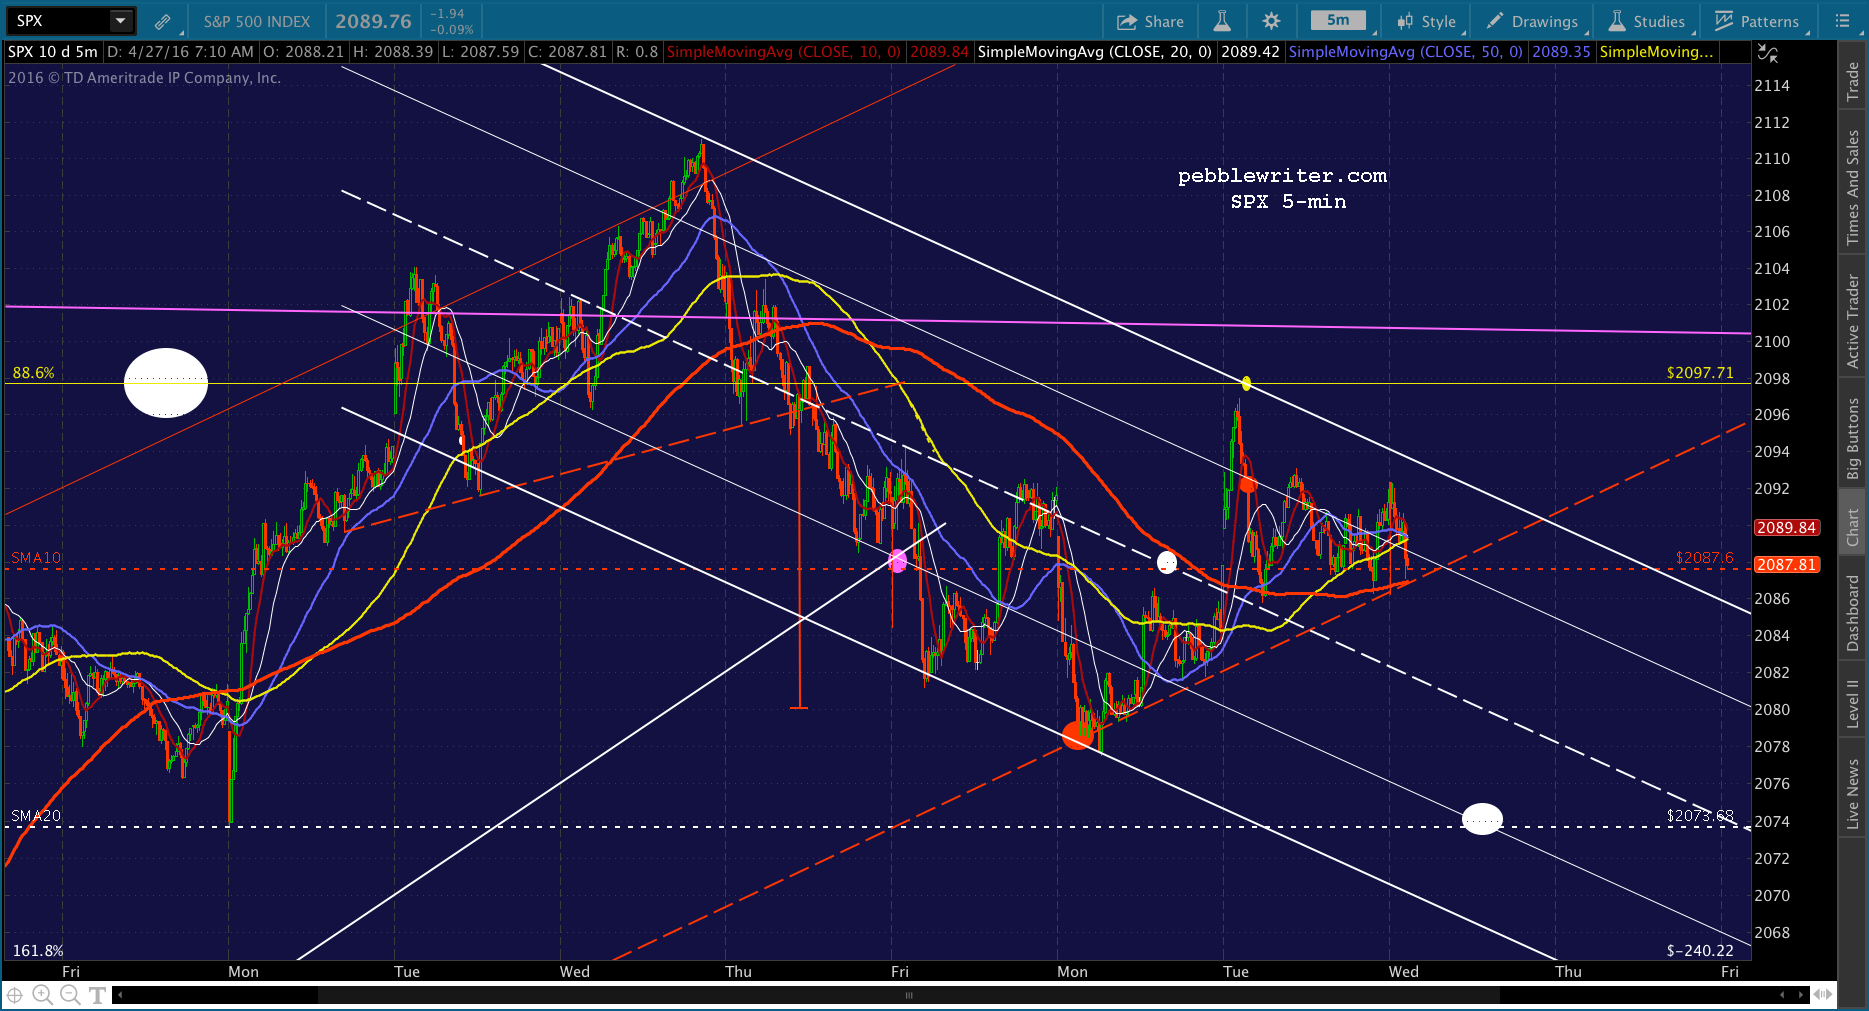 Such revisionist chart redrawings are not legitimate, not by a long shot. But, they have been commonplace over the past few years. While a dip to the SMA20 at 2073.68 looked like a sure thing yesterday, it currently appears be an unacceptable outcome. Maybe after it rises another 10 points or so.
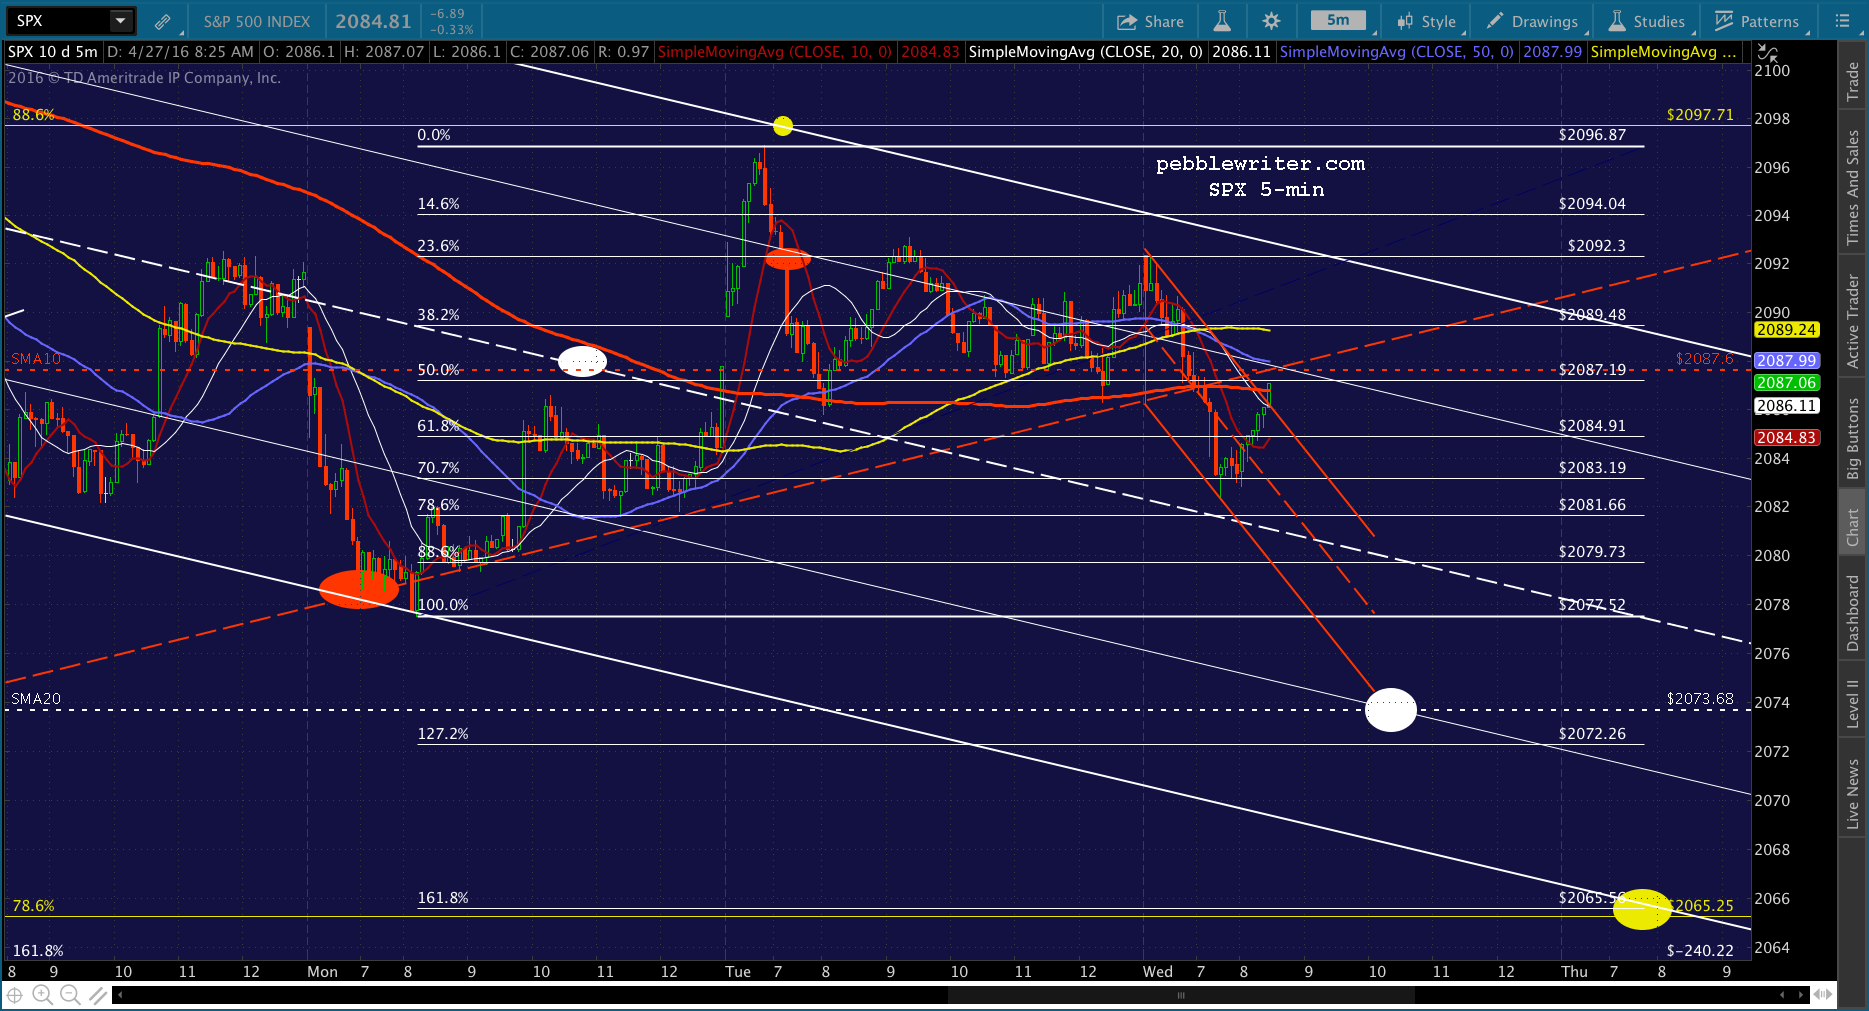
If there’s a silver lining for bears, it’s that tilting the rising red channel over a bit theoretically presents an opportunity for a backtest of the SMA200 down at 2014 (the red dot above.) Though, it sounds ludicrous to talk of a 73-pt drop in the next day or two.
The only scenario I can think of that could possibly produce such a drop is the FOMC either raising rates again or promising to raise rates in June. Even then, the BoJ would have to sit on its hands as stocks plummeted today and tomorrow — when they’re due to announce their latest brainstorm.
UPDATE: 10:22 AM
SPX just dipped below the SMA5 200, so I’ll open a short position here with tight stops in the (likely) event that it’s a head fake.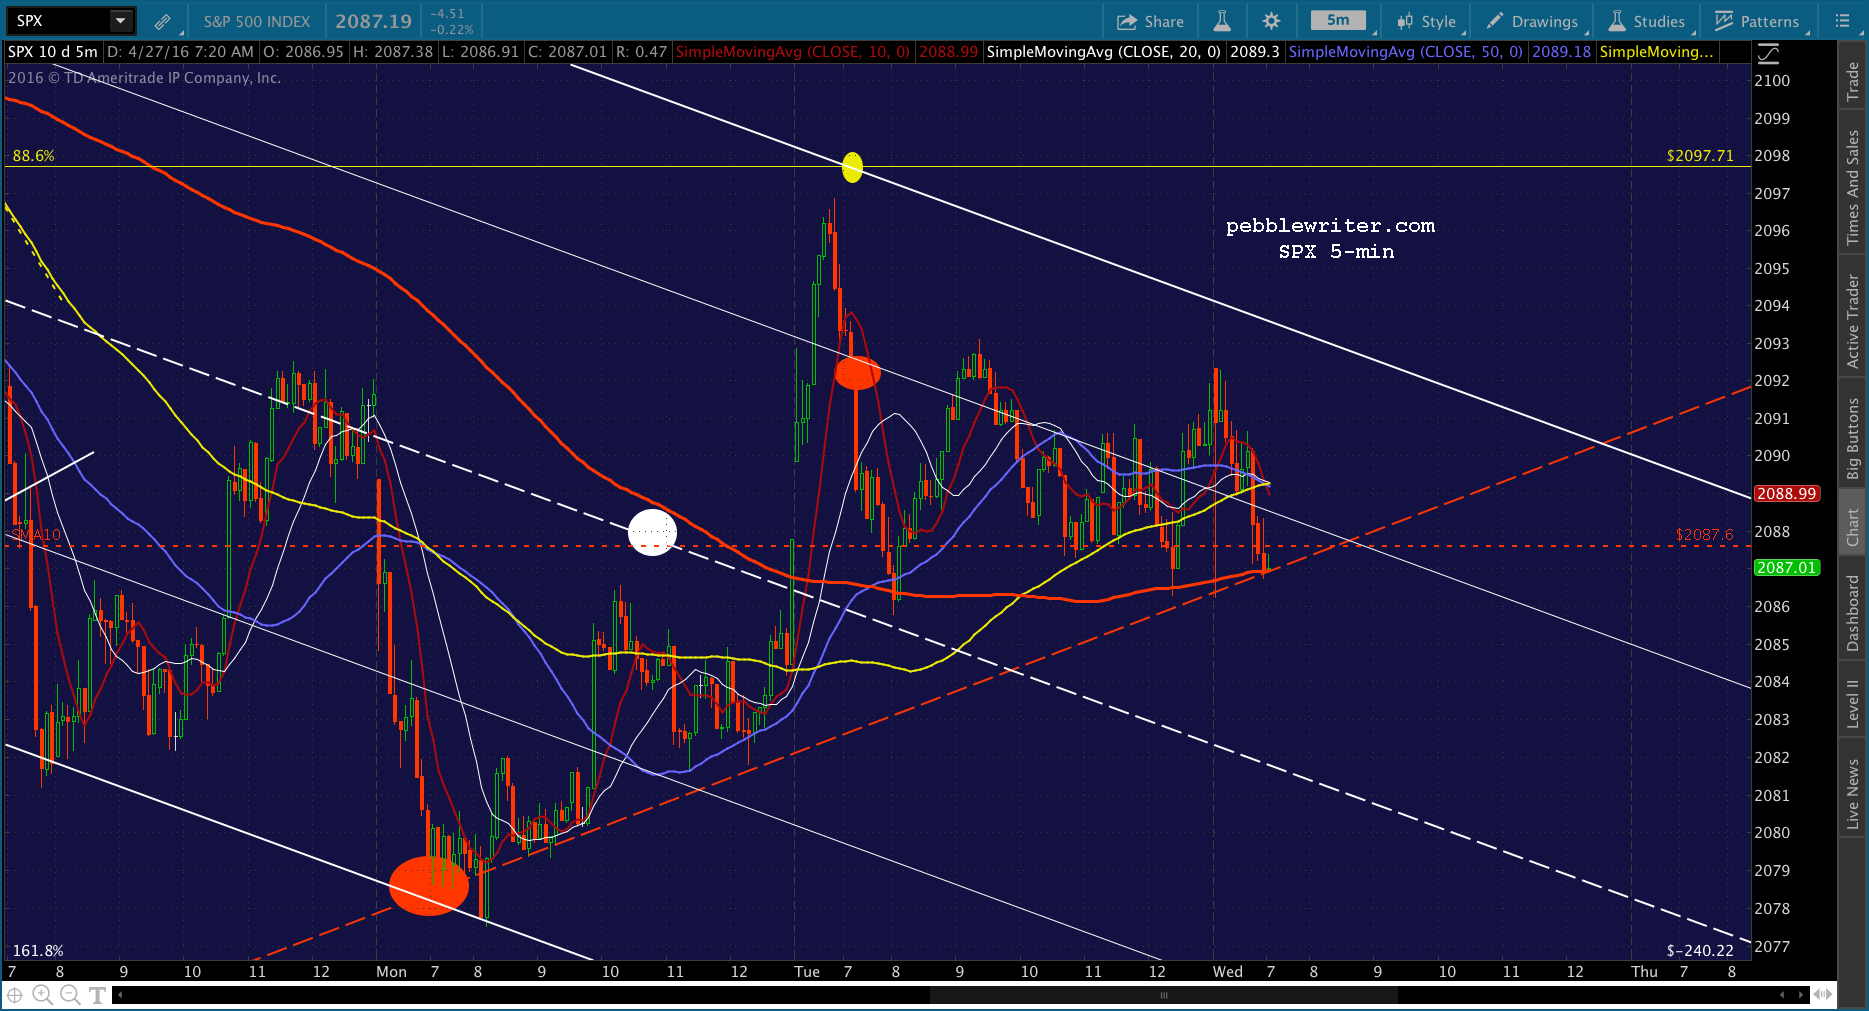 UPDATE: 10:41 AM
So, the EIA called BS on the inventory numbers API put out yesterday. That 1.1MM barrel drop just turned into a 2MM barrel build. Oops. Theoretically, CL should give up all the gains since yesterday’s errant report. I’d bet dollars to donuts that it doesn’t, at least until after the “market” closes.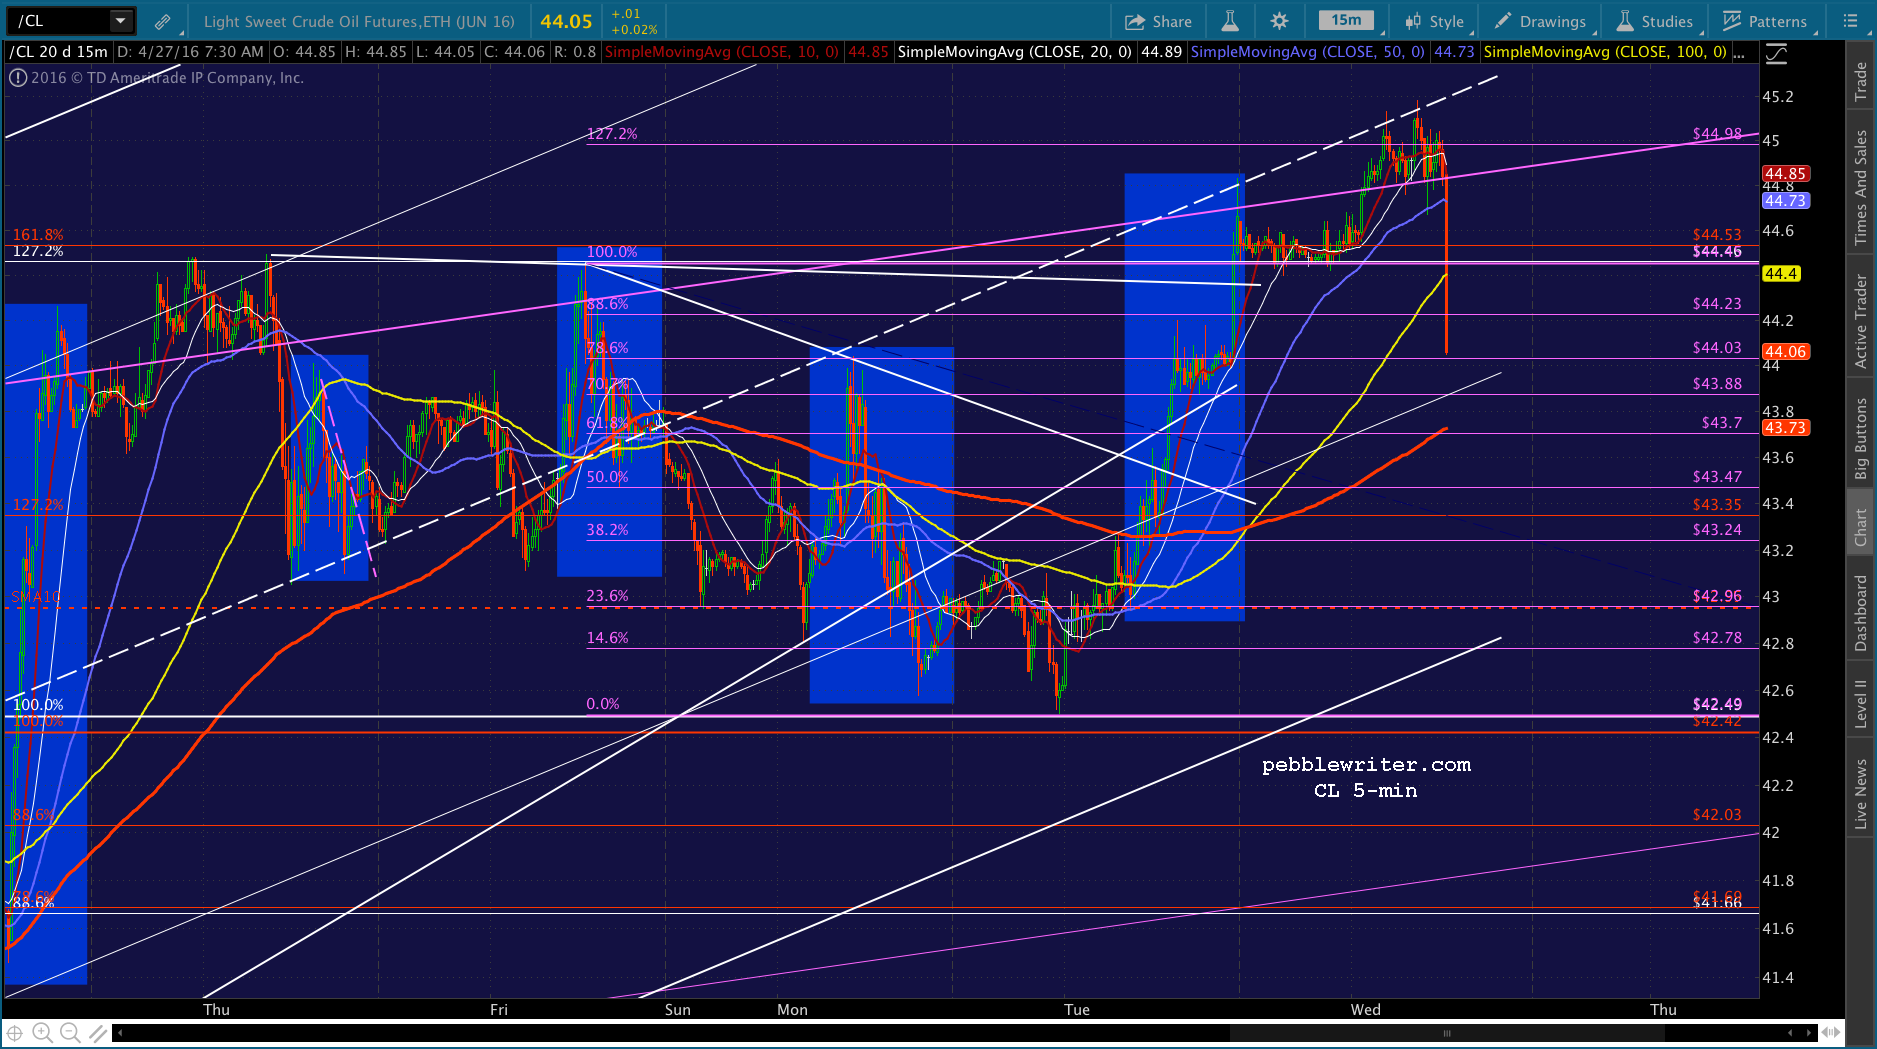 SPX shed a few points, enough to put our trade in the black.
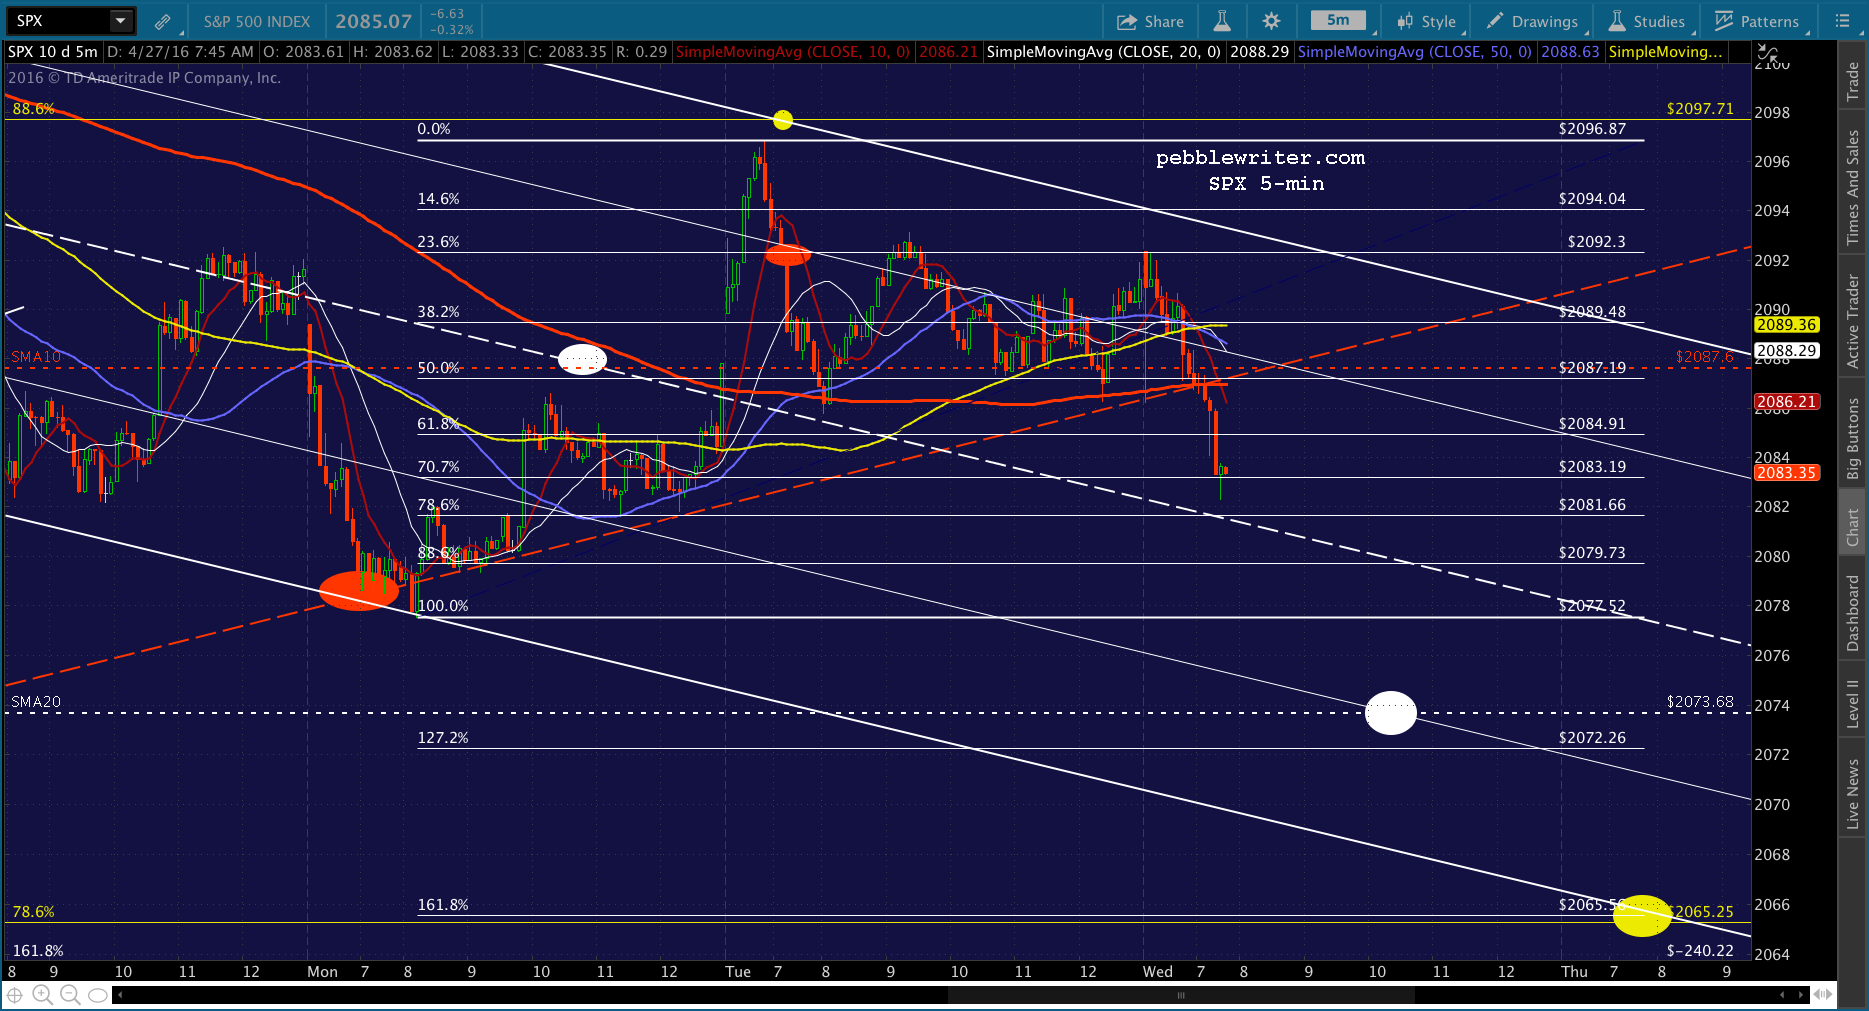 UPDATE: 11:30 AM
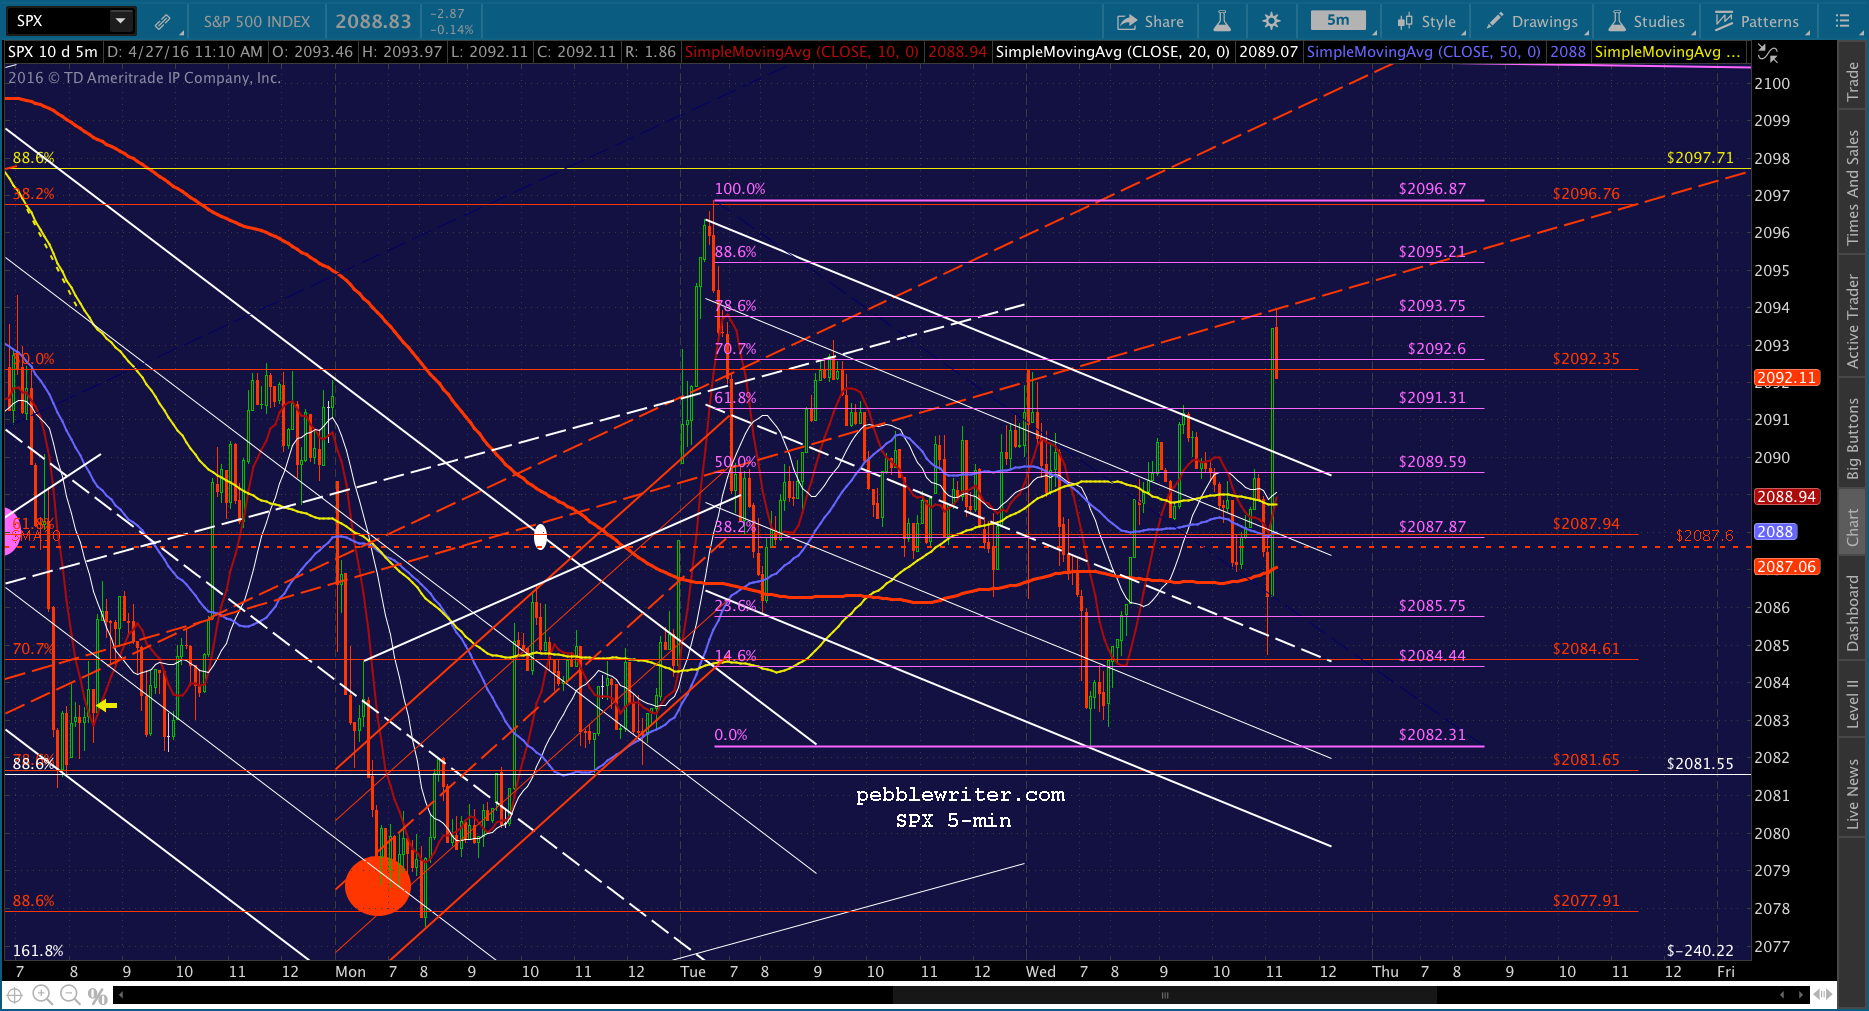
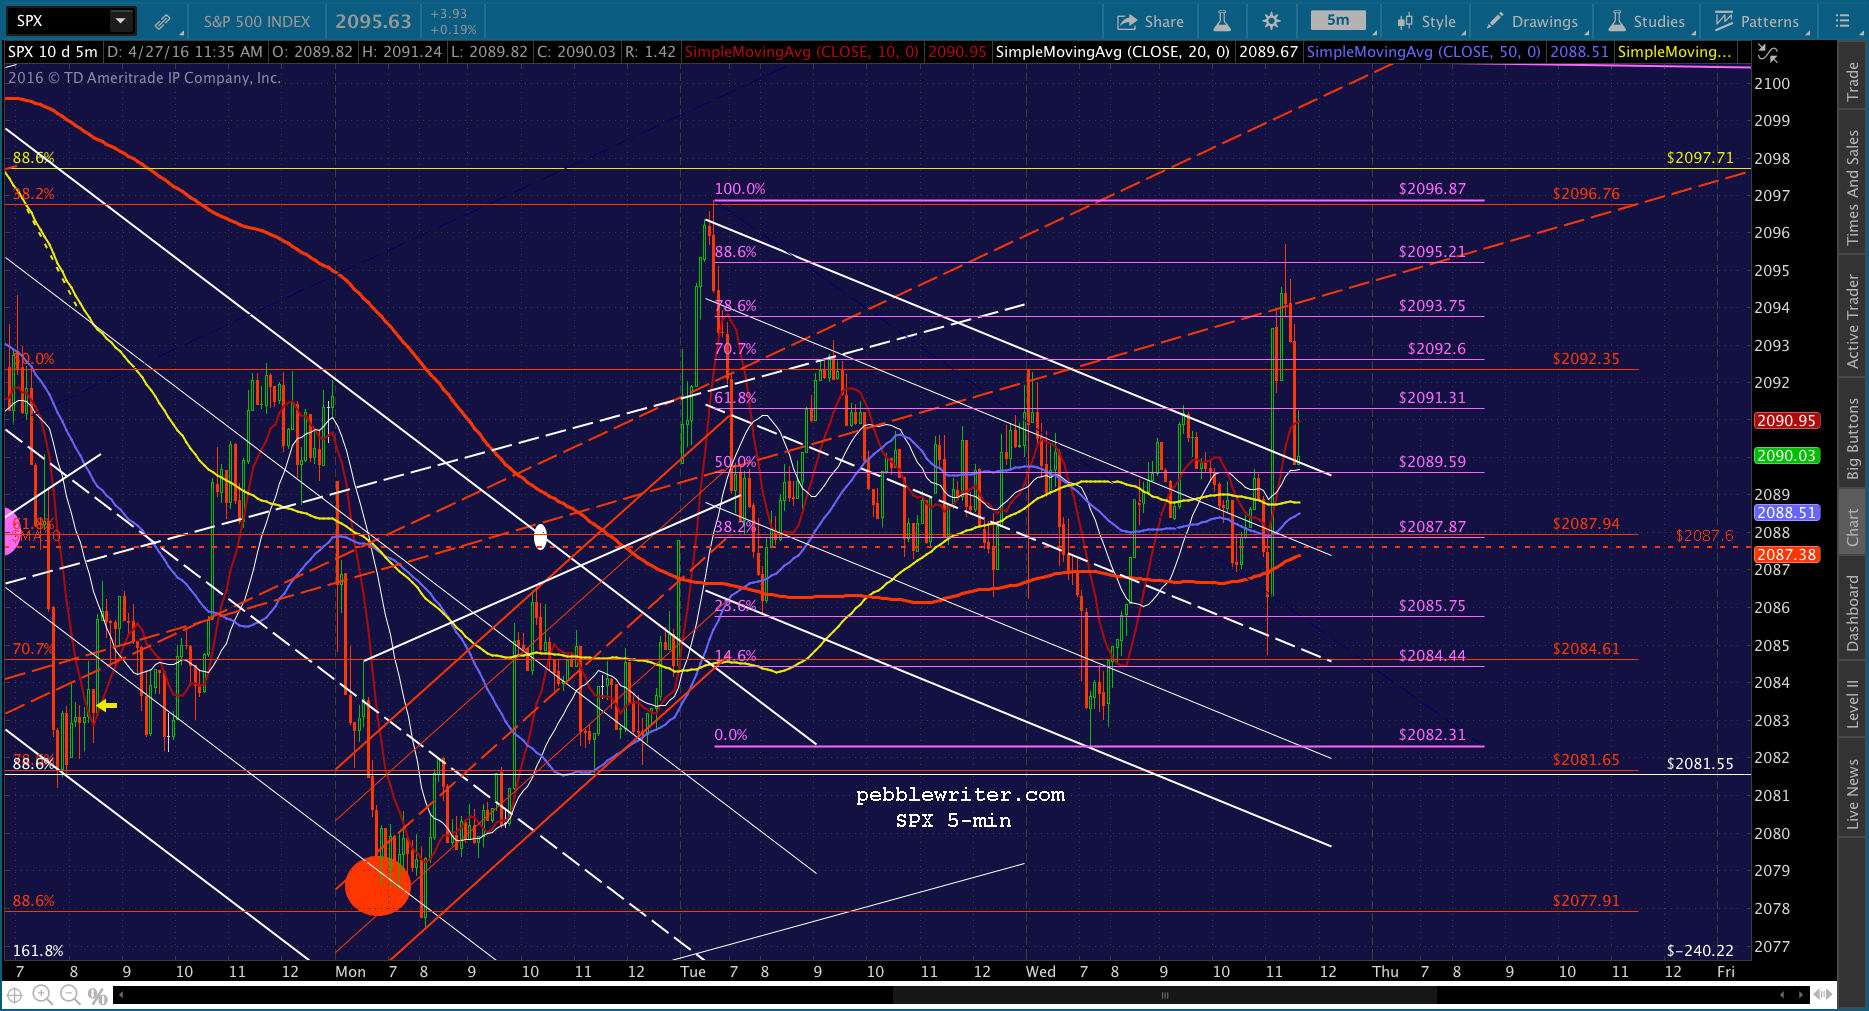
Between USDJPY and CL, SPX has fully recovered from the tip. Back to cash here at the SMA5 200 at 2087.
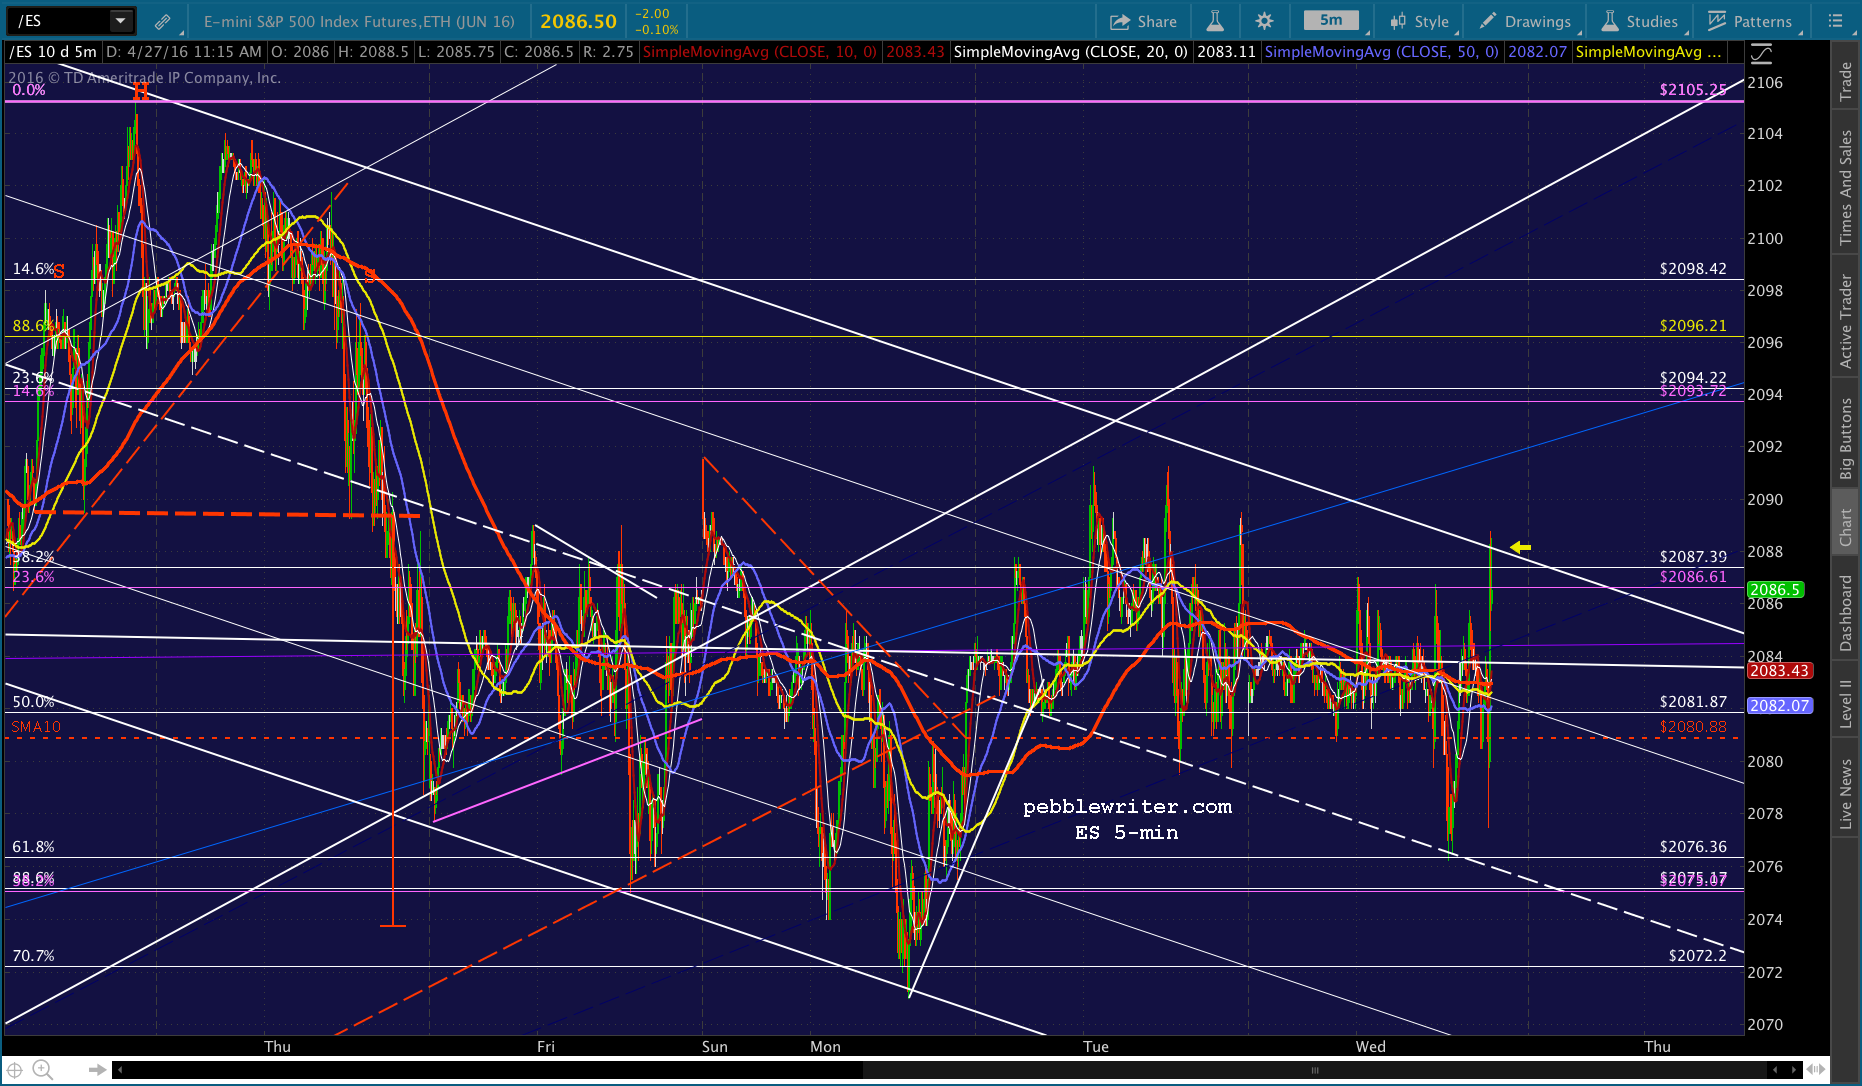
 There is an argument for SPX to reverse at the SMA5 100 at 2089.21, and it revolves around ES having reaches its SMA5 200 and .786 channel line. But, we’d need USDJPY and CL to reverse first.
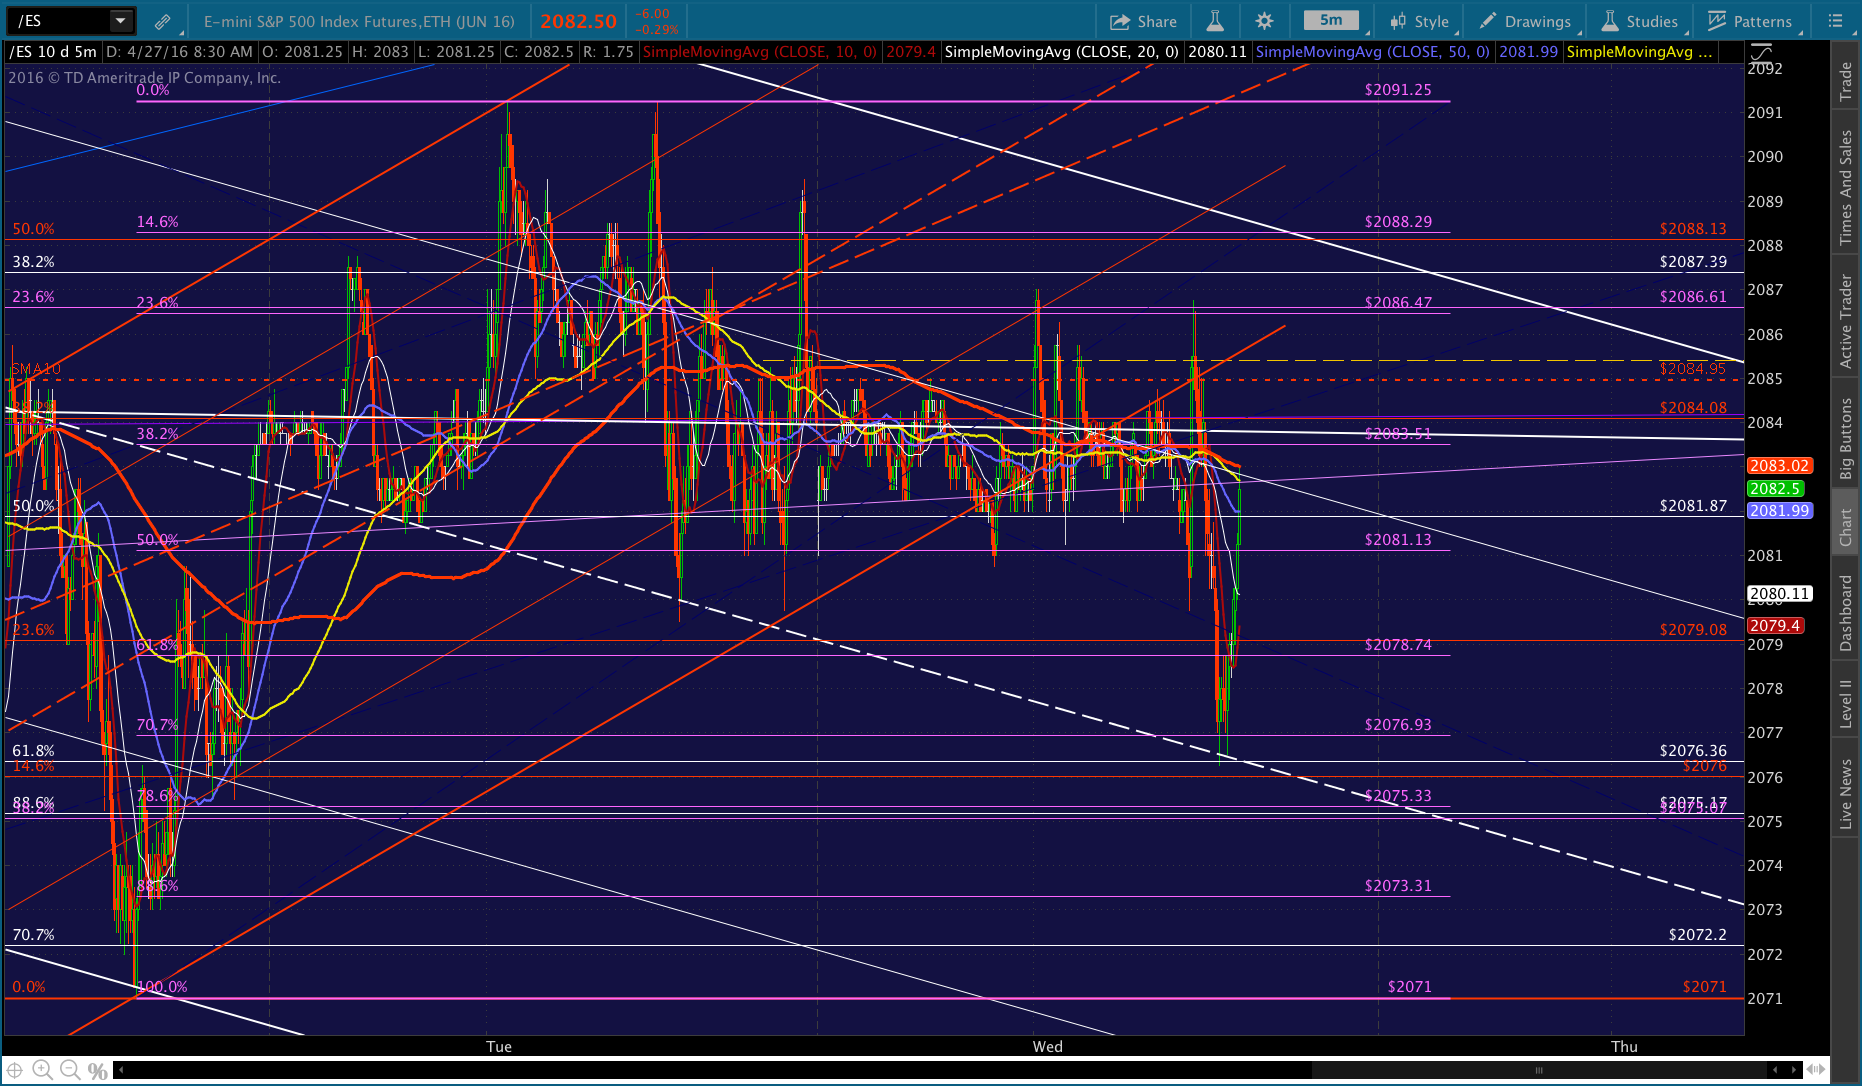 UPDATE: 11:36 AM
USDJPY is reversing back below the red TL as SPX tagged its SMA5 100. Worth a shot at another short here — with tight stops for obvious reasons. But, since SPX is back above the red midline, the odds of it playing out into something significant are much lower.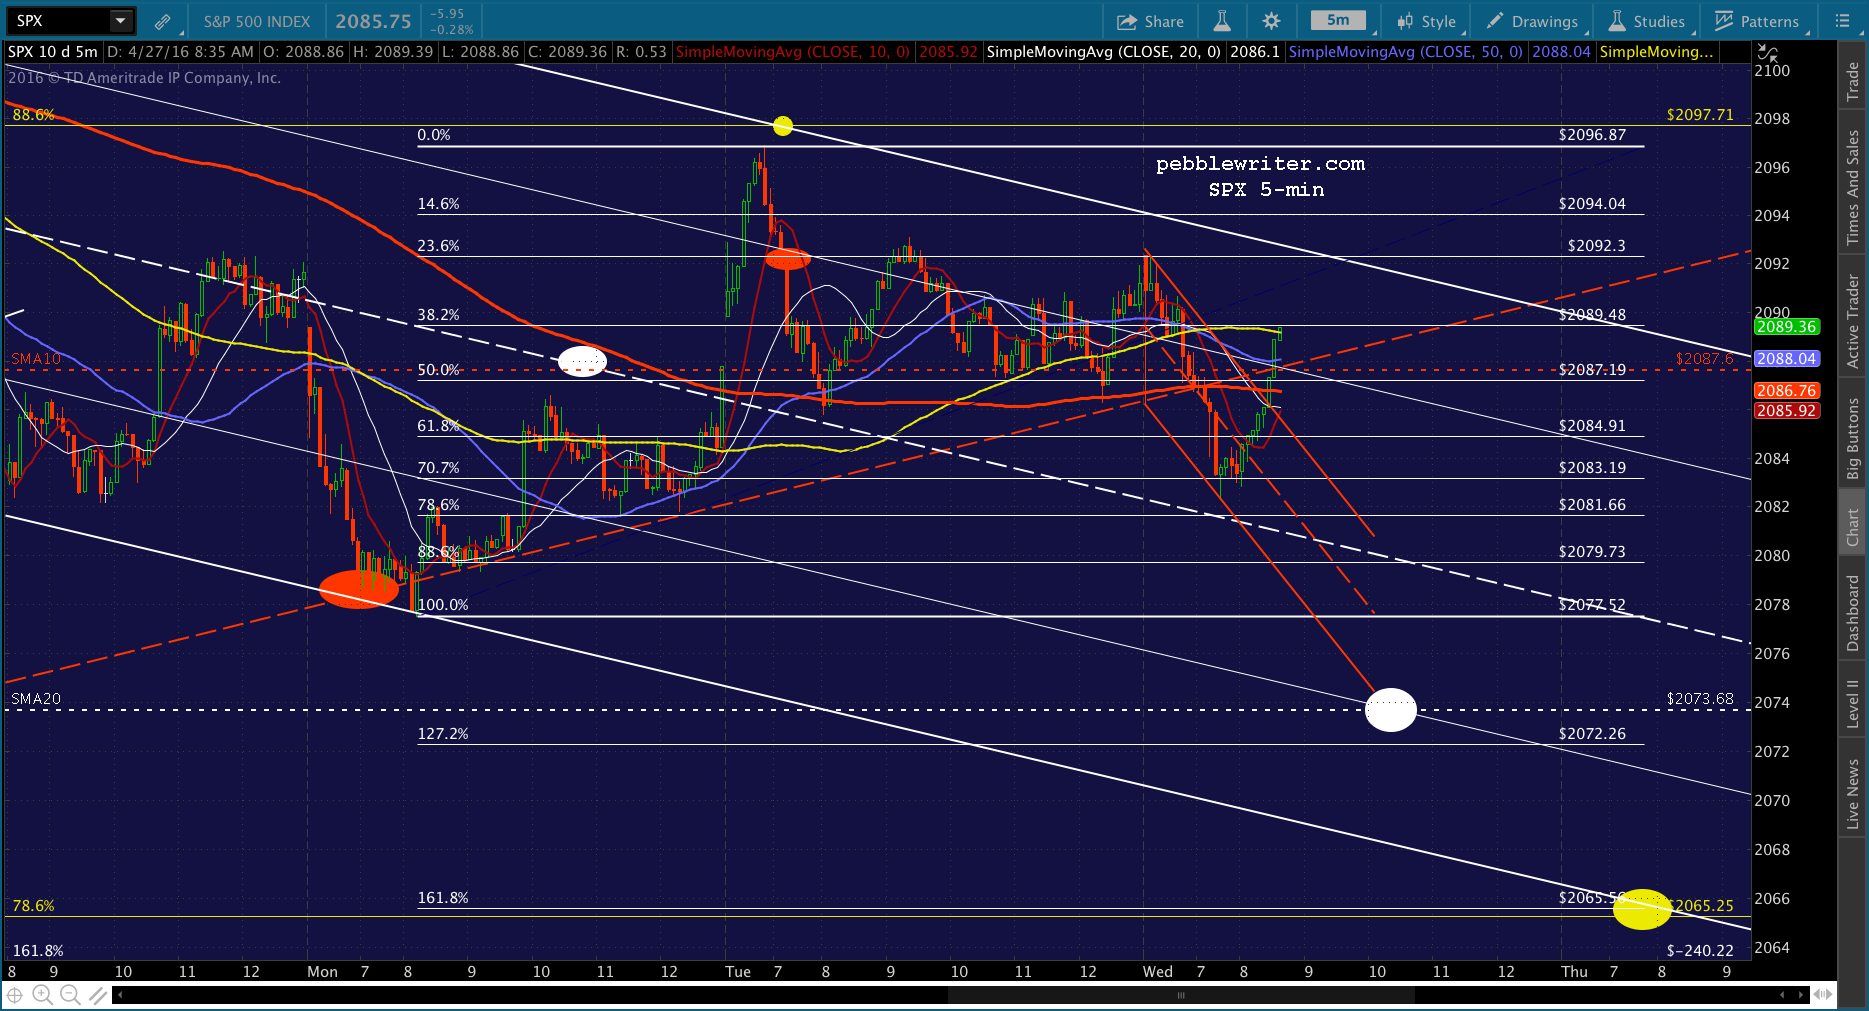 UPDATE: 12:19 PM
This is like swimming upstream. Seems as though they’re not going to allow a return to lower levels. So back to cash for the time being.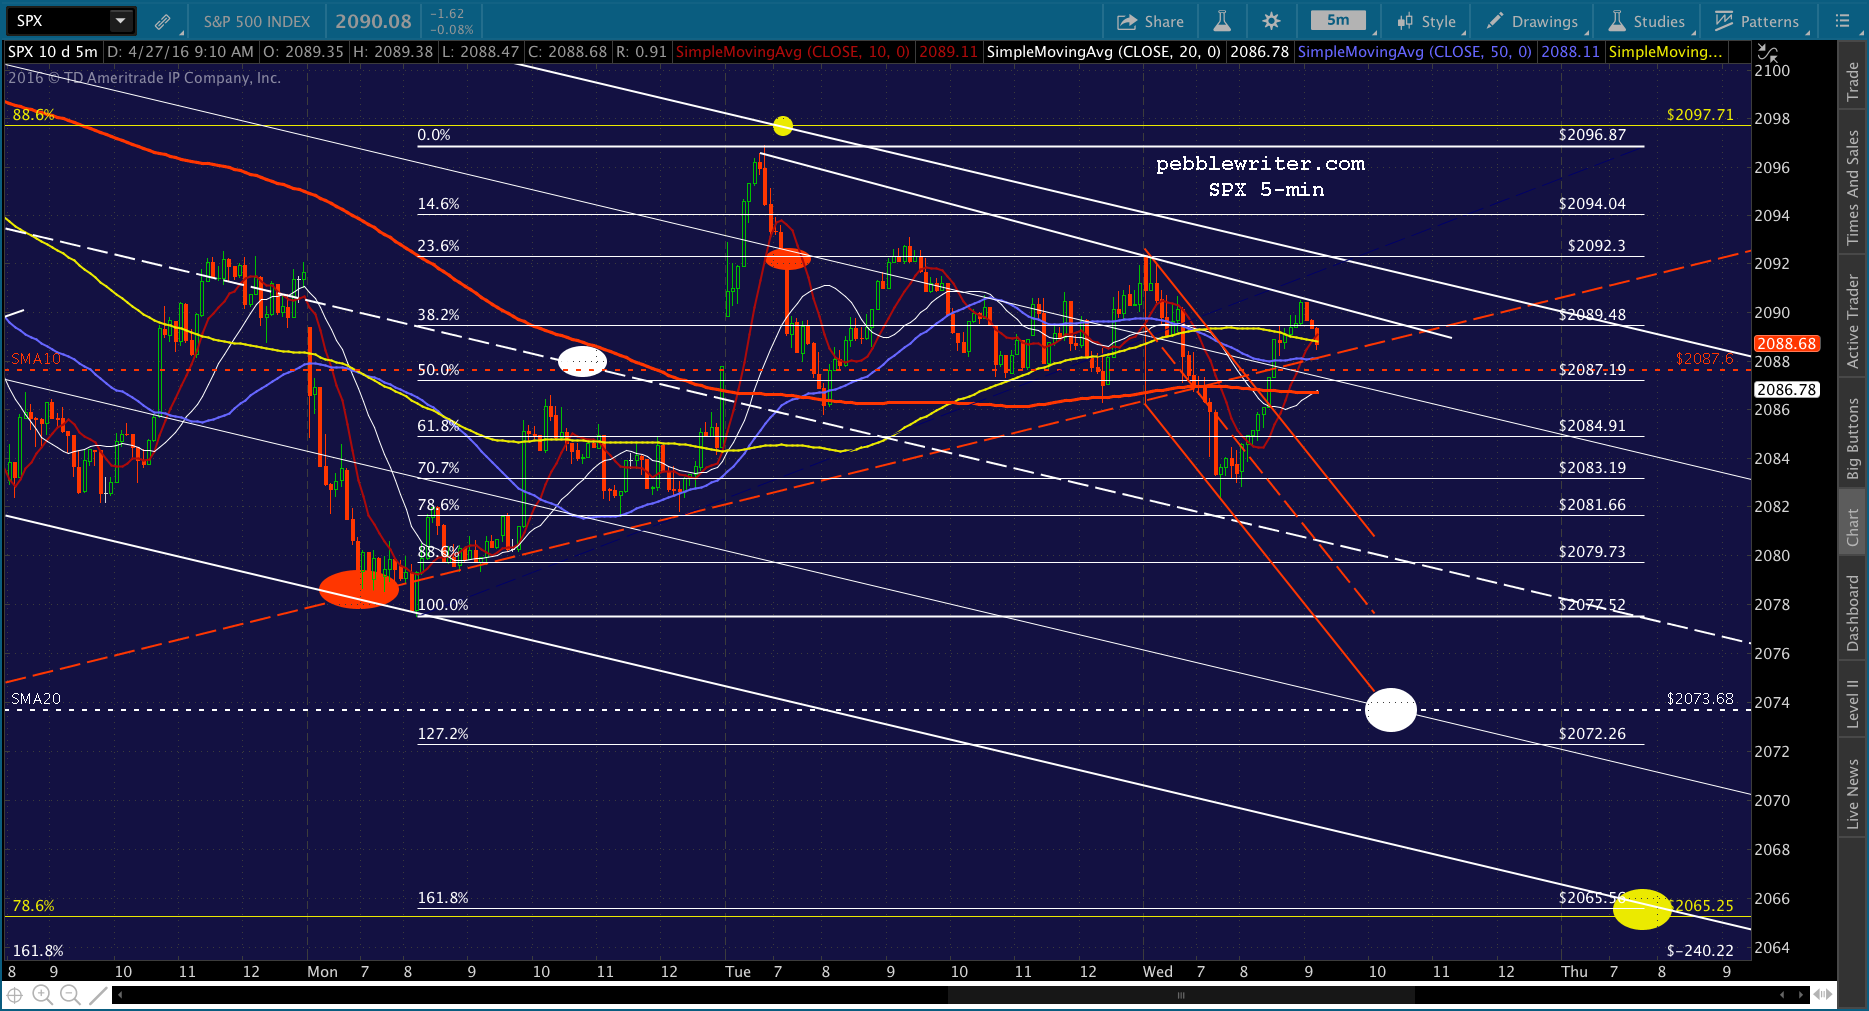 Every time SPX starts to dip, CL just inches a little higher. This could go on all day…though we should see either a breakout or breakdown after the Fed announcement.
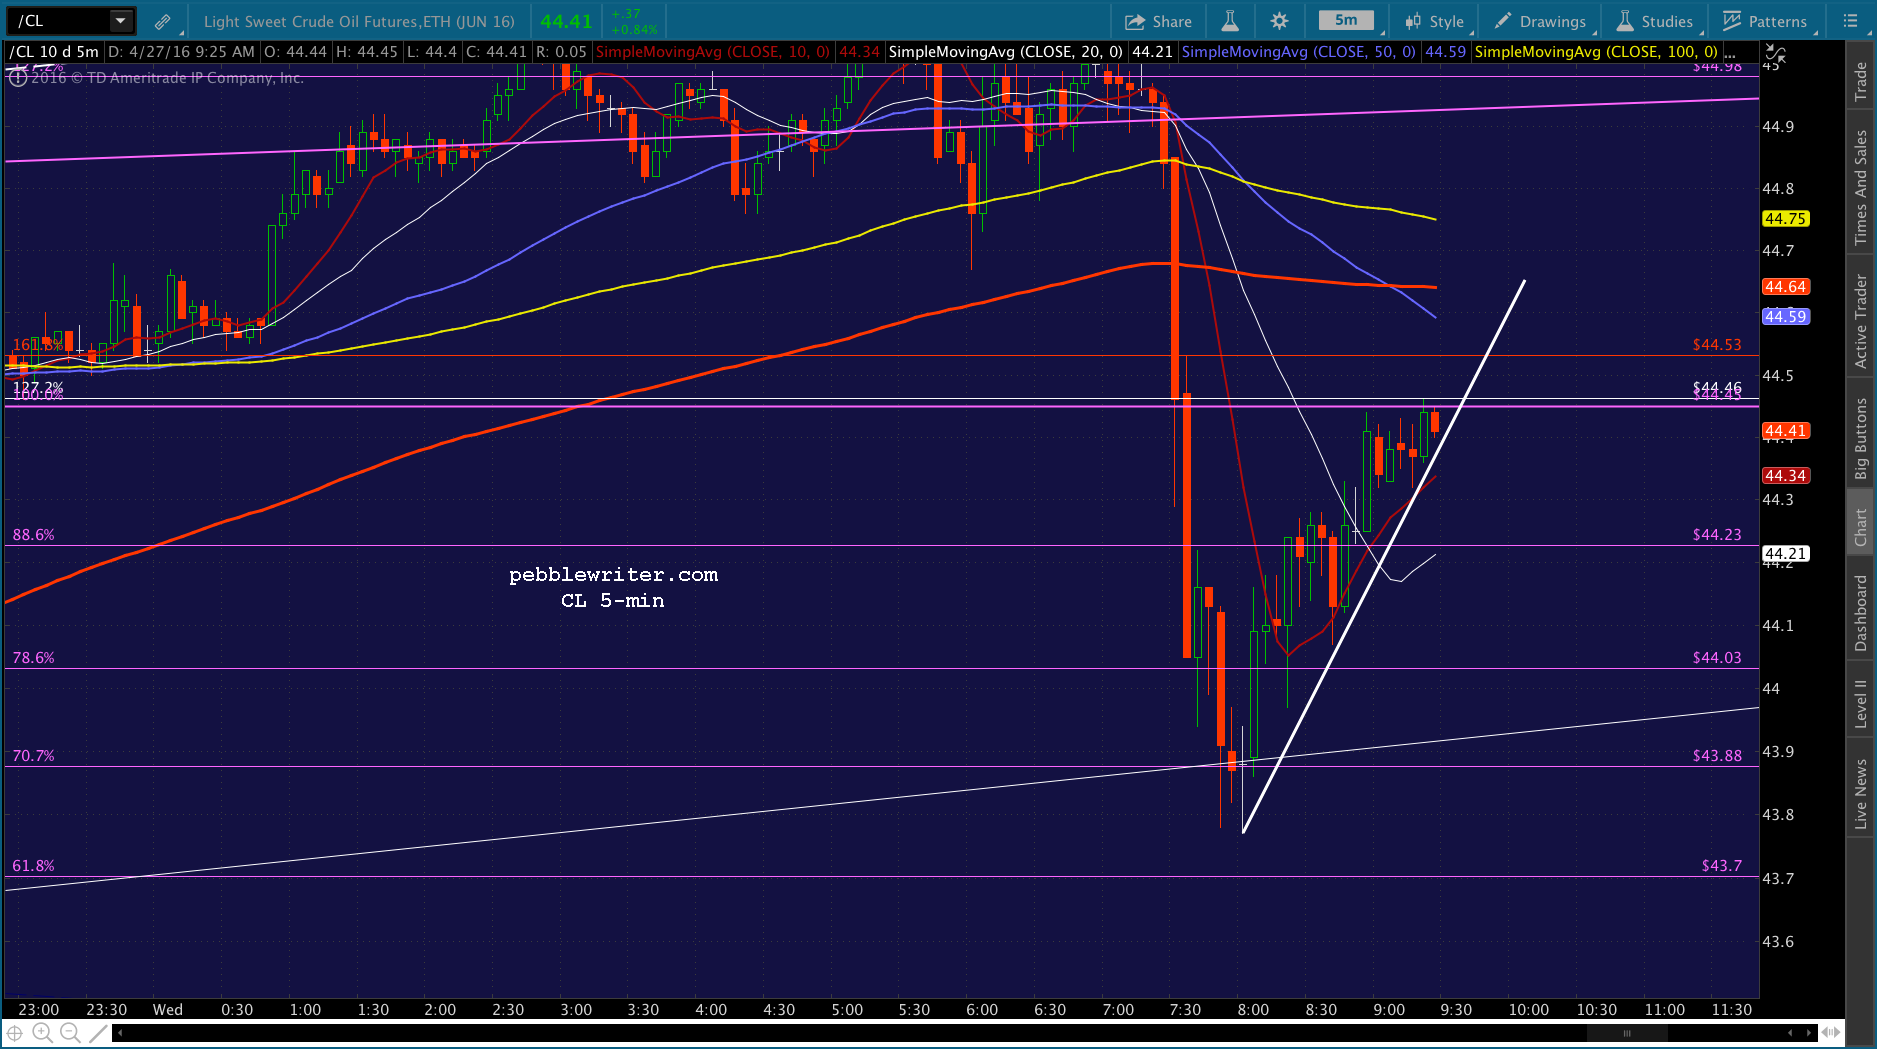 UPDATE: 1:05 PM
There’s still plenty of selling pressure on SPX, as traders aren’t buying this bounce. It’ll either drop back below the channel midline or bounce higher off of it. 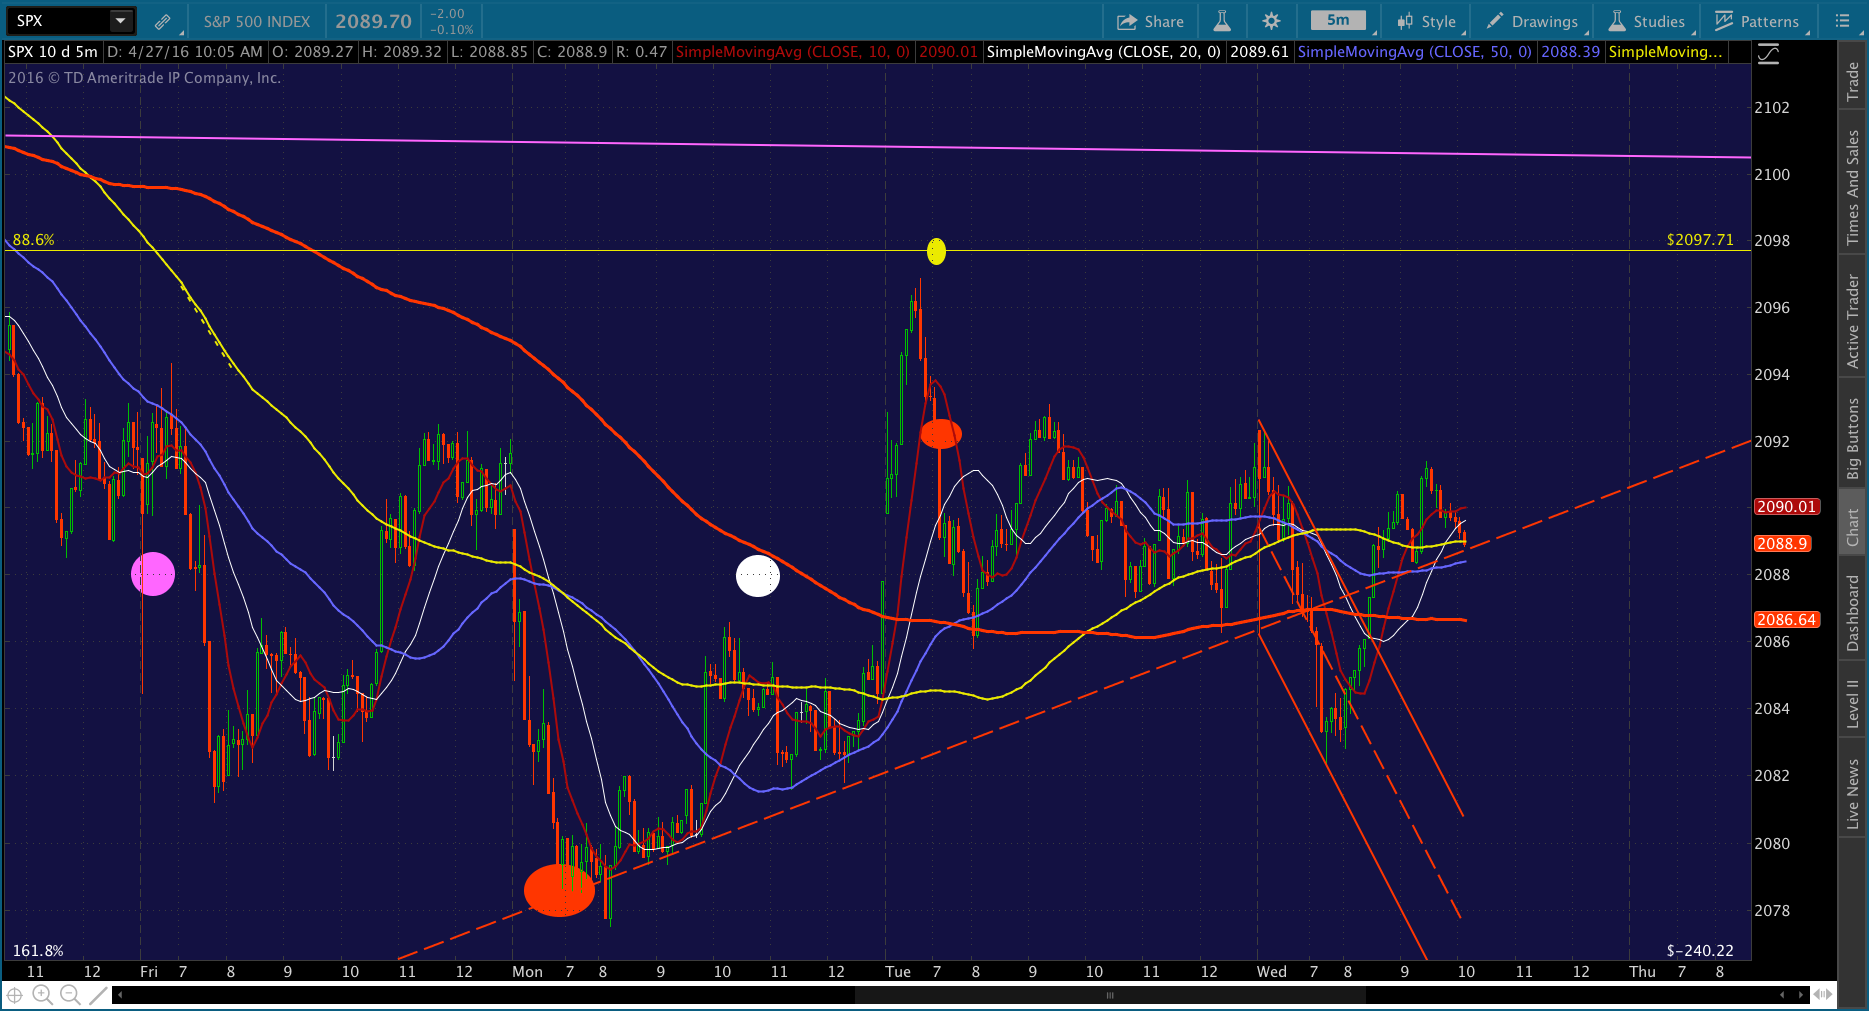 If you’re wondering what TPTB have in mind, take a look at CL, which is all the way back to the price it was at before yesterday’s bullish inventory numbers were revealed to be a crock. New highs, anyone?
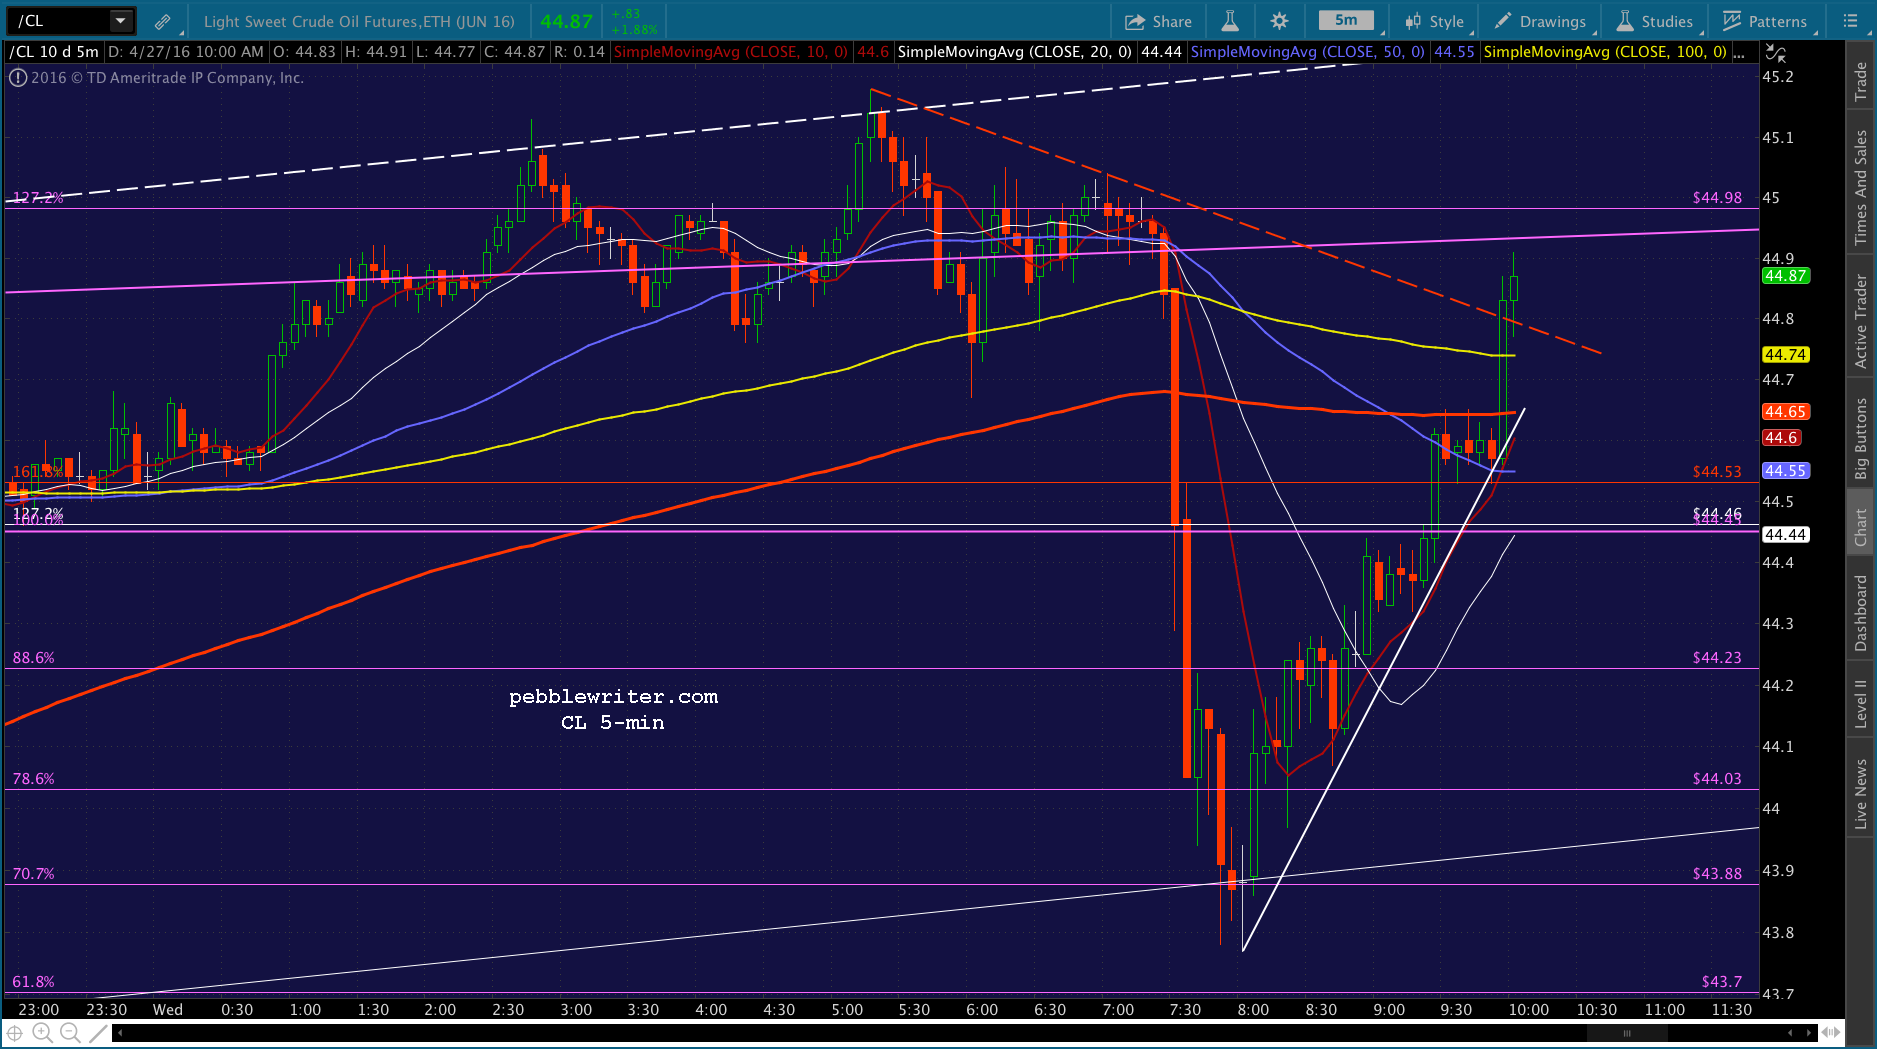 And, just in case that rebound isn’t very believable (not even close), USDJPY has broken out of the red TL and will likely break above the purple TL too.
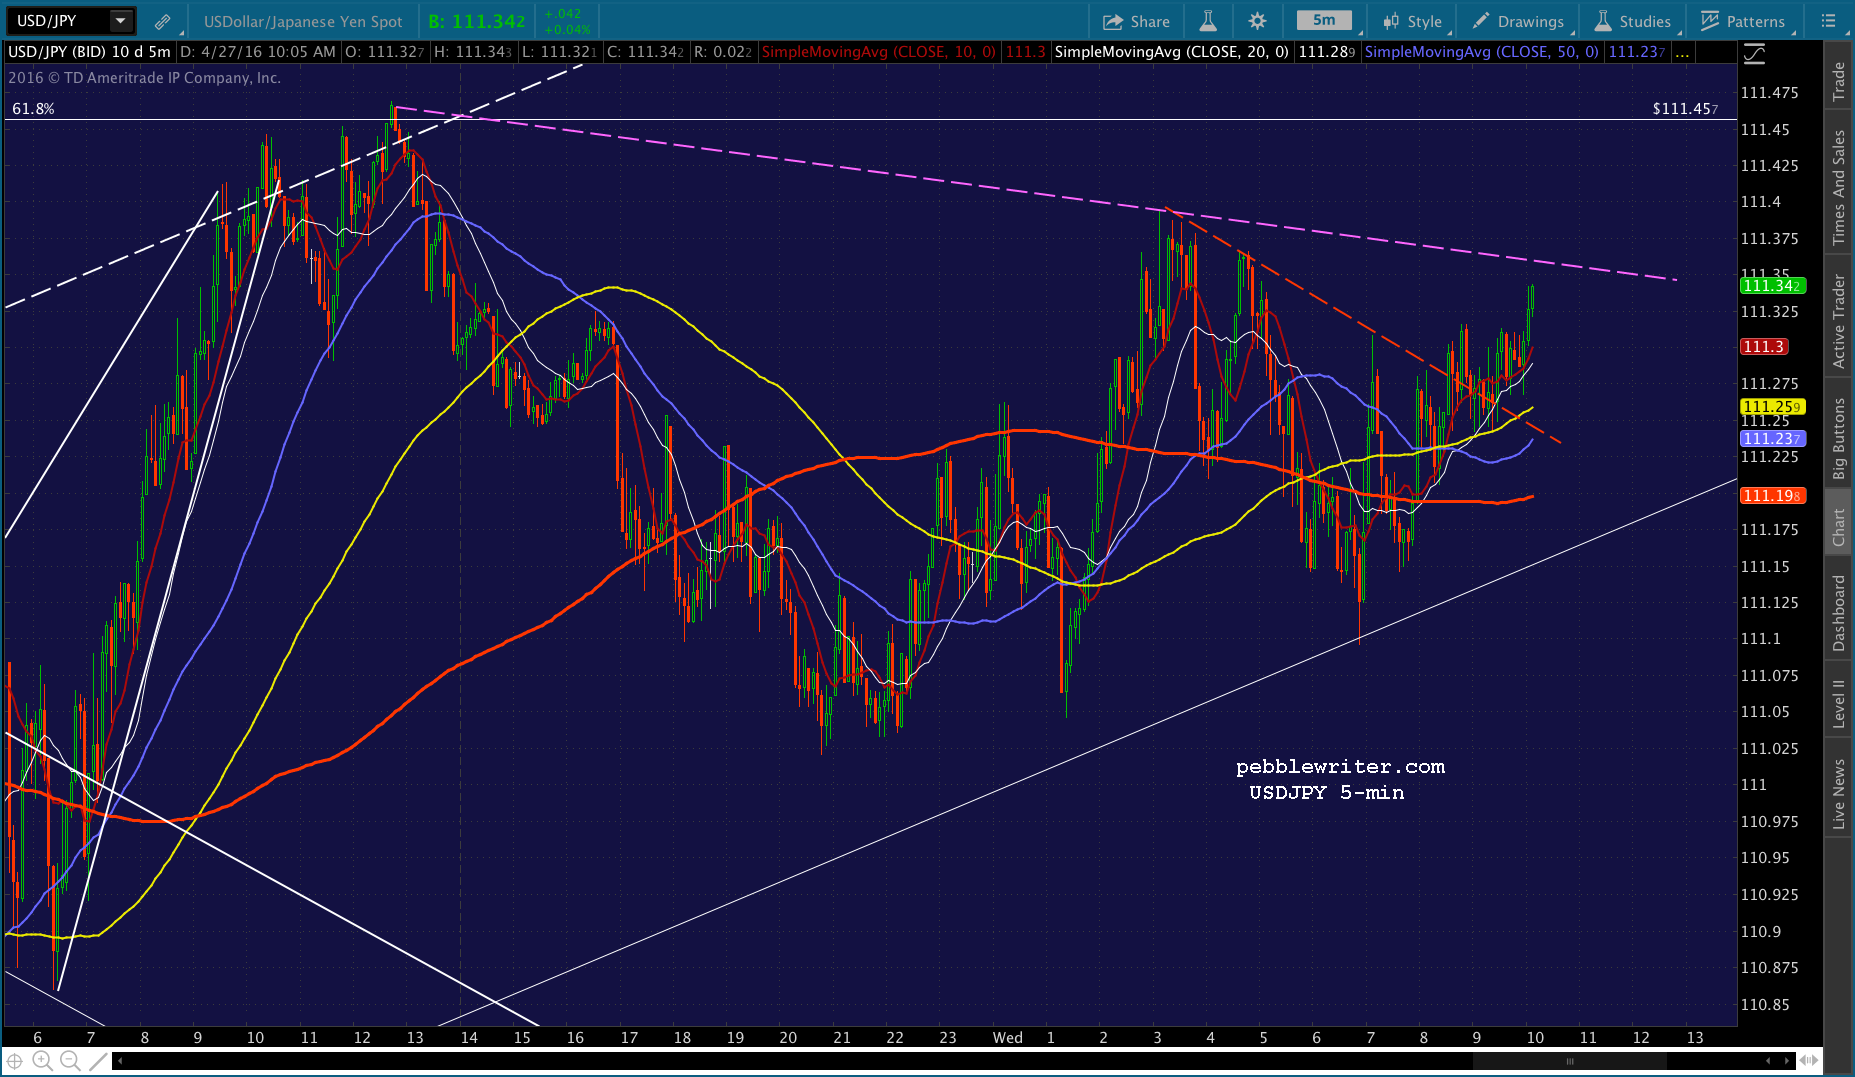 UPDATE: 1:20 PM
SPX is breaking below the red midline again, and USDJPY and CL have backed off their breakouts. I’ll take another crack at a short here, very tight stops again — 2089 ought to do it. And, watch out for the SMA5 200 at 2086.60ish. With CL and USDJPY positioned as they are, it’d be very easy to defend that level.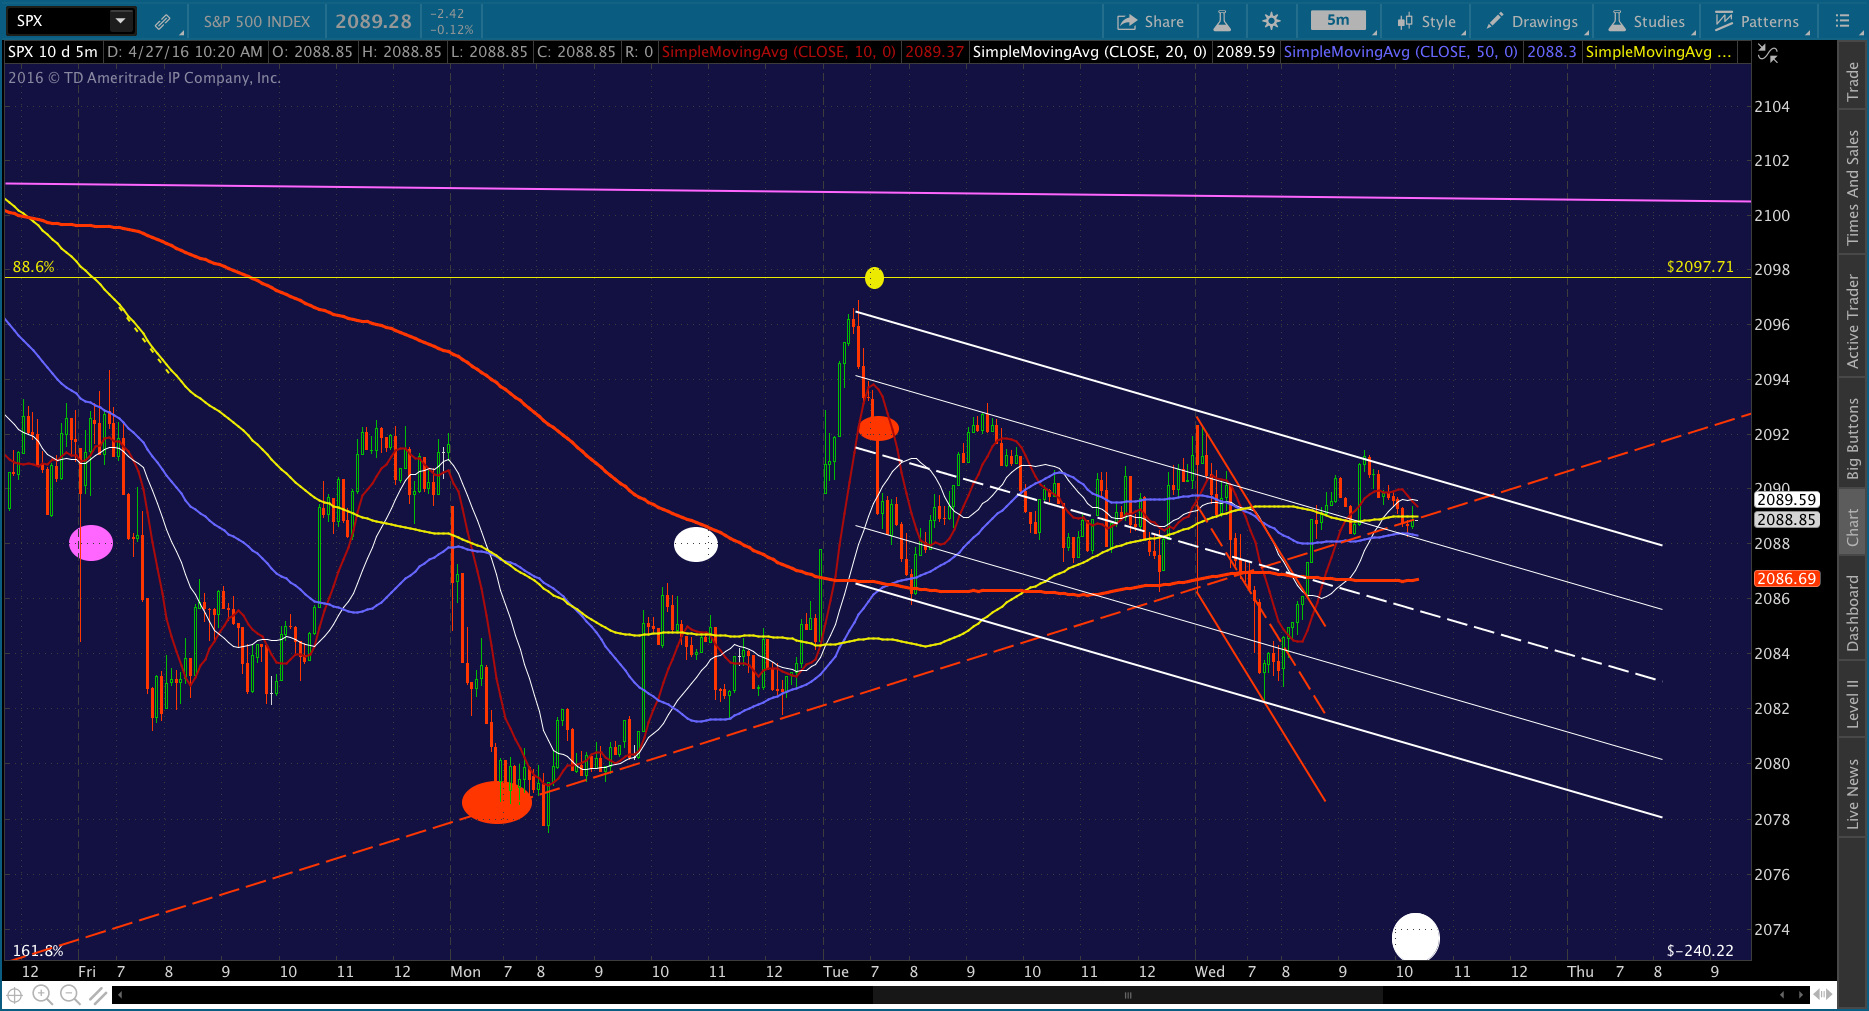

UPDATE: 1:46 PM
USDJPY is breaking out again, so it’s back to cash here at 2089.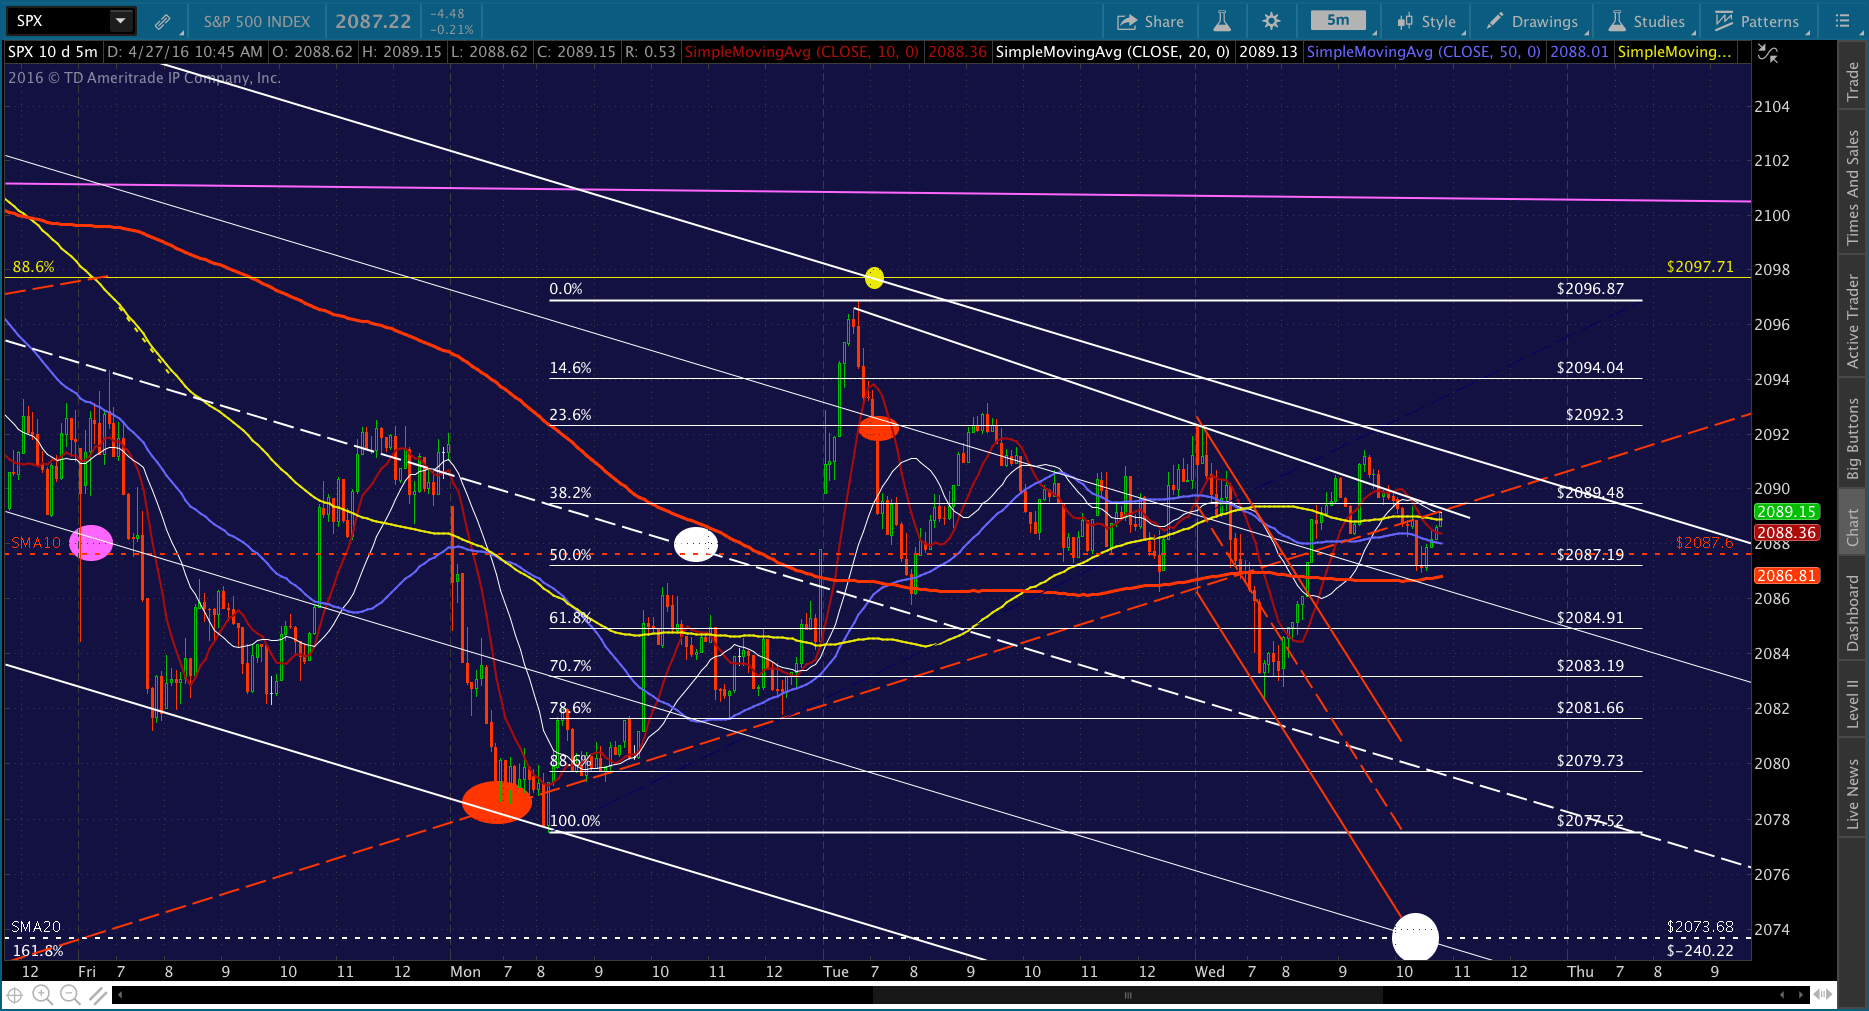

Back to Big Picture:
Now, to finish what I had wanted to talk about today, note that the big picture is mostly bearish. This, of course, makes sense. Earnings have sucked, as has the macro picture. The only things keeping stocks from dropping are the daily ramp jobs in CL and USDJPY. At some point, investors might even notice and reject the idea of staying long on such a ridiculous basis.
Last May’s highs backtested a rising channel midline that was broken way back in Aug 2008. Theoretically, SPX should test the bottom of this channel, which is currently below 900. That, of course, ain’t gonna happen. At least, not if TPTB can help it.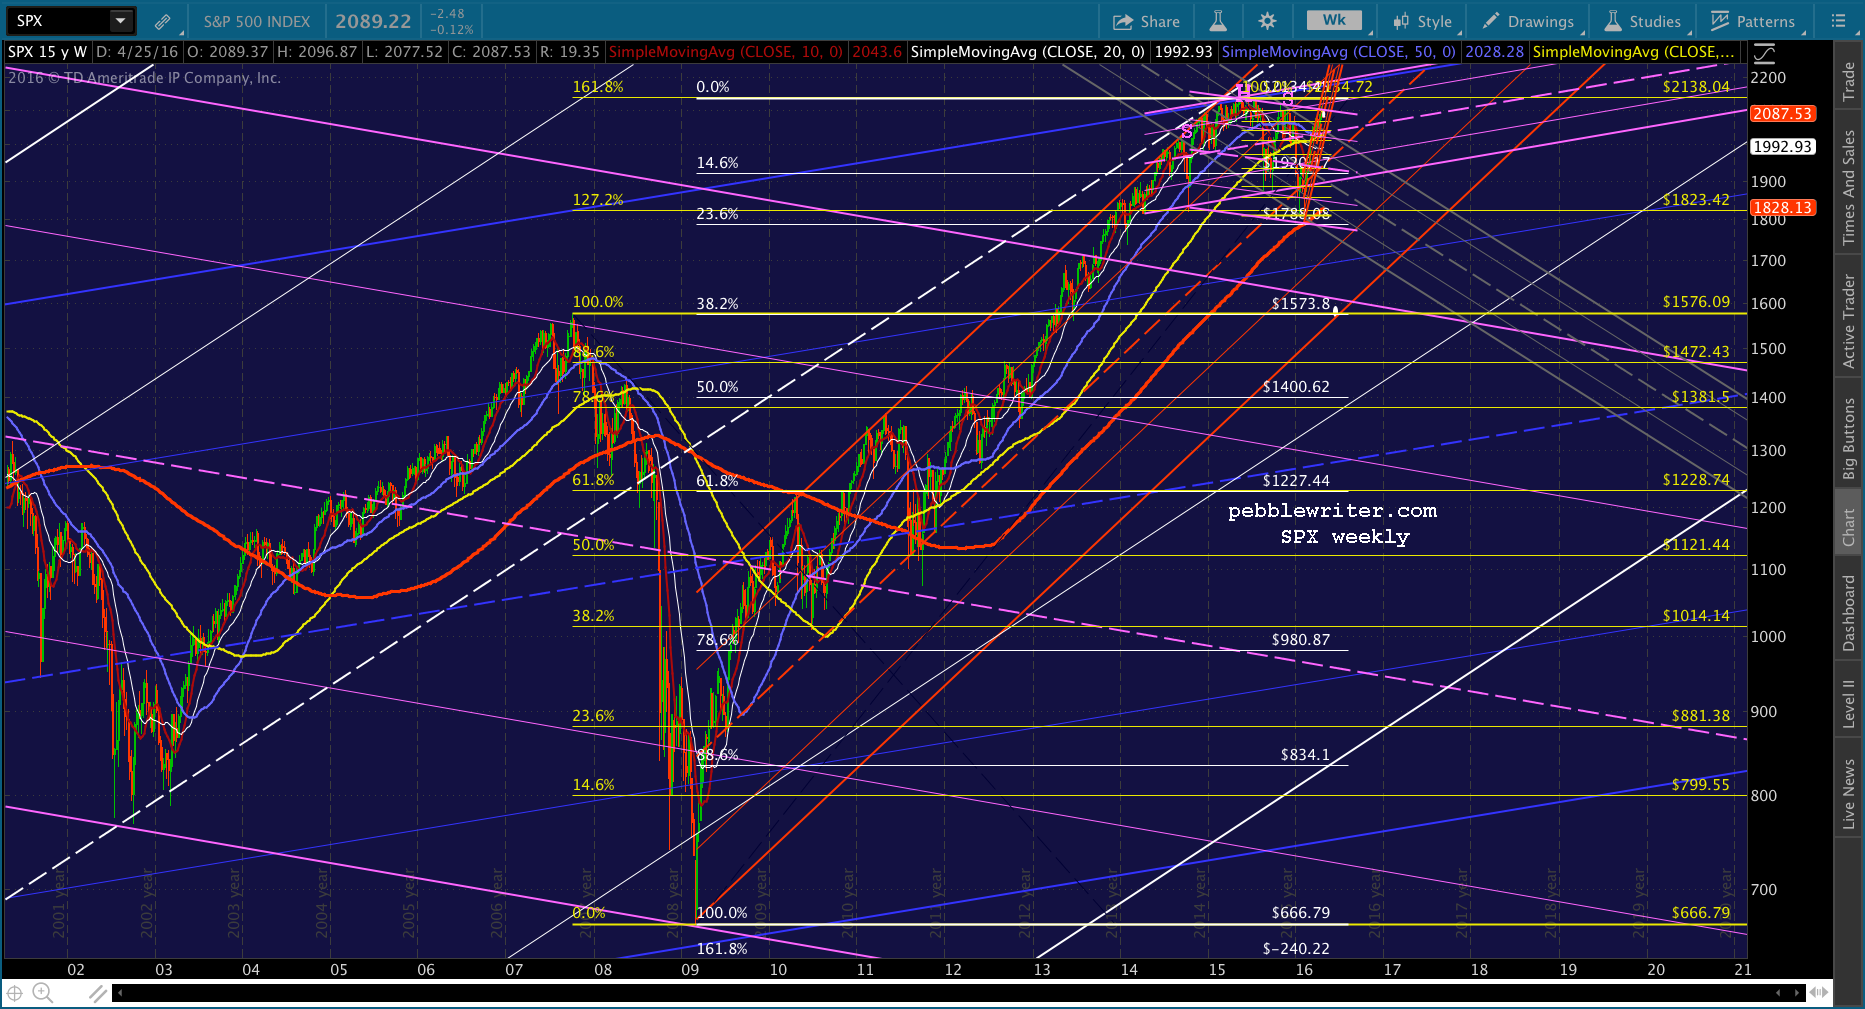 Instead, they were able to establish a rising red channel off the 2009 lows and keep prices above the midline of said channel for all these years, until this past January.
 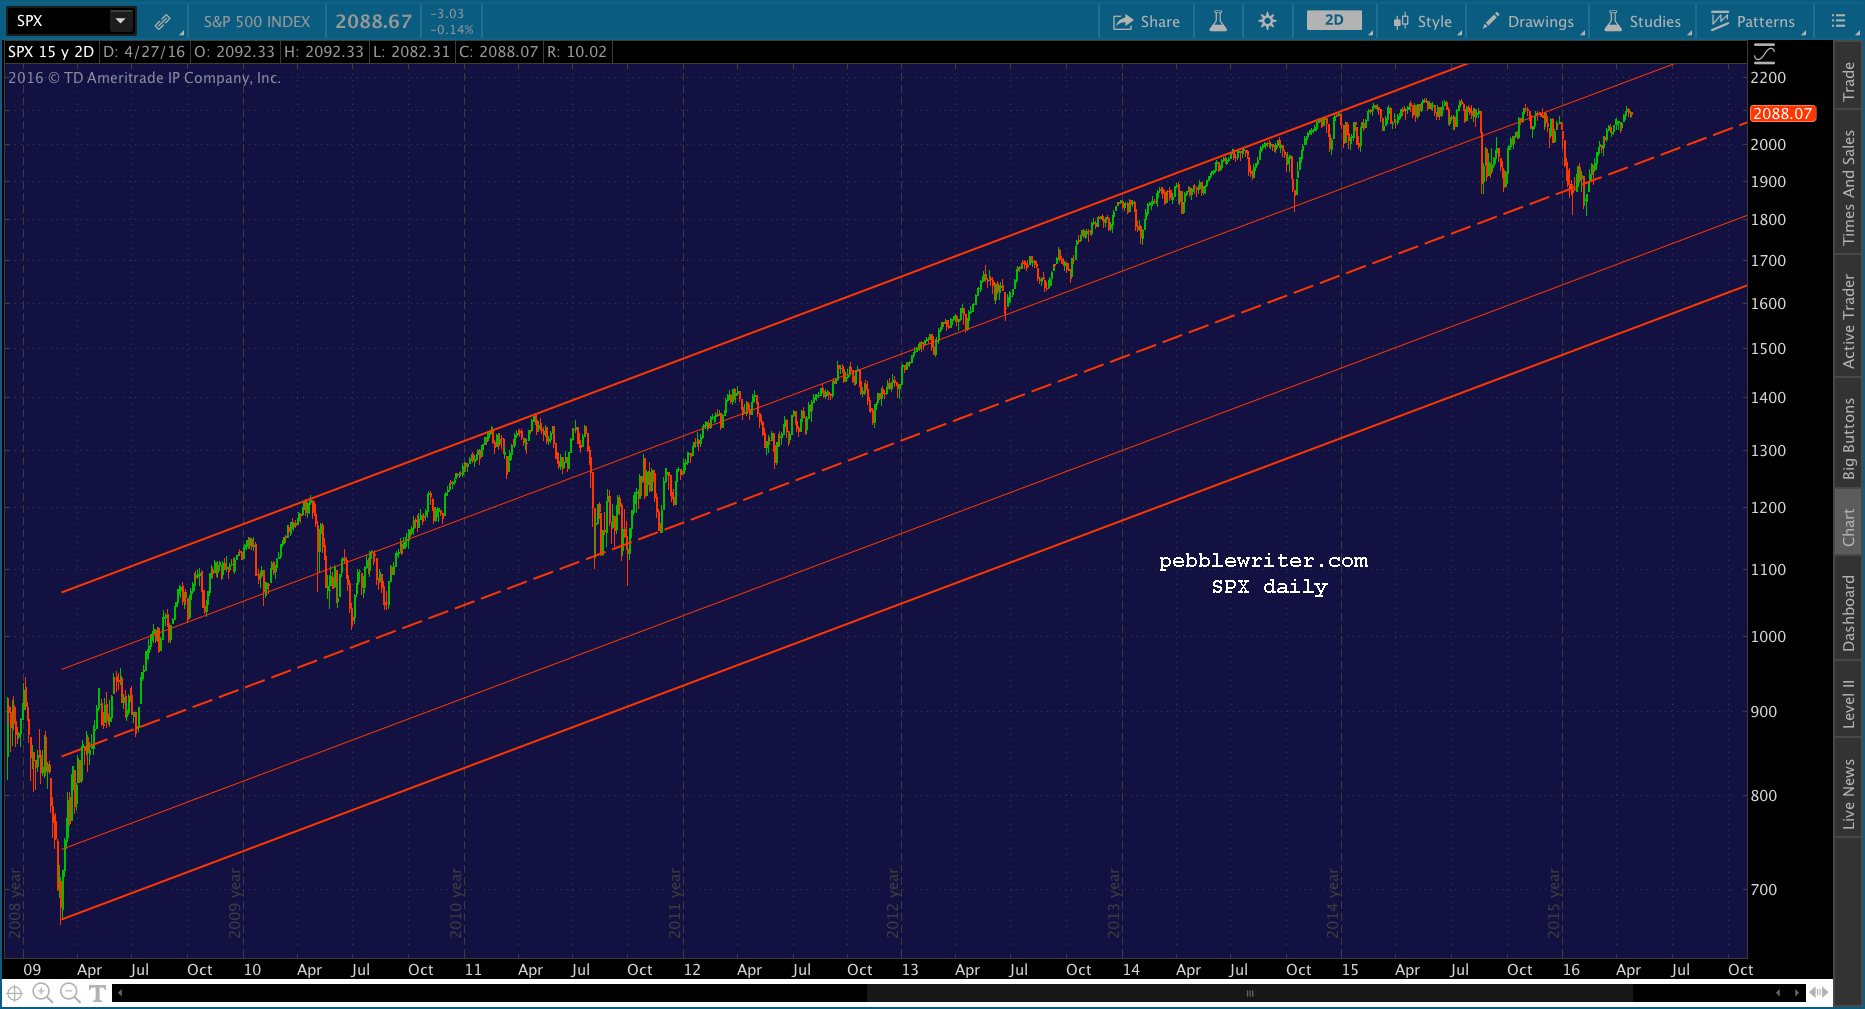 SPX could have held at the bottom of the rising purple channel and prevented that big H&S Pattern from playing out, but it didn’t. It broke down, and was only rescued at the 1.272 Fib at 1823 again by a 25% bounce in CL, accompanied by a 5% bounce in USDJPY.
 SPX bounced 135 points in 8 sessions, only to fall back to an even lower low 8 sessions after that. It was accompanied by an even lower low by CL, which then proceeded to bounce an astounding 72% on a series of rumors and lies, every single one of which has been proven to be false.
UPDATE: 1:59 PM
Shorting here on the latest drop through the SMA10.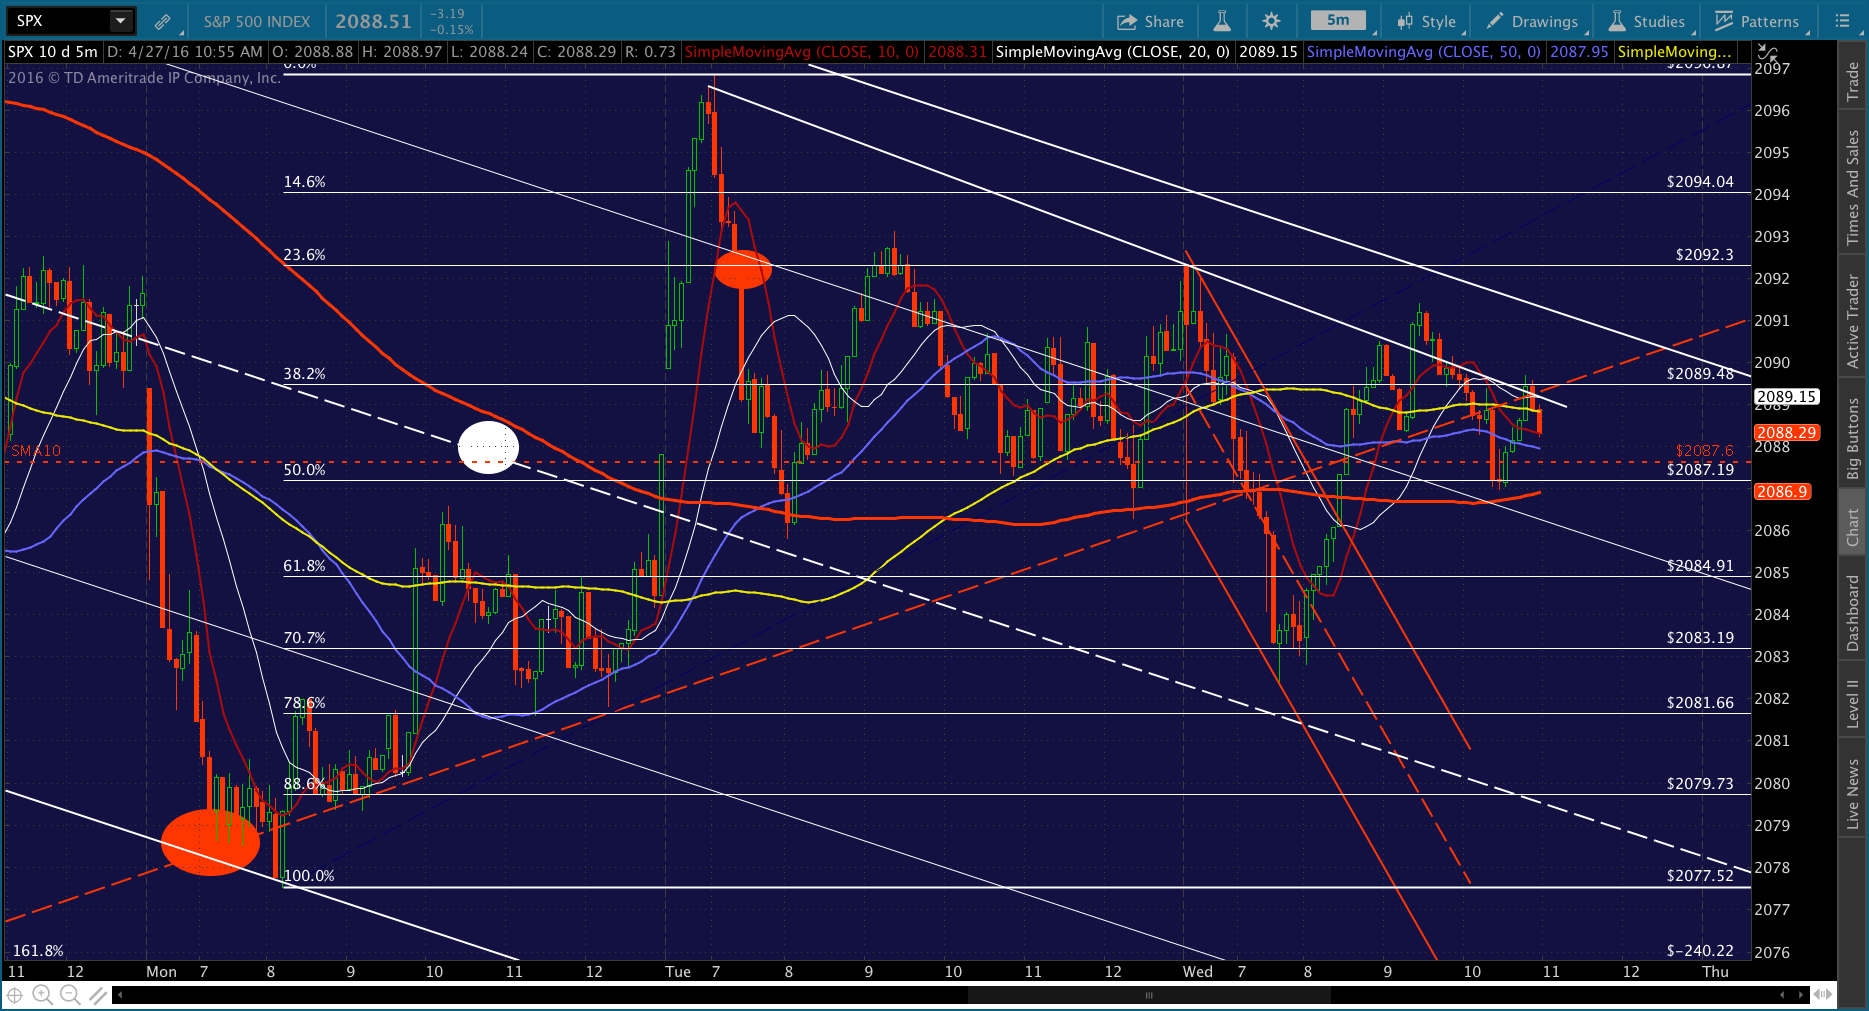 Think or Swim just froze up on me, so watch your stops as I try to reboot it.
UPDATE: 2:08 PM
Just got it back up and see that USDJPY and CL both spiked, stopping out the short. Back to cash at the SMA10 at 2087.60. Updated charts in a sec…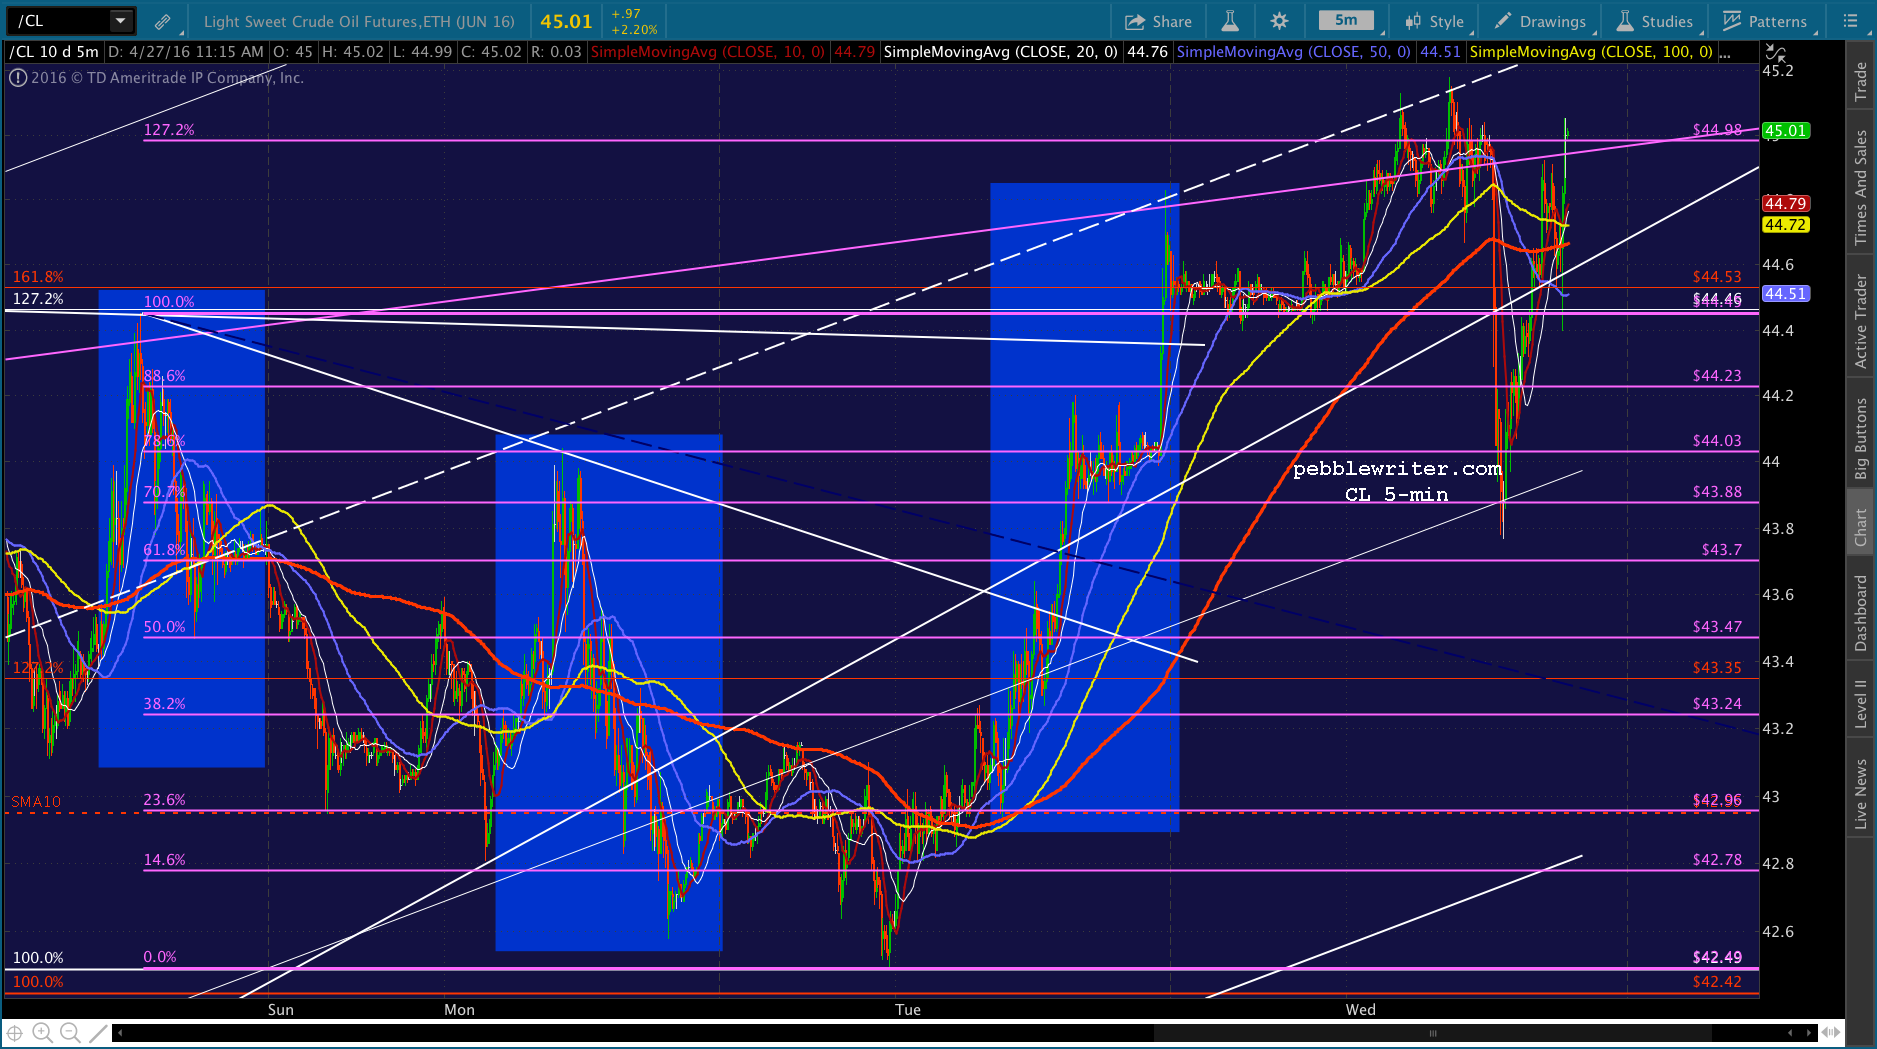

2:18 PM
We might ordinarily expect the Gartley in SPX to produce a reversal here, but CL just hit new highs. So, it’s likely we’ll see ES break out enough to discourage any additional selling in SPX.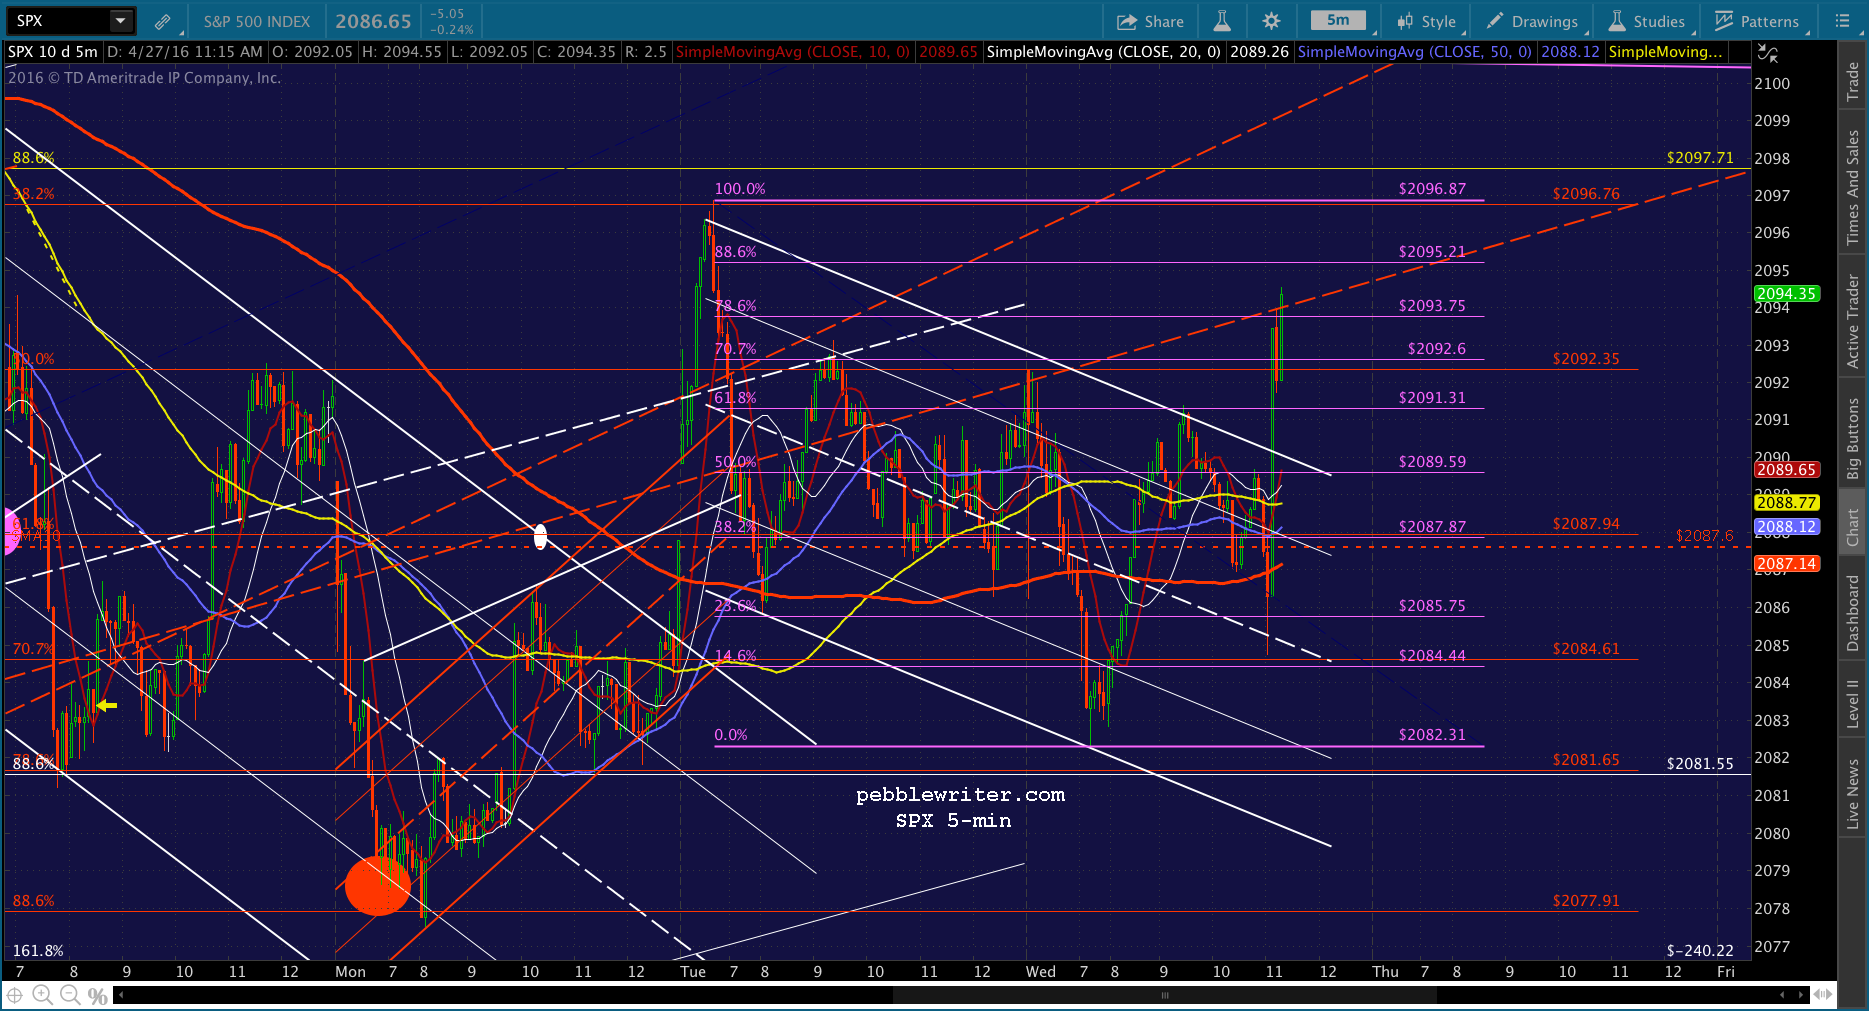
 UPDATE: 3:00 PM
Backtesting the (now) broken white channel. Should rebound from here and top 2096.87 high before it’s all done.
 While CL continues to push higher…
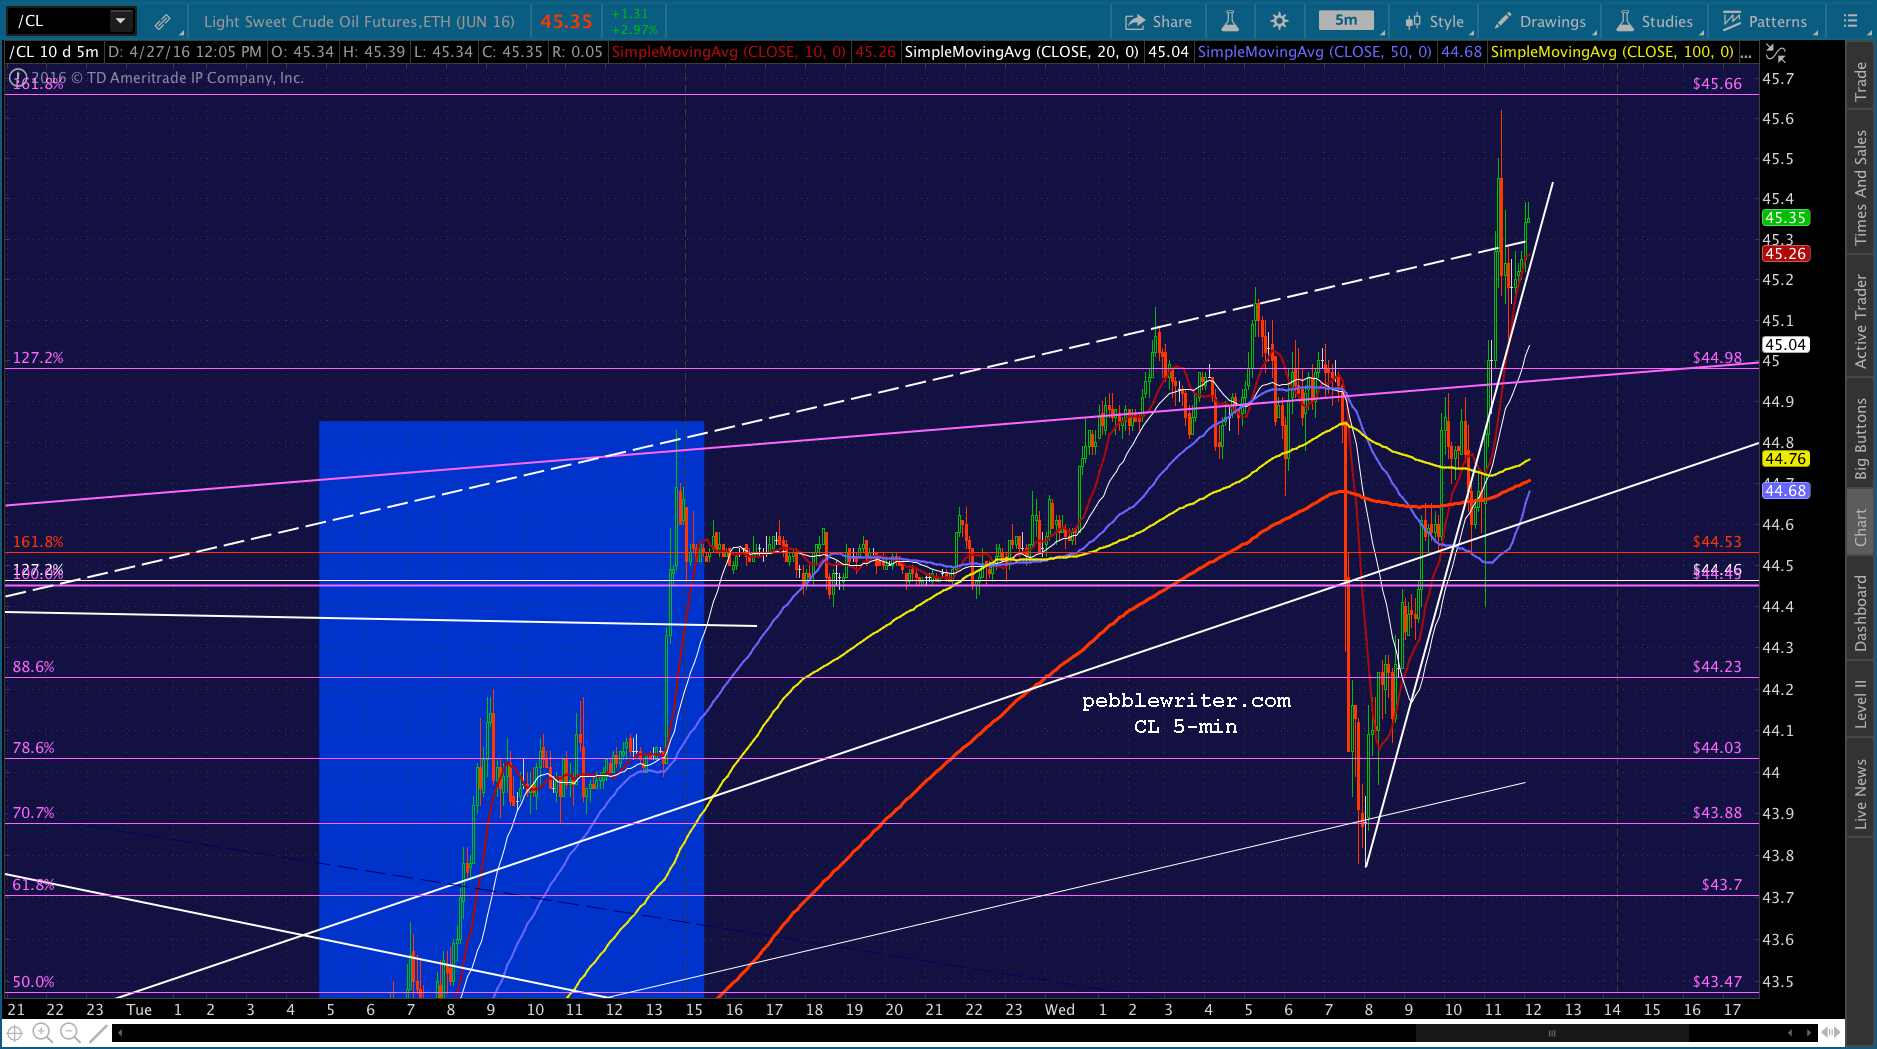 UPDATE: 3:41 PM
That’s probably about it for this leg. If you’re a contrarian and can hedge overnight and don’t believe BoJ has any ammunition left, this would be a great place to short. I still believe the yellow .786 at 2065 is in play, though it might be delayed until early next week as the red channel .236 line comes into view. And, the SMA20 would need to be dealt with first.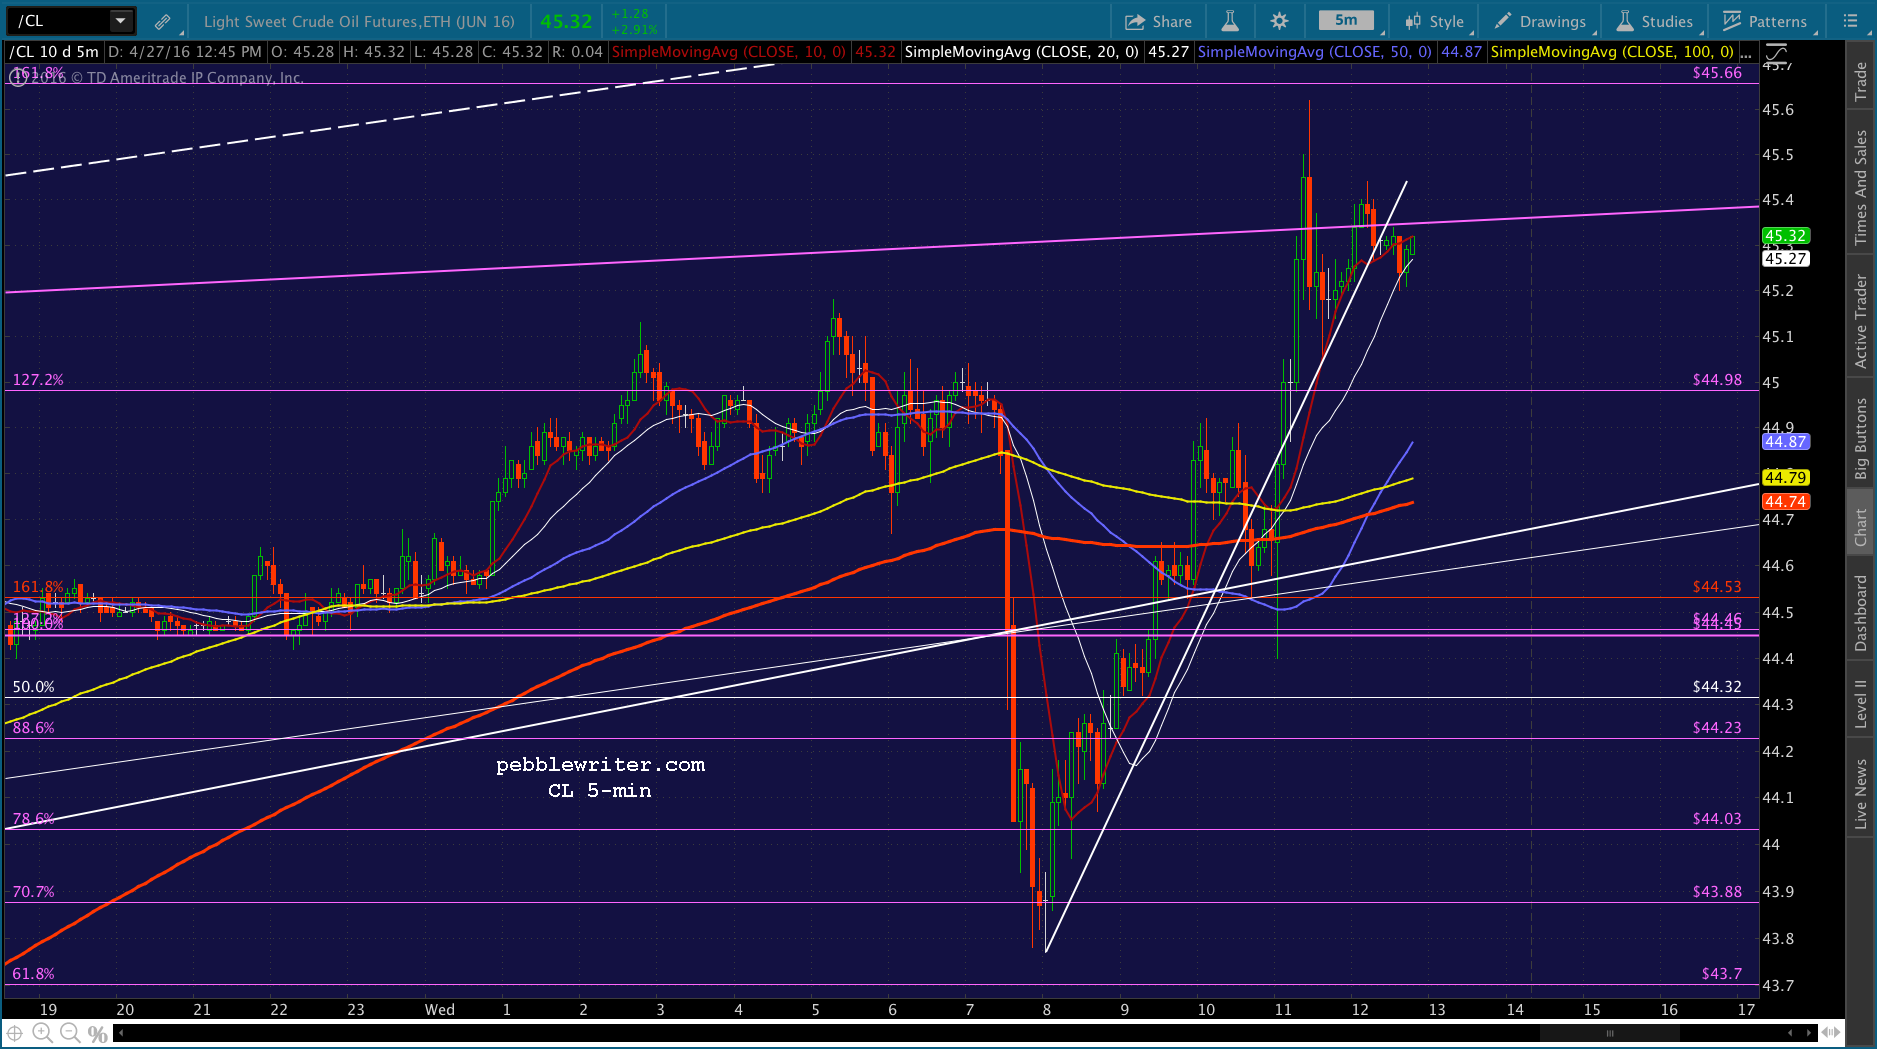

Comments
6 responses to “The Big Picture: Apr 27, 2016”
PebbleWriter, I see it now. That purple line on top in the your big picture is tough to break. Whenever SPX reached the top of that purple line (May 2015, June 2015, July 2015, Nov 2015, and probably including now), SPX would fall back and sometimes fall a lot. However, this time, SPX actually exceeded that top at 2097.71 for a moment. That’s why it might be unclear how it plays out.
Pebblewriter, your analysis on Big Picture, is there more? I thought you were interrupted when you mentioned “Think or Swim just froze up on me” and rebooted the PC.
Thank you!
I have lots more to add, just ran out of time. I’ll post more later this evening.
the yen has come back down from the highs and maybe that will be enough for the boj to leave things alone for now hard to think they would go more negative. but what do i know
I think you’re on the right track. But, remember, they care much more about the Nikkei than the economic impact of the yen. As far as negative rates go, they should recognize by now that the effect was negligible relative to that of CL. I suspect it will eventually come out that the BoJ is behind all the CL ramp jobs — which, IMHO, is despicable. Higher prices keep stocks rising, but impose a significant tax on already beleaguered Japanese consumers.
if it pulls back with neg fed news where do you think it would go to?