

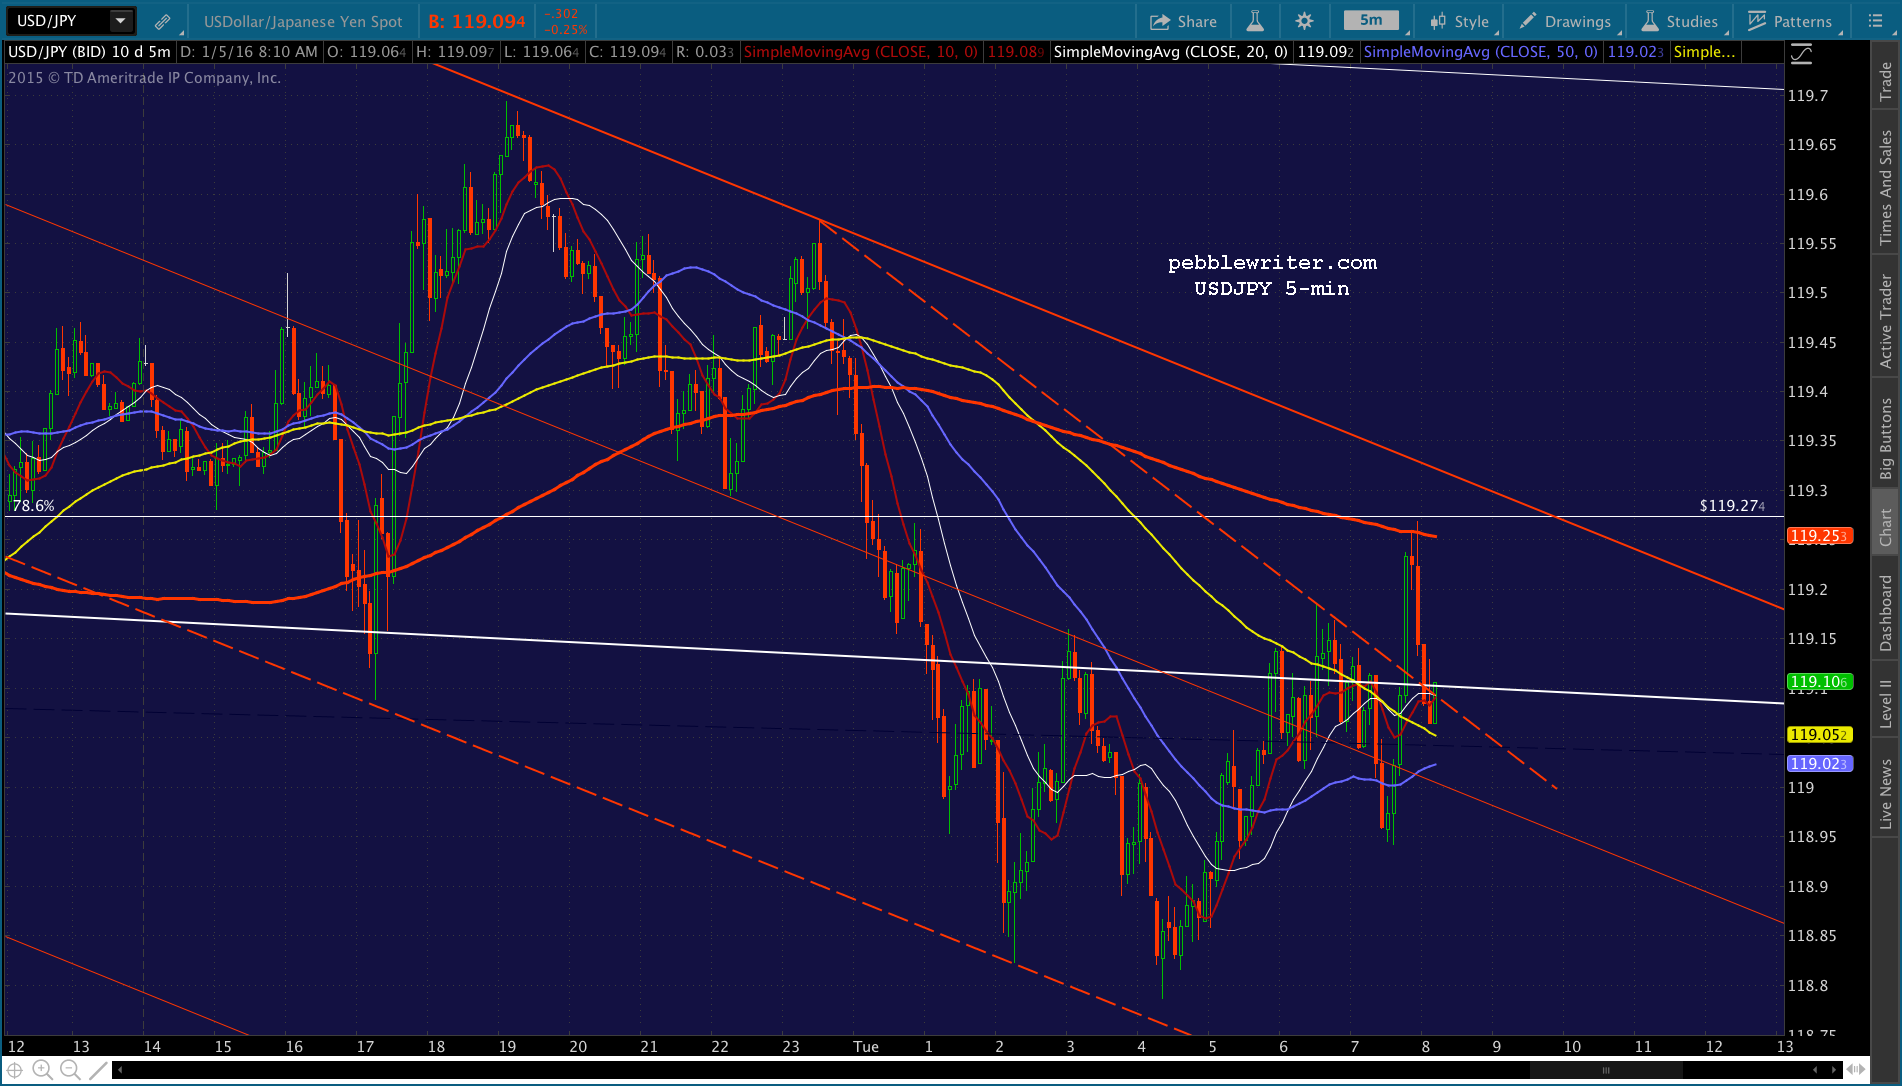
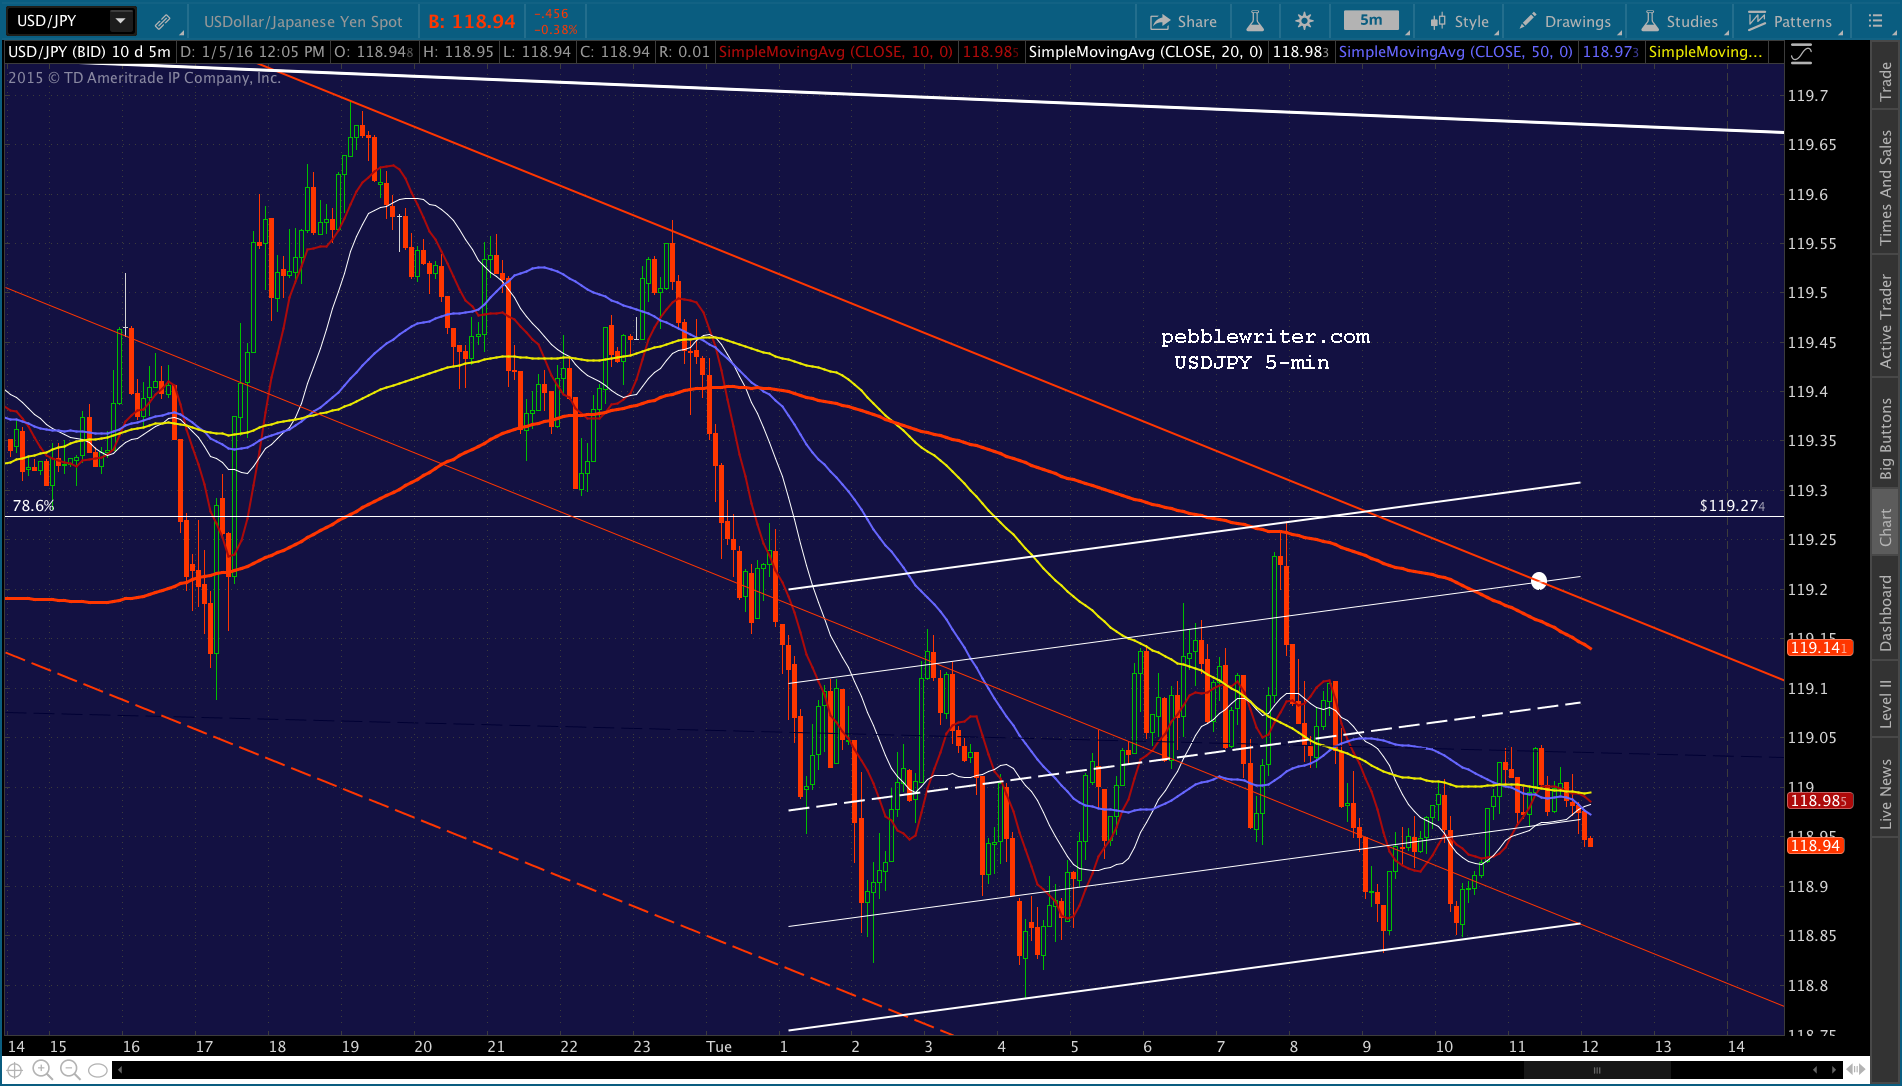
Did you feel it? Something big happened yesterday, and it had nothing to do with China, Saudi Arabia, Iran or Donald Trump. Of course, I’m talking about USDJPY, which closed below the key Fib line at 120.11.  Is it important? Well, the last time it dipped below this level, stocks were in the midst of a 12.5% plunge.
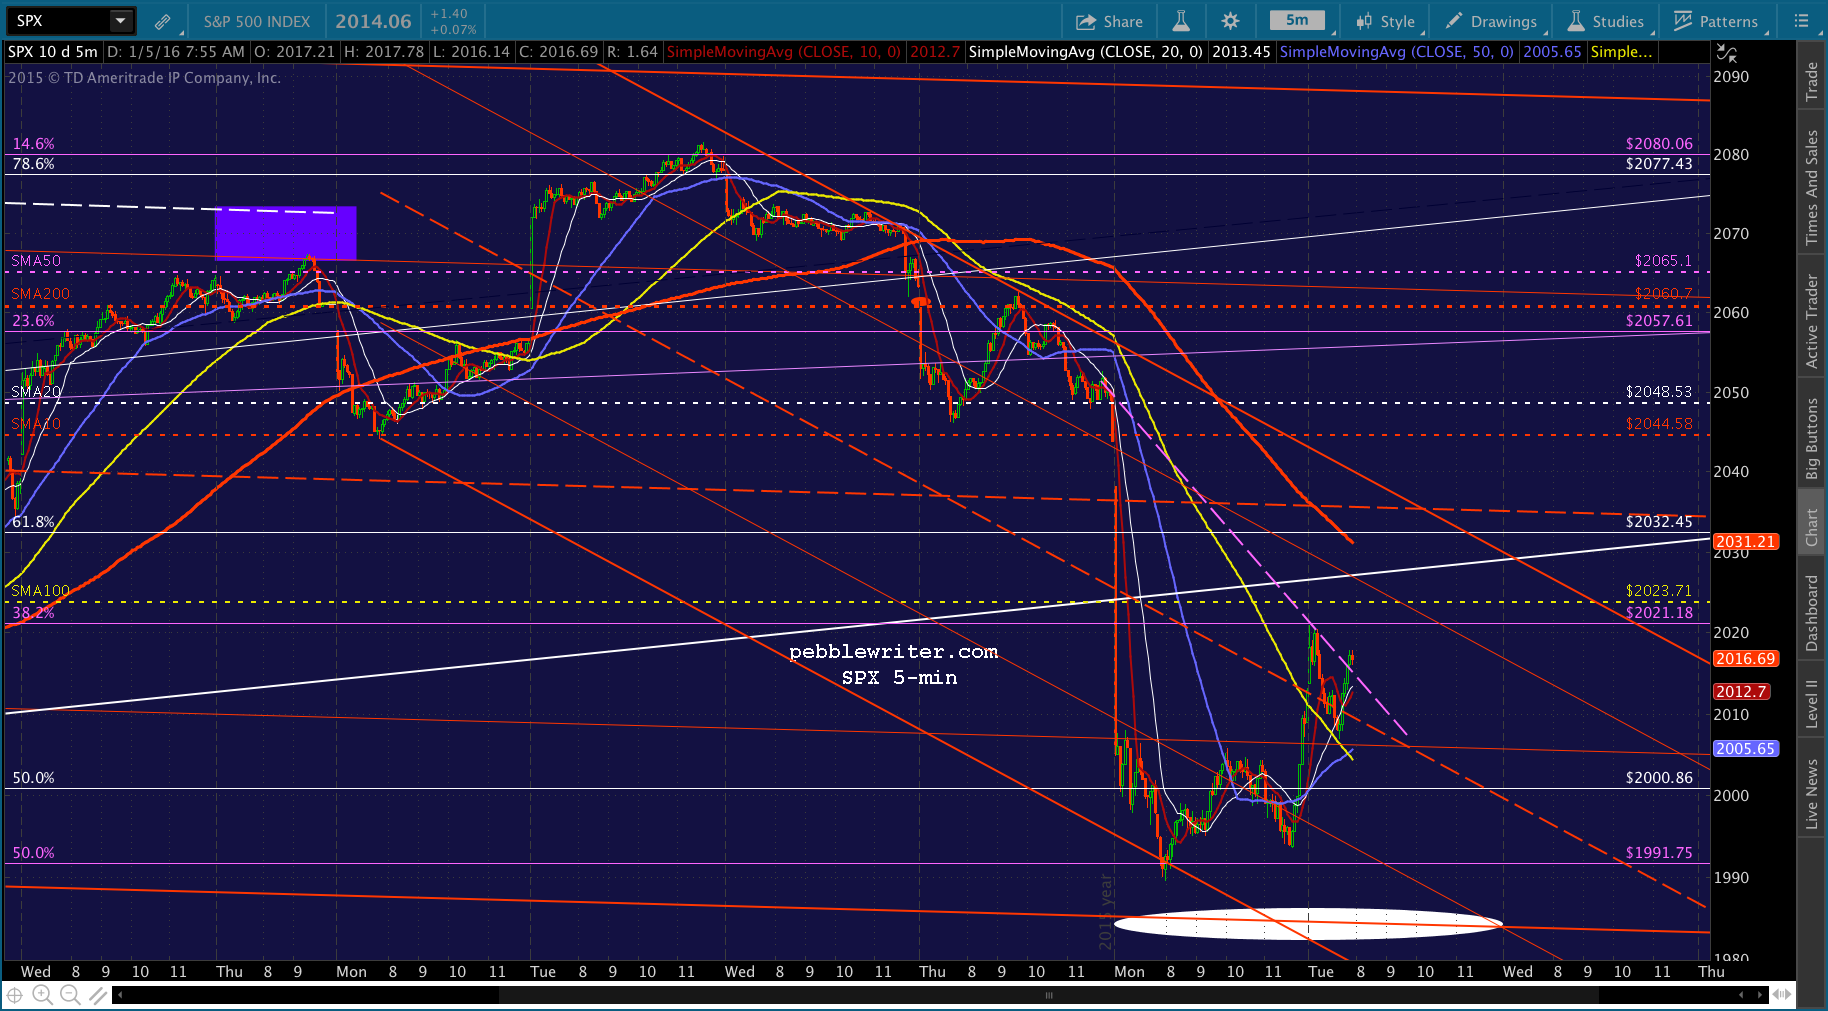
continued for members…Note that the rising white channel officially broke down yesterday. In the good old days when nothing bad ever happened, this would quickly be remedied by a pop right back into the channel. But, with USDJPY below 120.11, everything is potentially different.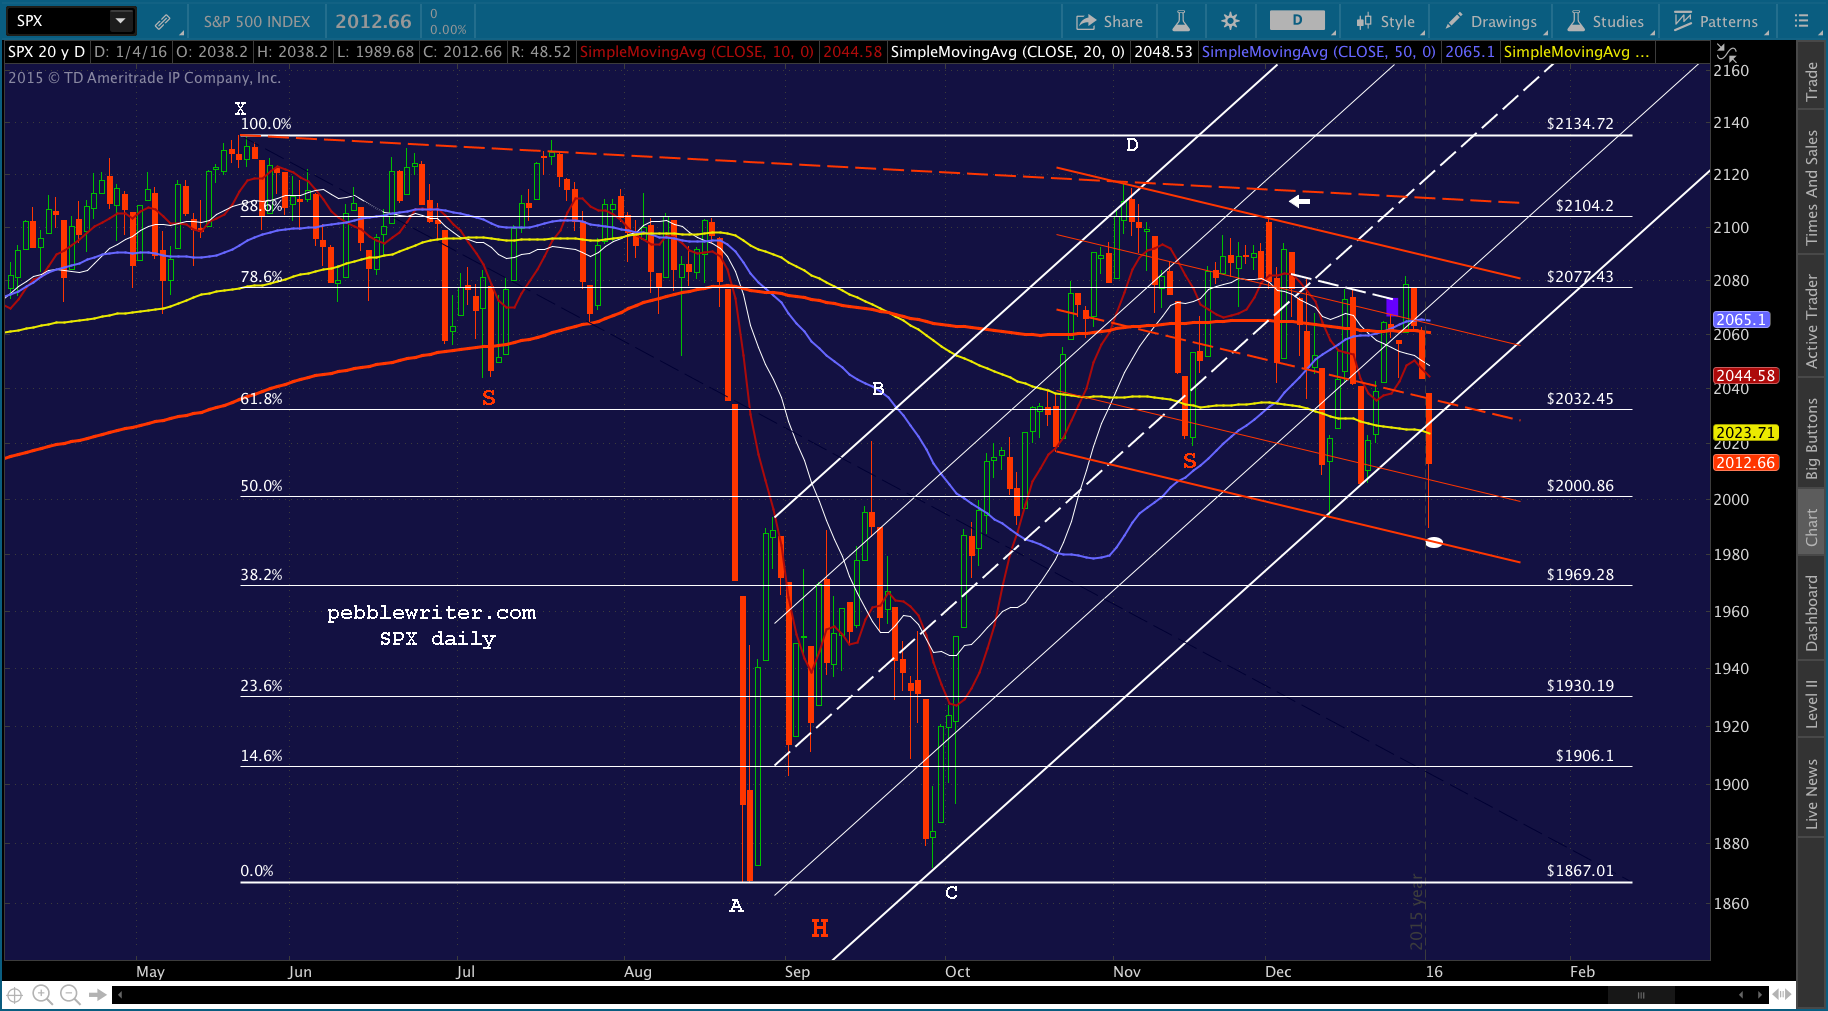 SPX should complete the tag on the bottom of the Flag Pattern we’ve been watching — probably around 1984. But, I remain fixated on 1962/1965 as detailed yesterday.
I’m playing around with the placement of the rising purple channel, but I like the purple .618 Fib at 1962 or 1965 – depends on which Point X. It could take a few days to get there, or it could come in a hurry. The key will be reversing off a backtest of the SMA100 (2023.71.)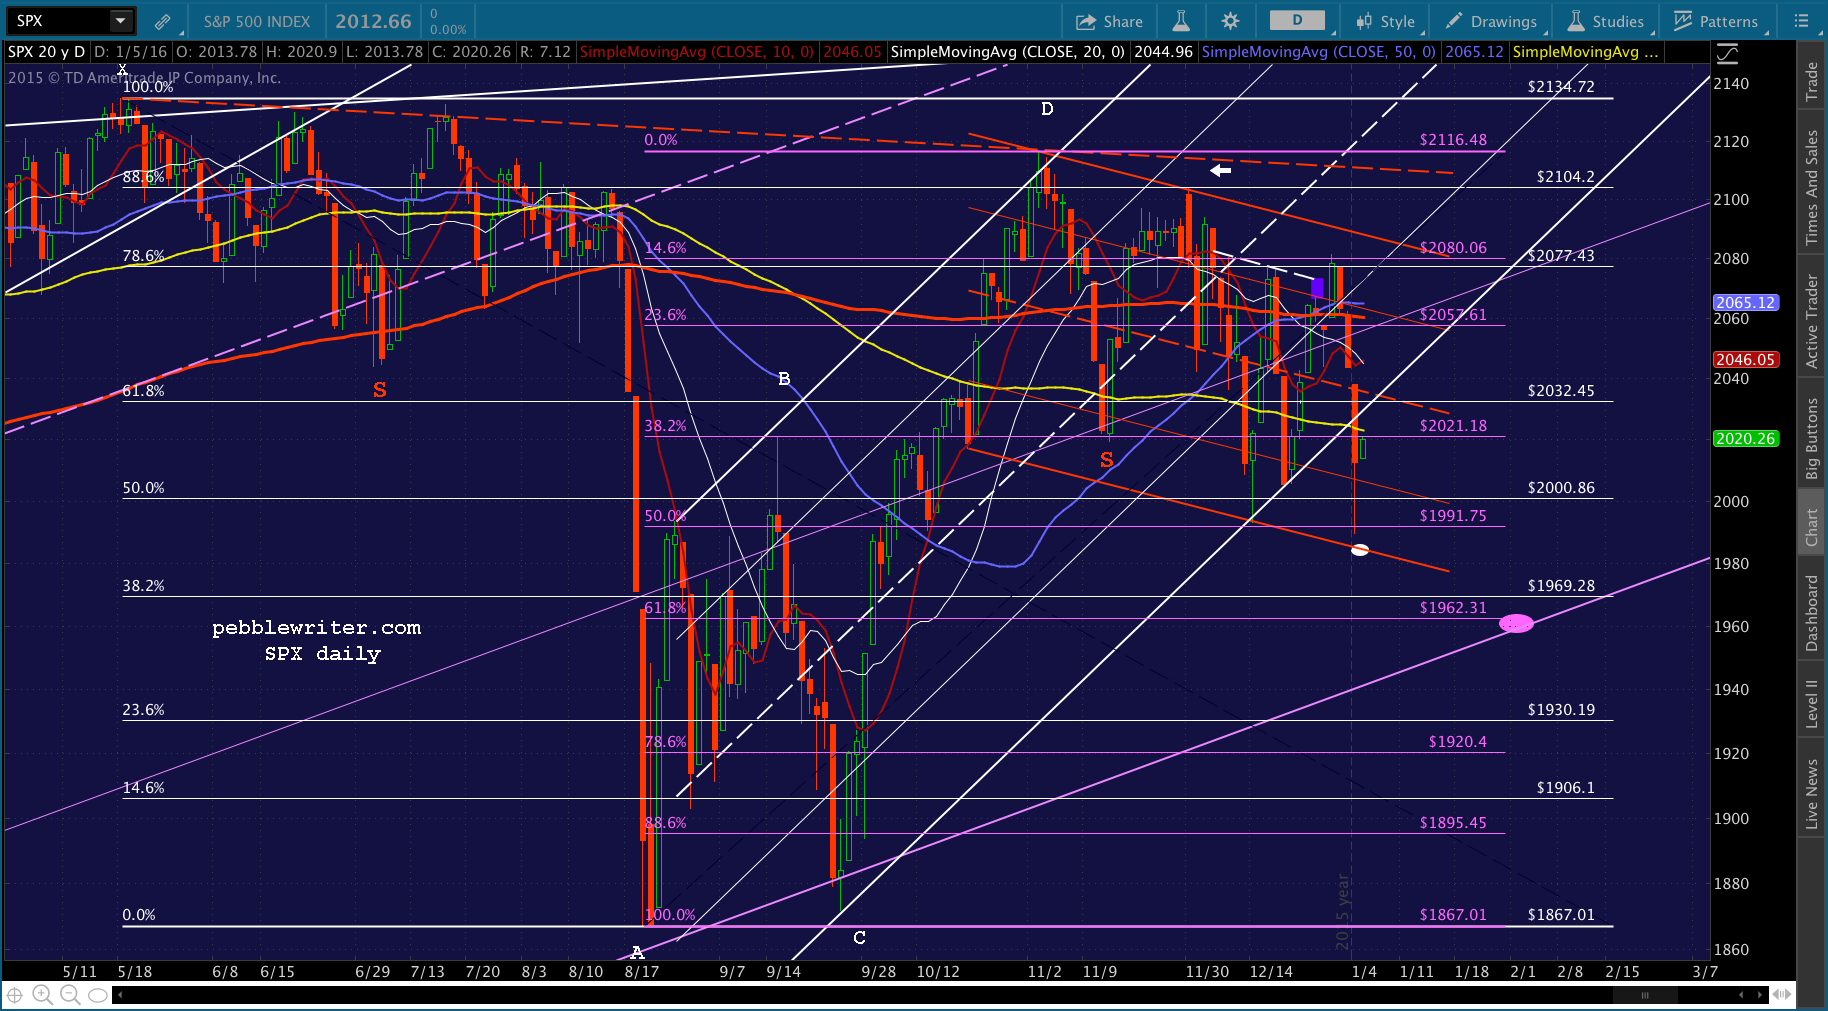 It will obviously depend on USDJPY and CL — which is apparently in the process of trying to negate the pre-opening bounce in ES.
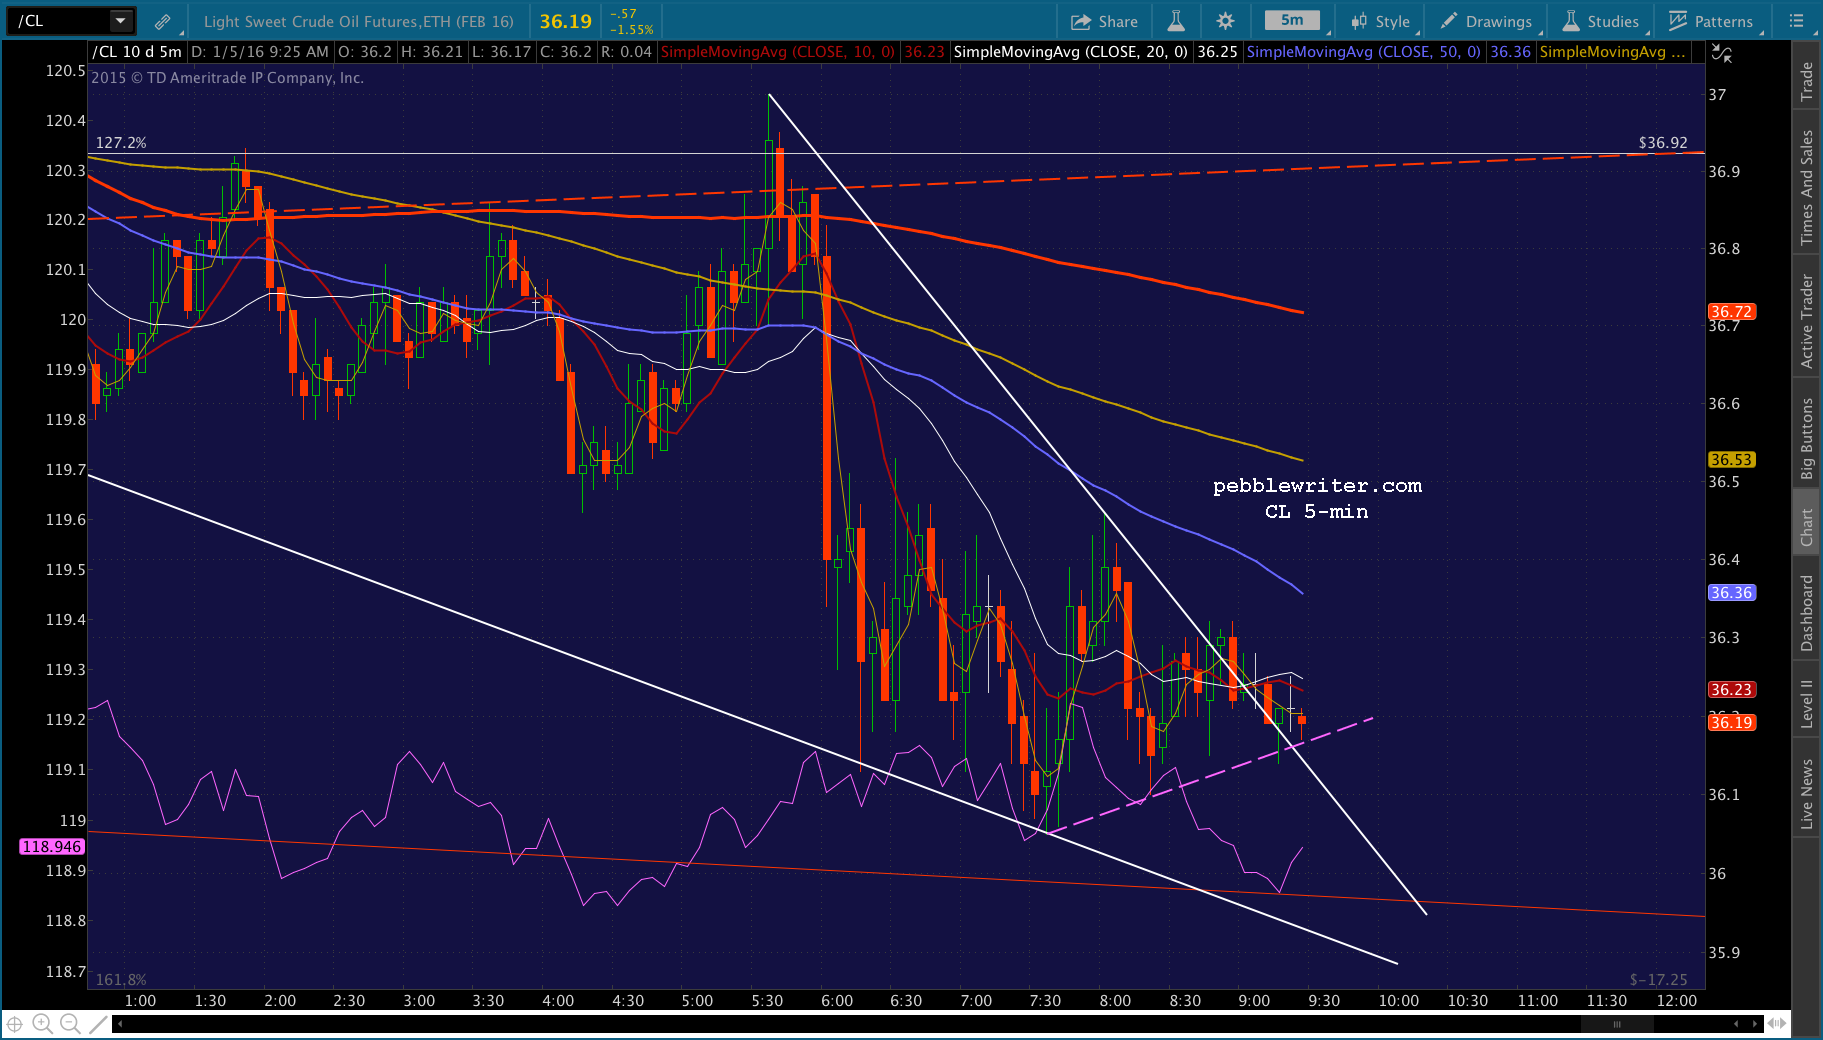
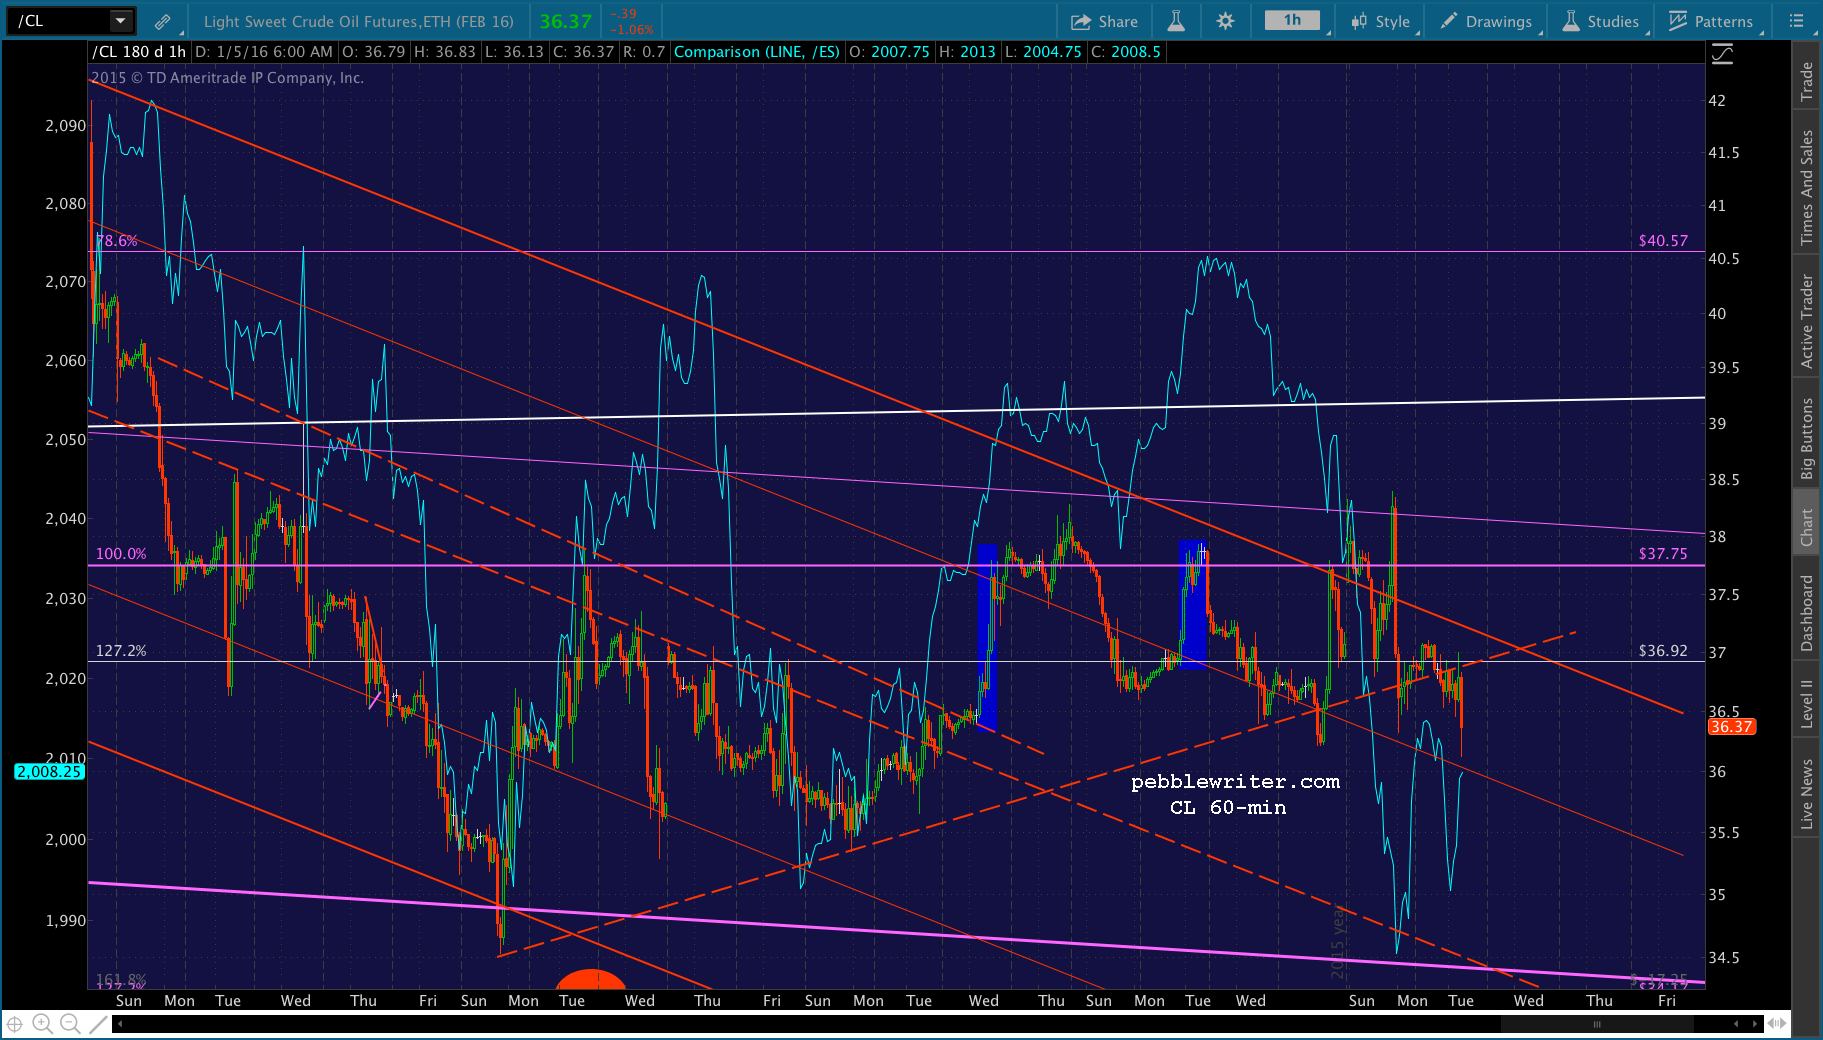 All that popping up above the red channel top at the end of the year? Kaput.
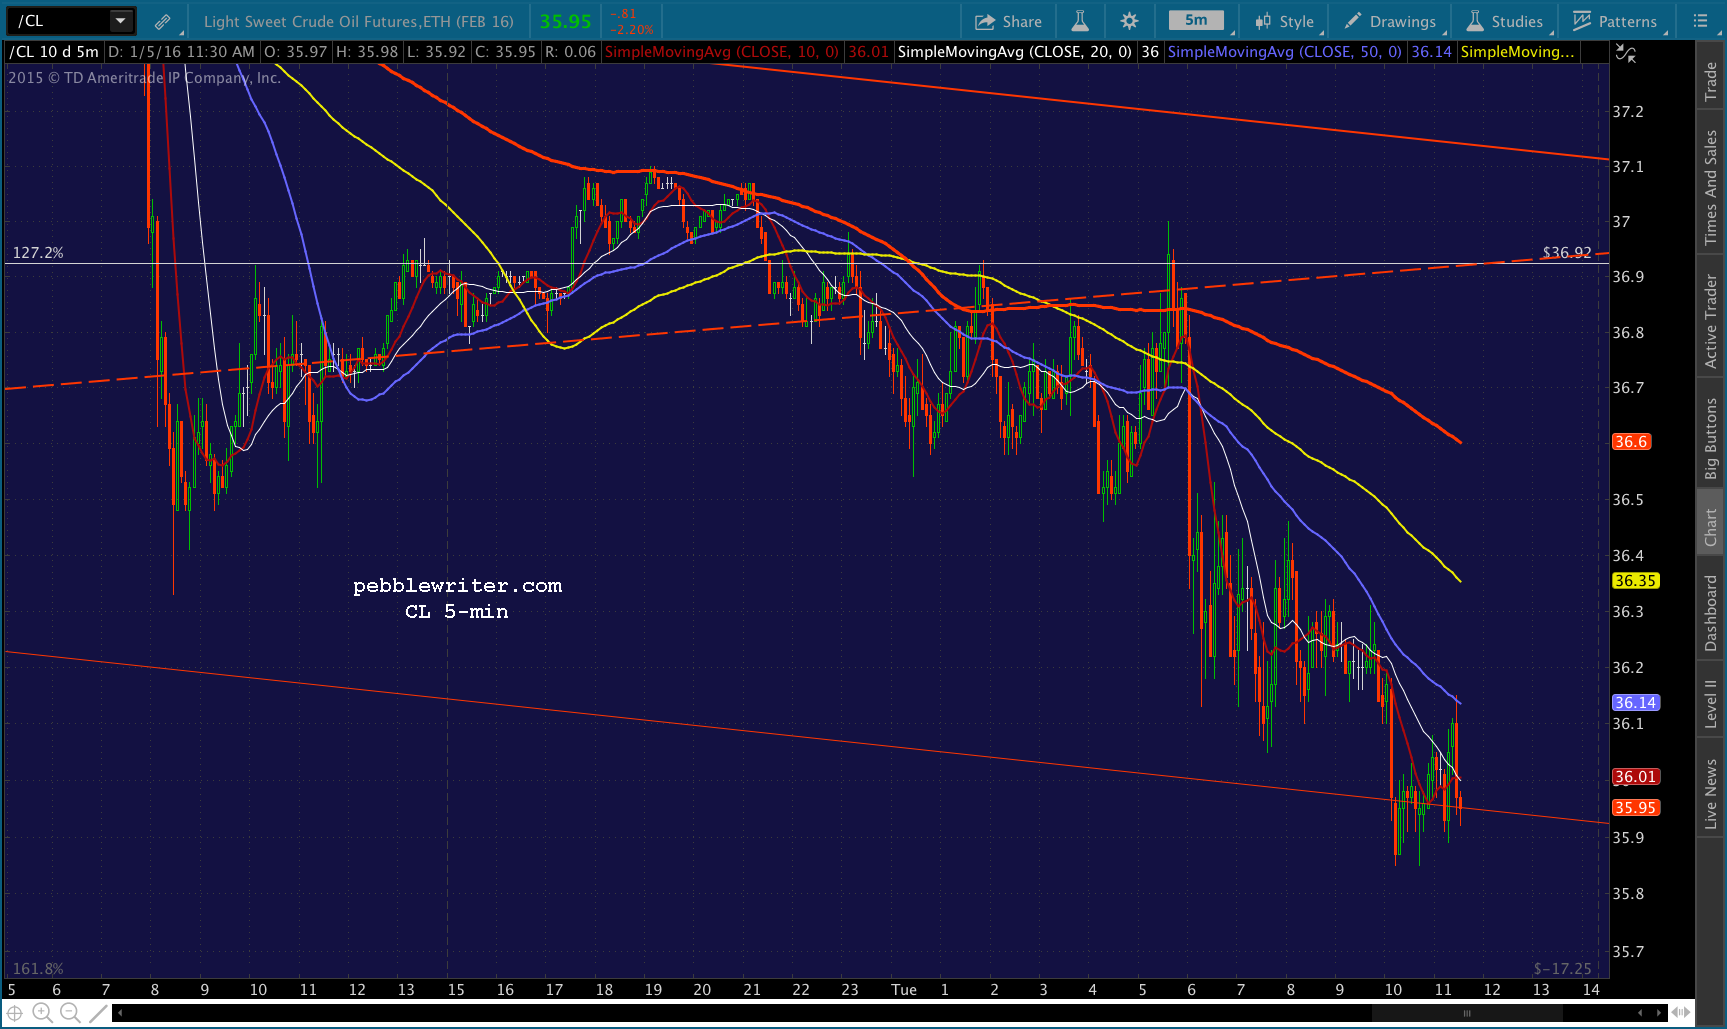
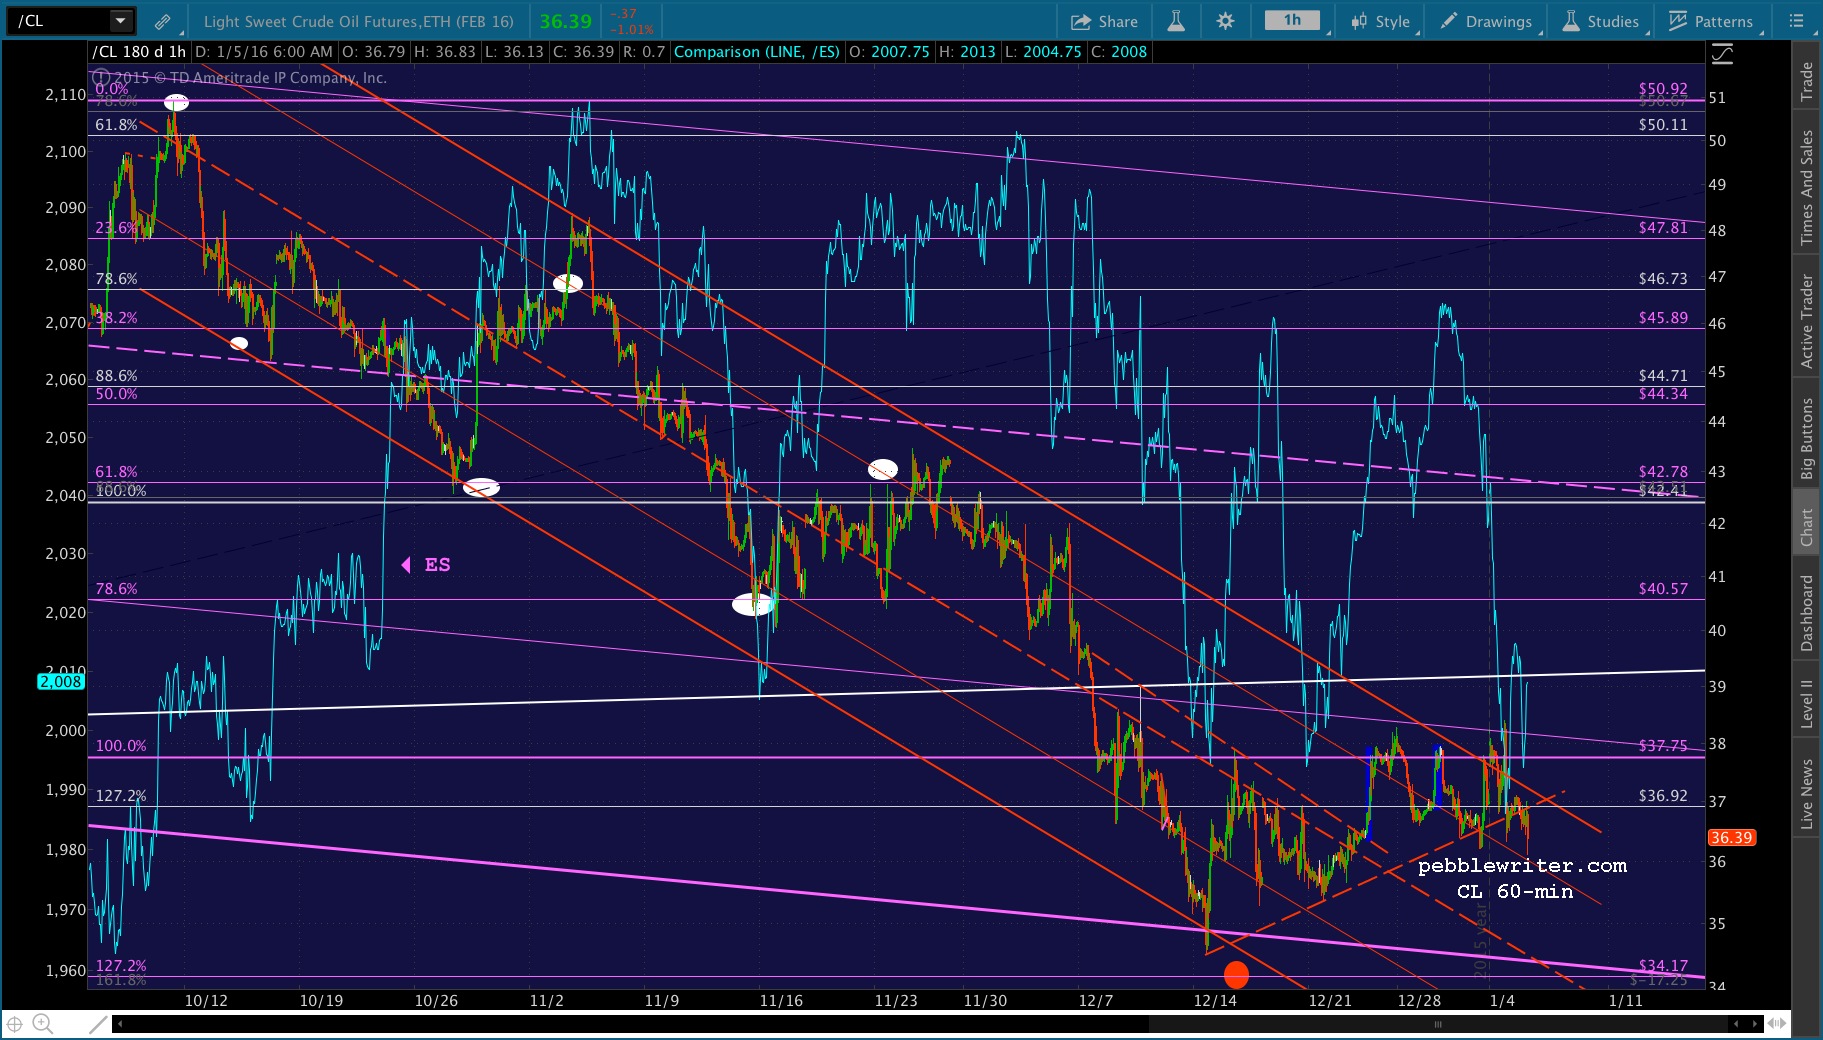 We can still expect lots of interference when stocks need a boost. But, as long as CL remains in the falling red channel, the next stop should be 34.17 — potentially as soon as tomorrow.
With USDJPY below 120.11, and CL potentially plumbing new depths, 1962 should be doable. After that, we’ll have to see what tricks TPTB can come up with to maintain the purple channel. If they don’t, then we’re obviously in for much more downside than we’ve seen in a long, long time.
There are several schools of thought on this. Some believe that central banks are done. They’re shot their wads and it’ll take a serious crash to bring them out of their QE shells again. I’m not sure I agree.
It’s a lot easier to maintain a trend than it is to resurrect a broken trend. So, I think we’ll see some action, probably by the BoJ, if the purple channel is seriously threatened. In fact, Kuroda was in the news last night making “whatever it takes” kind of noises.
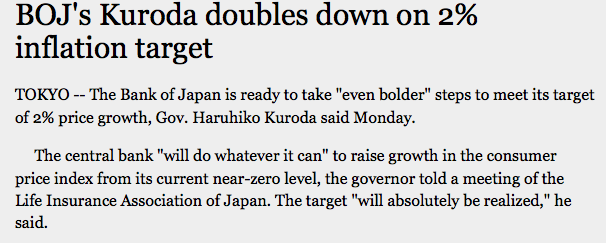 It’s ridiculous, of course. The rate of inflation is a very distant 3rd or 4th place in importance. The only goal that really matters is turning the Nikkei around.
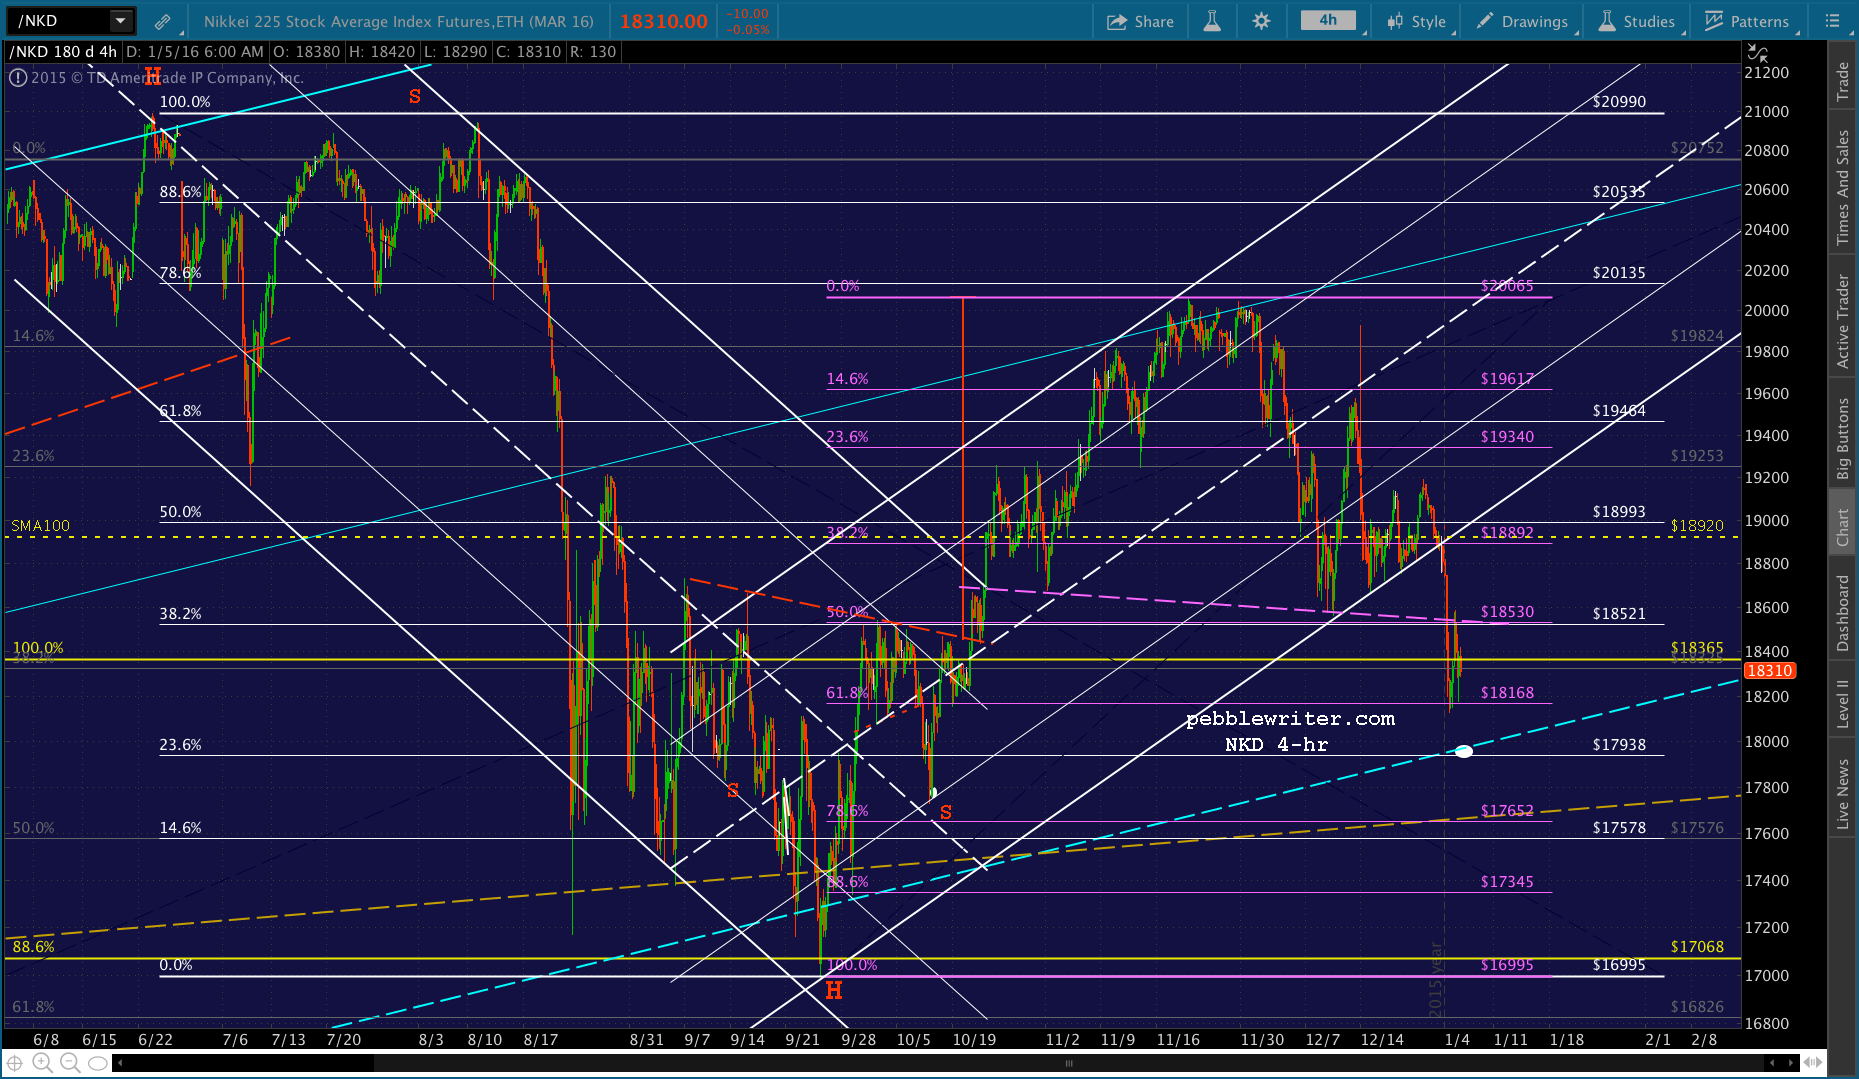 UPDATE: 10:49 AM
It appears as though they intend to run SPX up to the daily SMA at 2023.71 or the red SMA5 200, currently at 2031.21. USDJPY just took off skyward. The safe play is to play along on the long side and plan on reverting to short there. I’d suggest tight stops.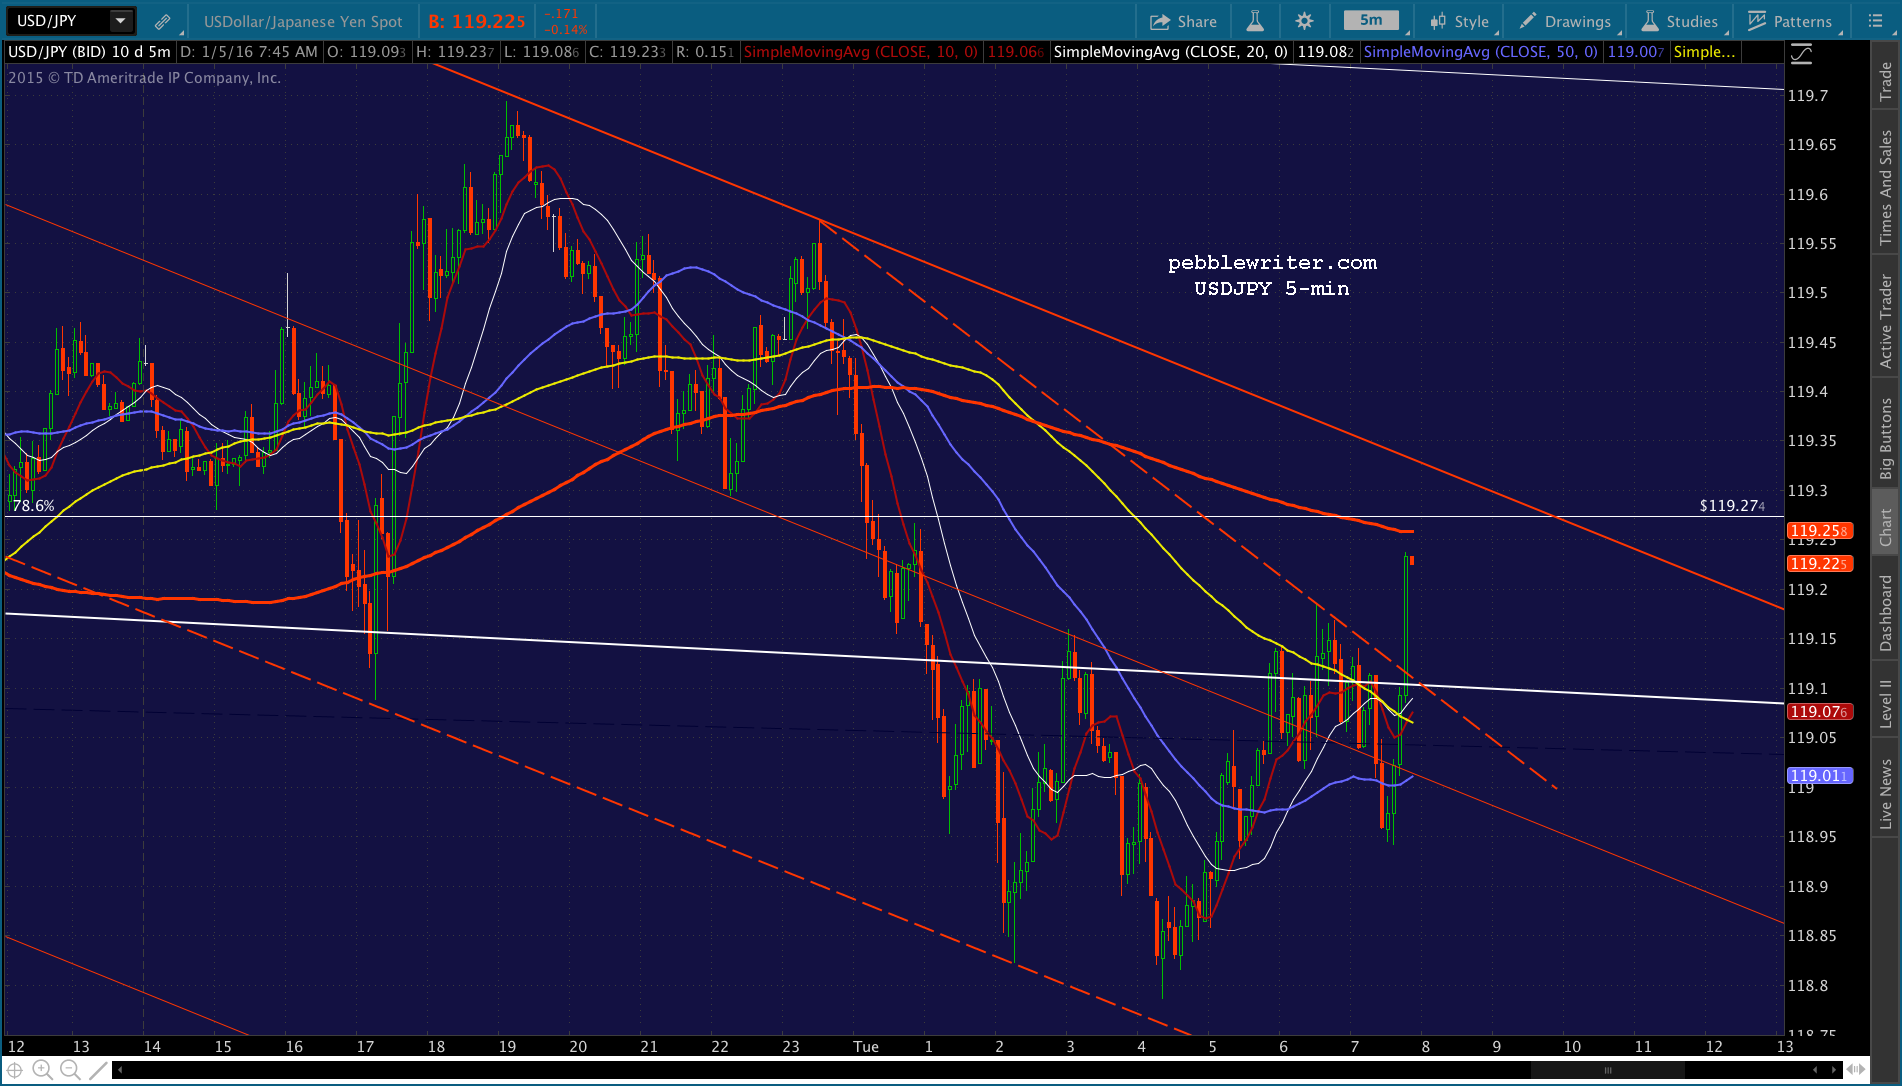
 Here’s a little better look at it, with a nice little TL drawn in to help decide when it’s time to cut loose on the long position.
 UPDATE: 10:59 AM
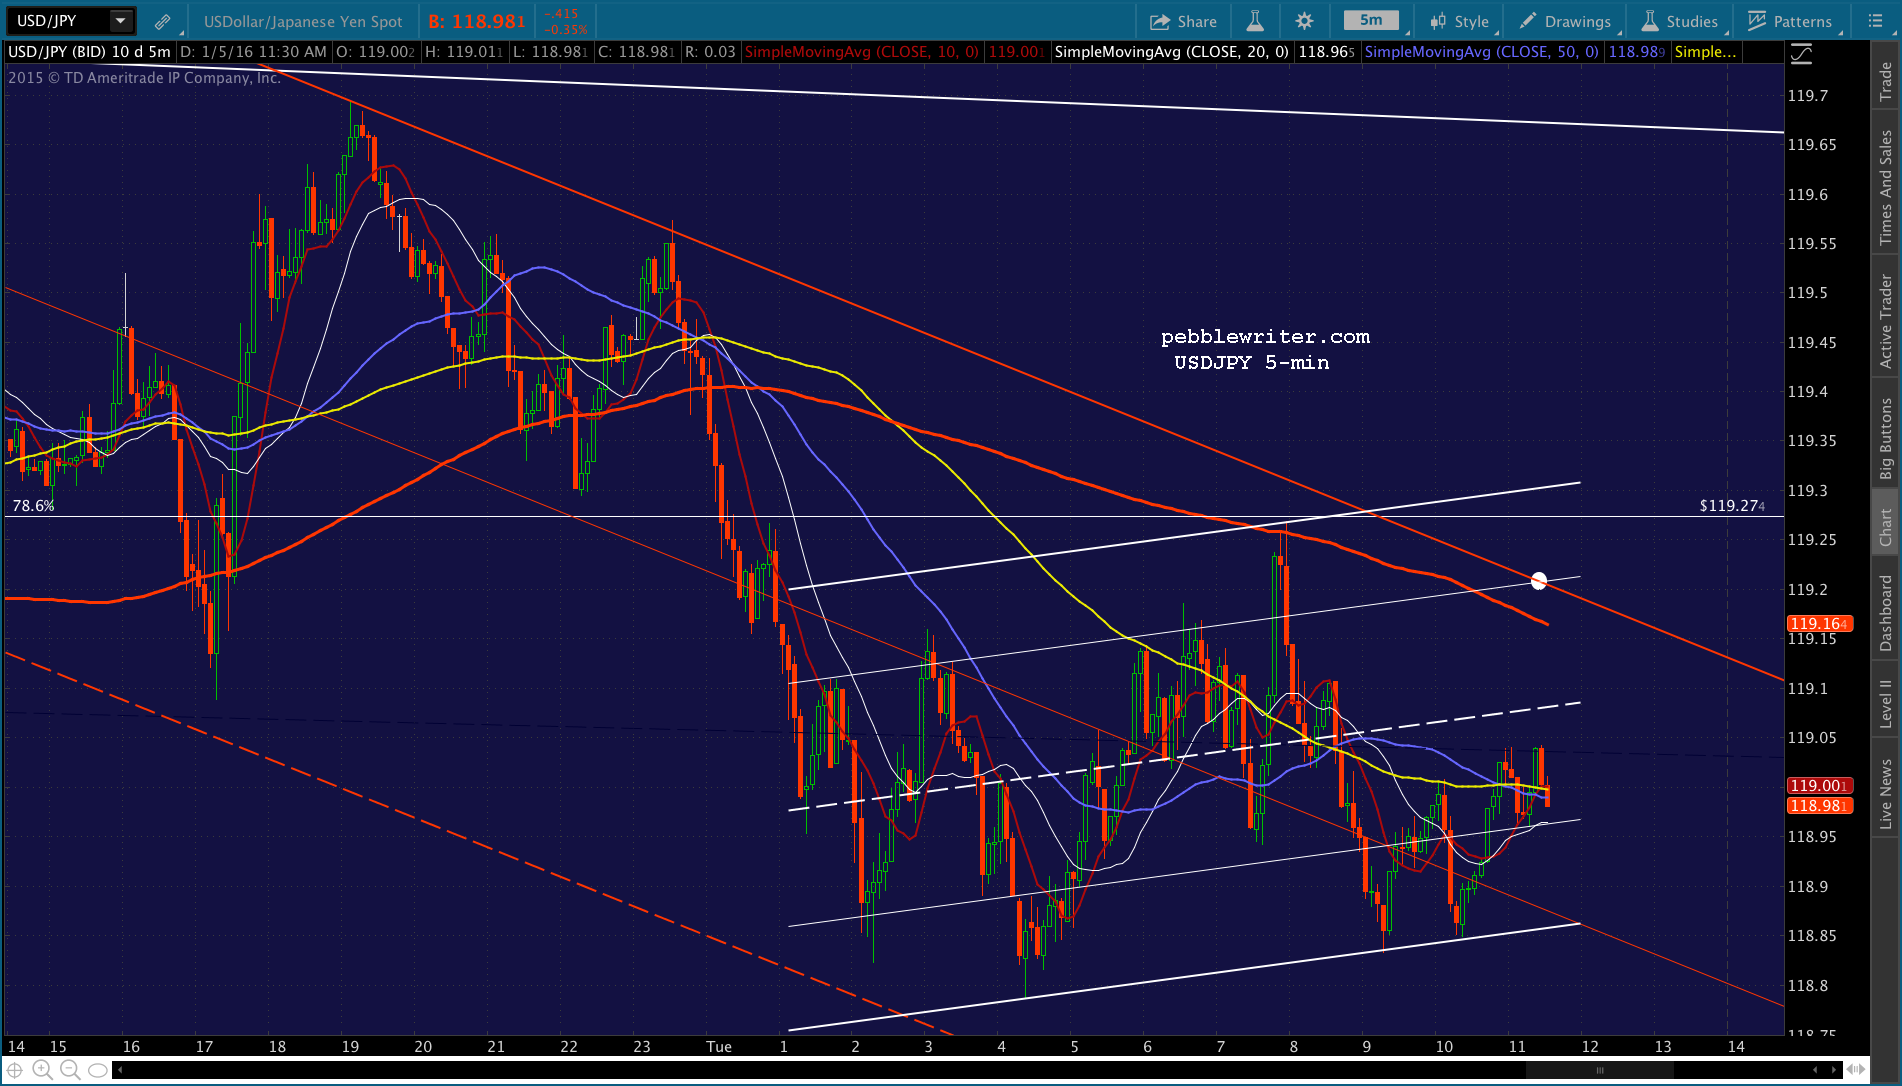
USDJPY went up to tag the 5-min SMA200 and promptly reversed. If it holds at a backtest of the red TL, then SPX has more bounce left in it. If it plunges back below, then I’d waste no time getting short again.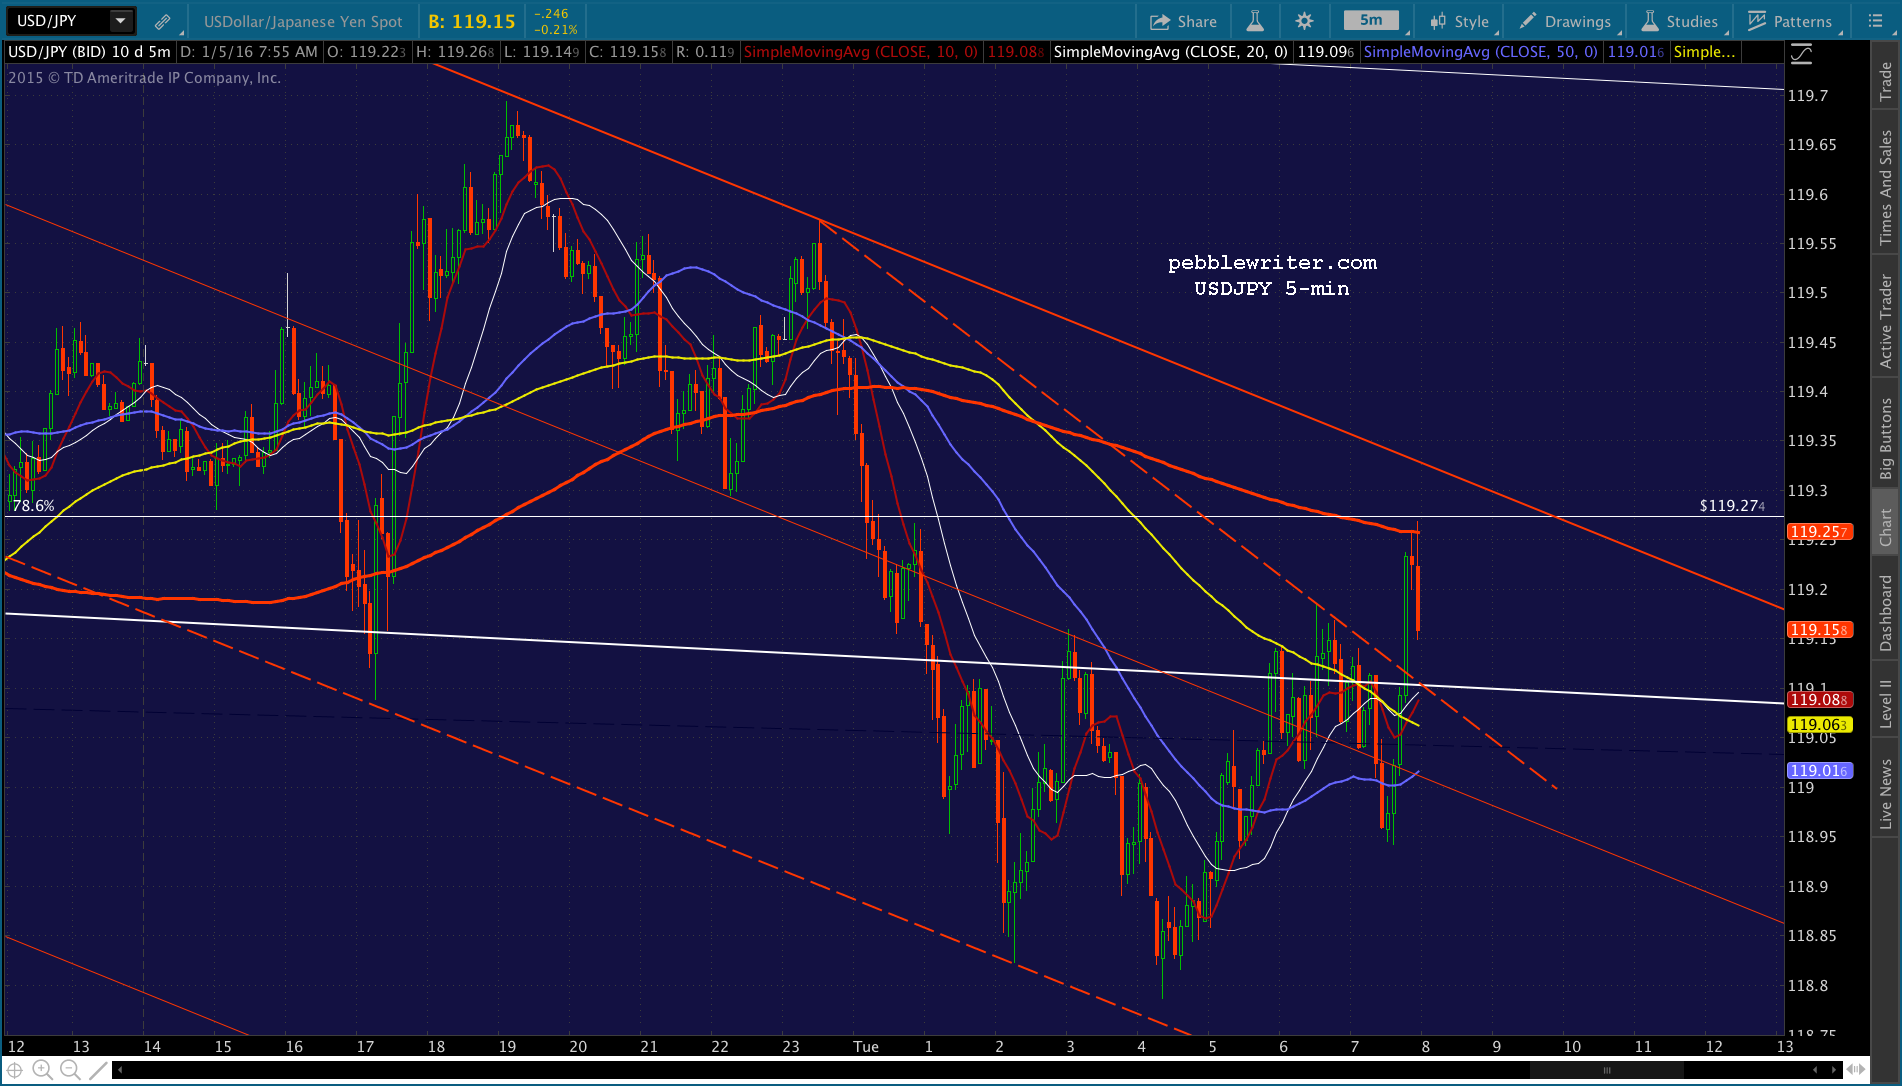
 UPDATE: 11:09 AM
Head fake time. Back to short, but there’s a good chance USDJPY will suddenly rebound above the TL and this will prove to be the head fake. Watch out for support at the SMA5 50 at the red midline (2008ish.)
 Here’s a look at the scenario described above. I sincerely hope it just drops to 1984ish and is done with it.
 UPDATE: 11:33 AM
SPX is about to pop back through the purple TL again. I’m not sure whether or not it’ll come back and tag the SMA5 50, but USDJPY seems to suggest it will.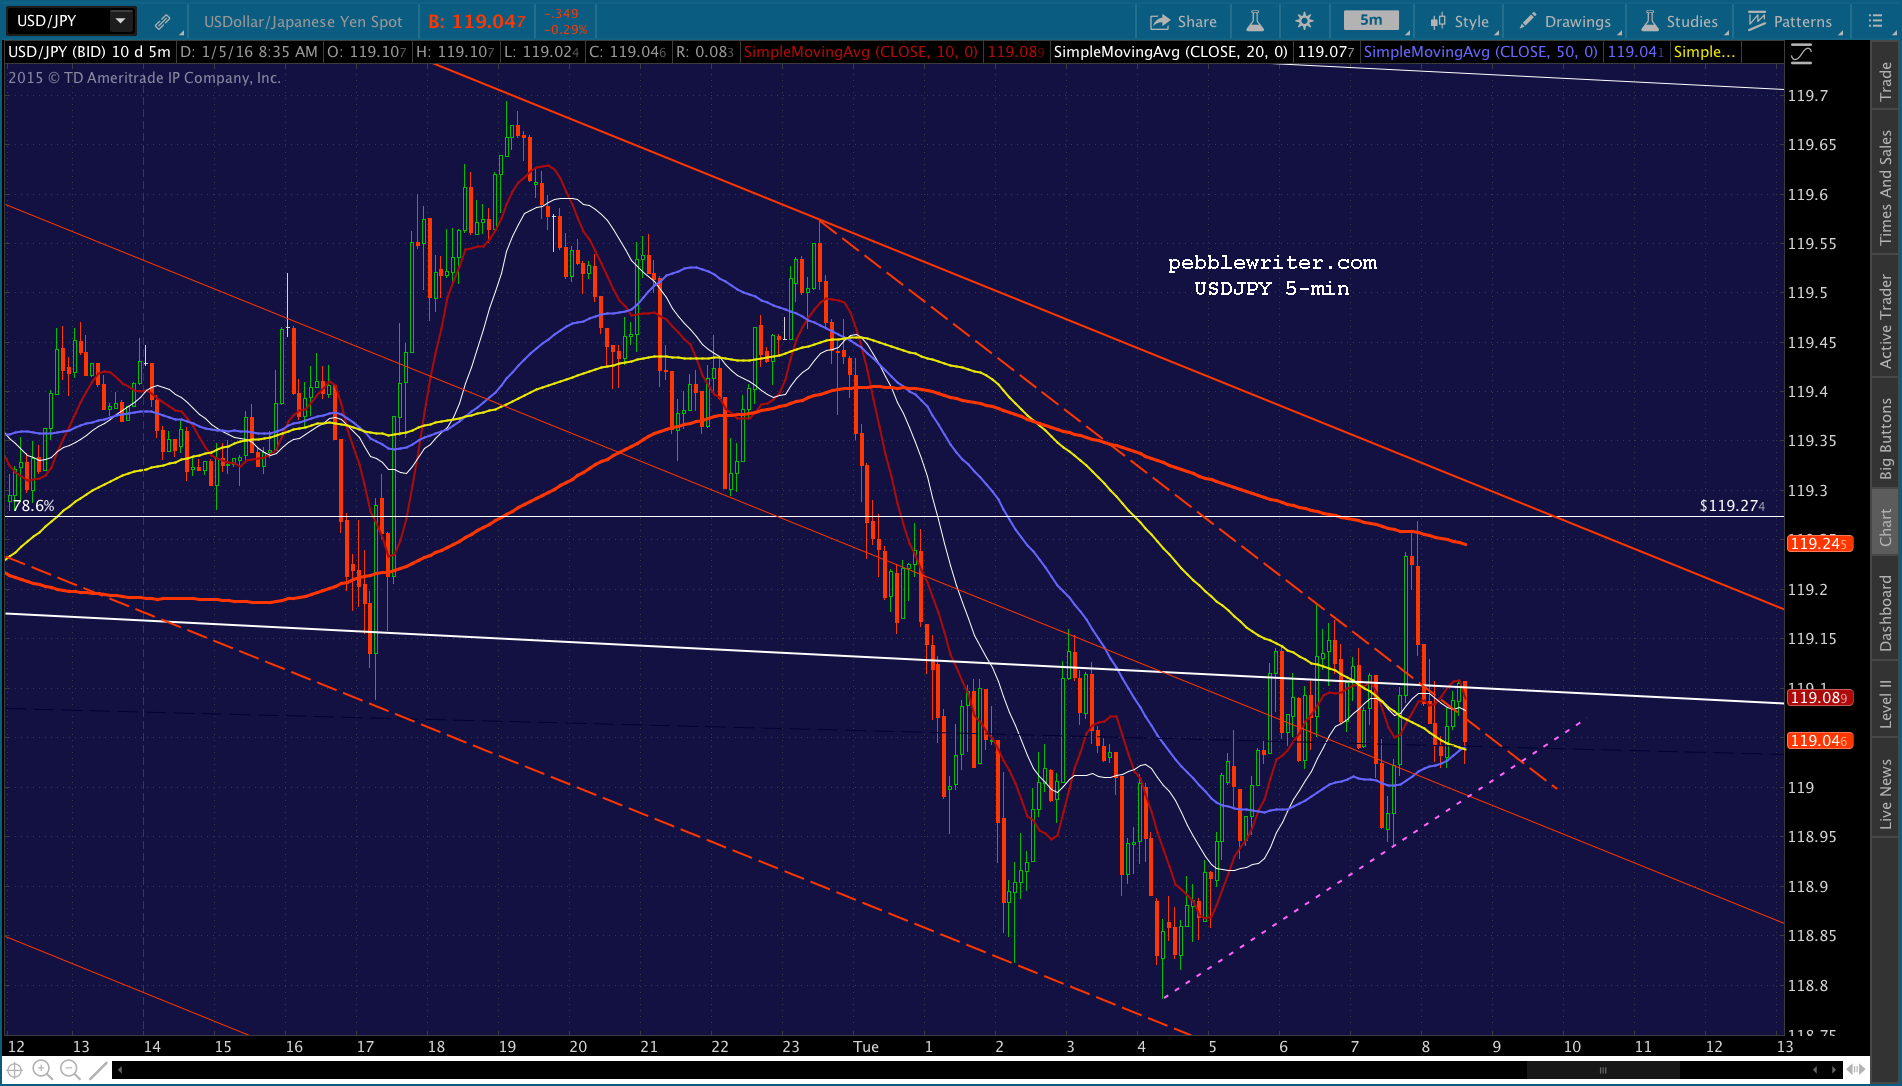
 UPDATE: 12:08 PM
SPX just tagged the SMA5 50. Be careful here, as we could get a bounce off the red midline or the 5-min SMA100 just below at 2003.80.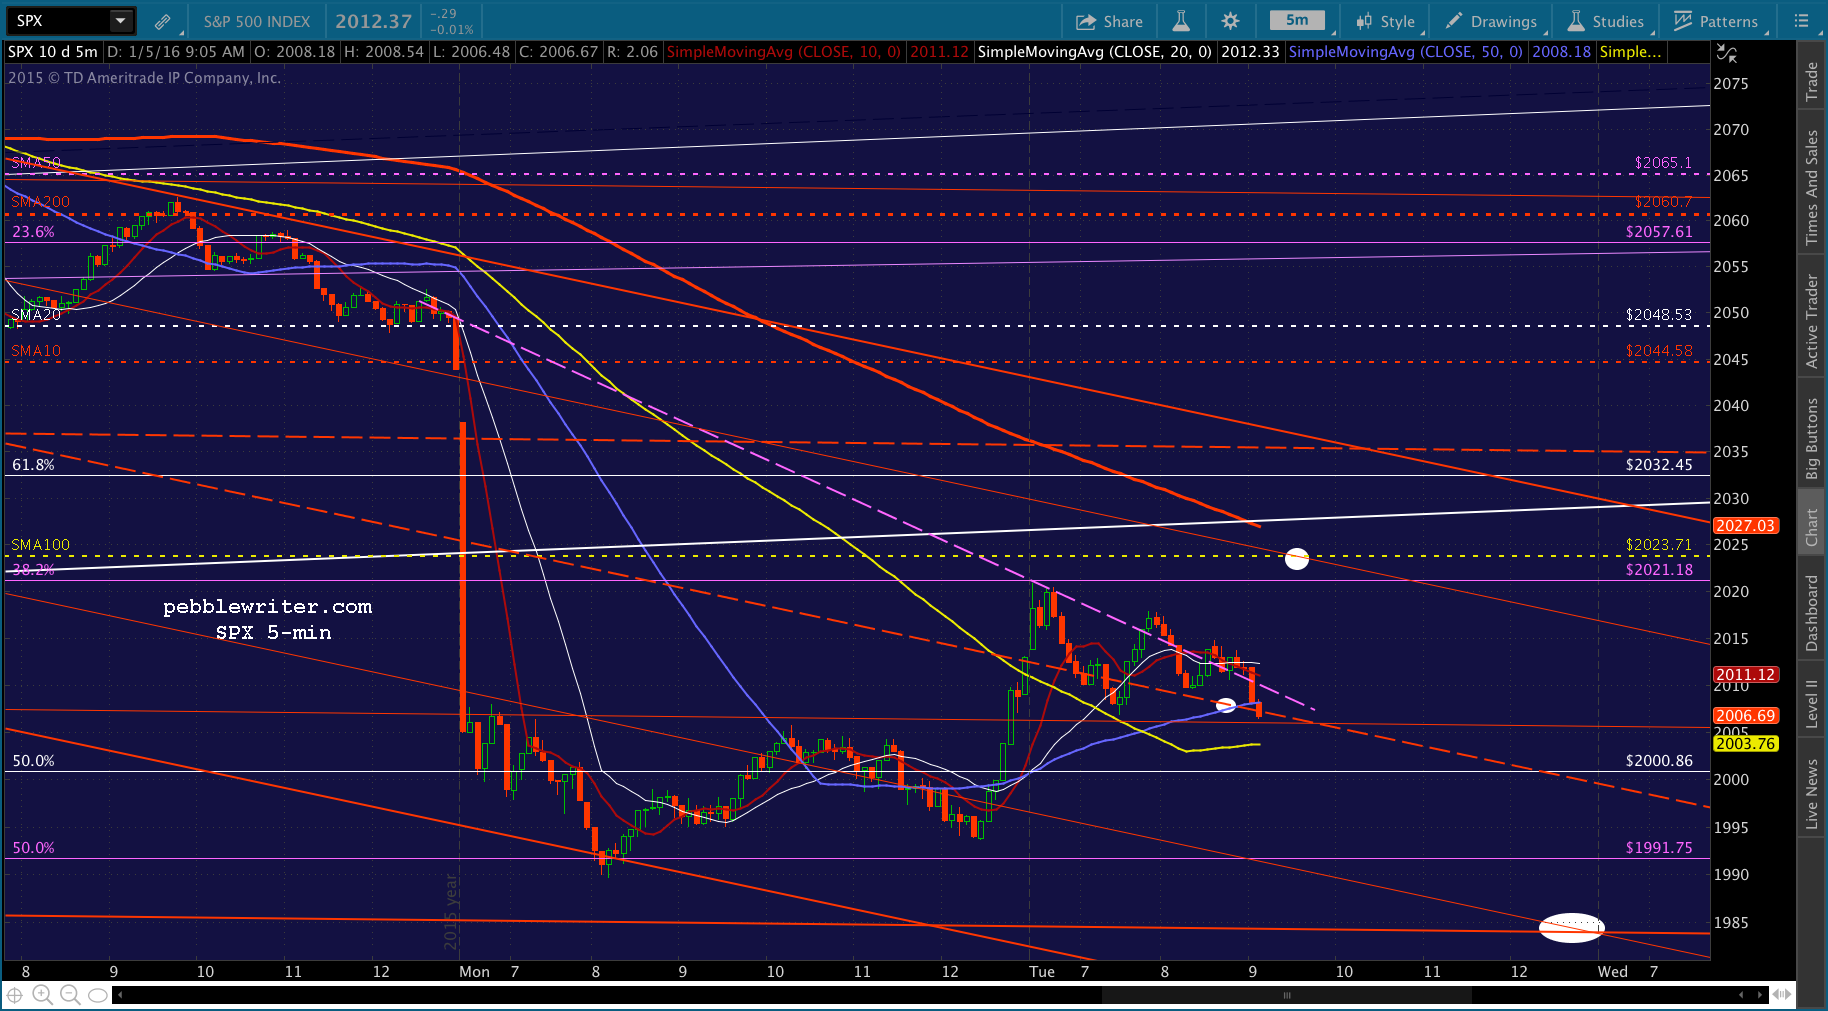 Keep a very close eye on USDJPY for any signs of a bounce.
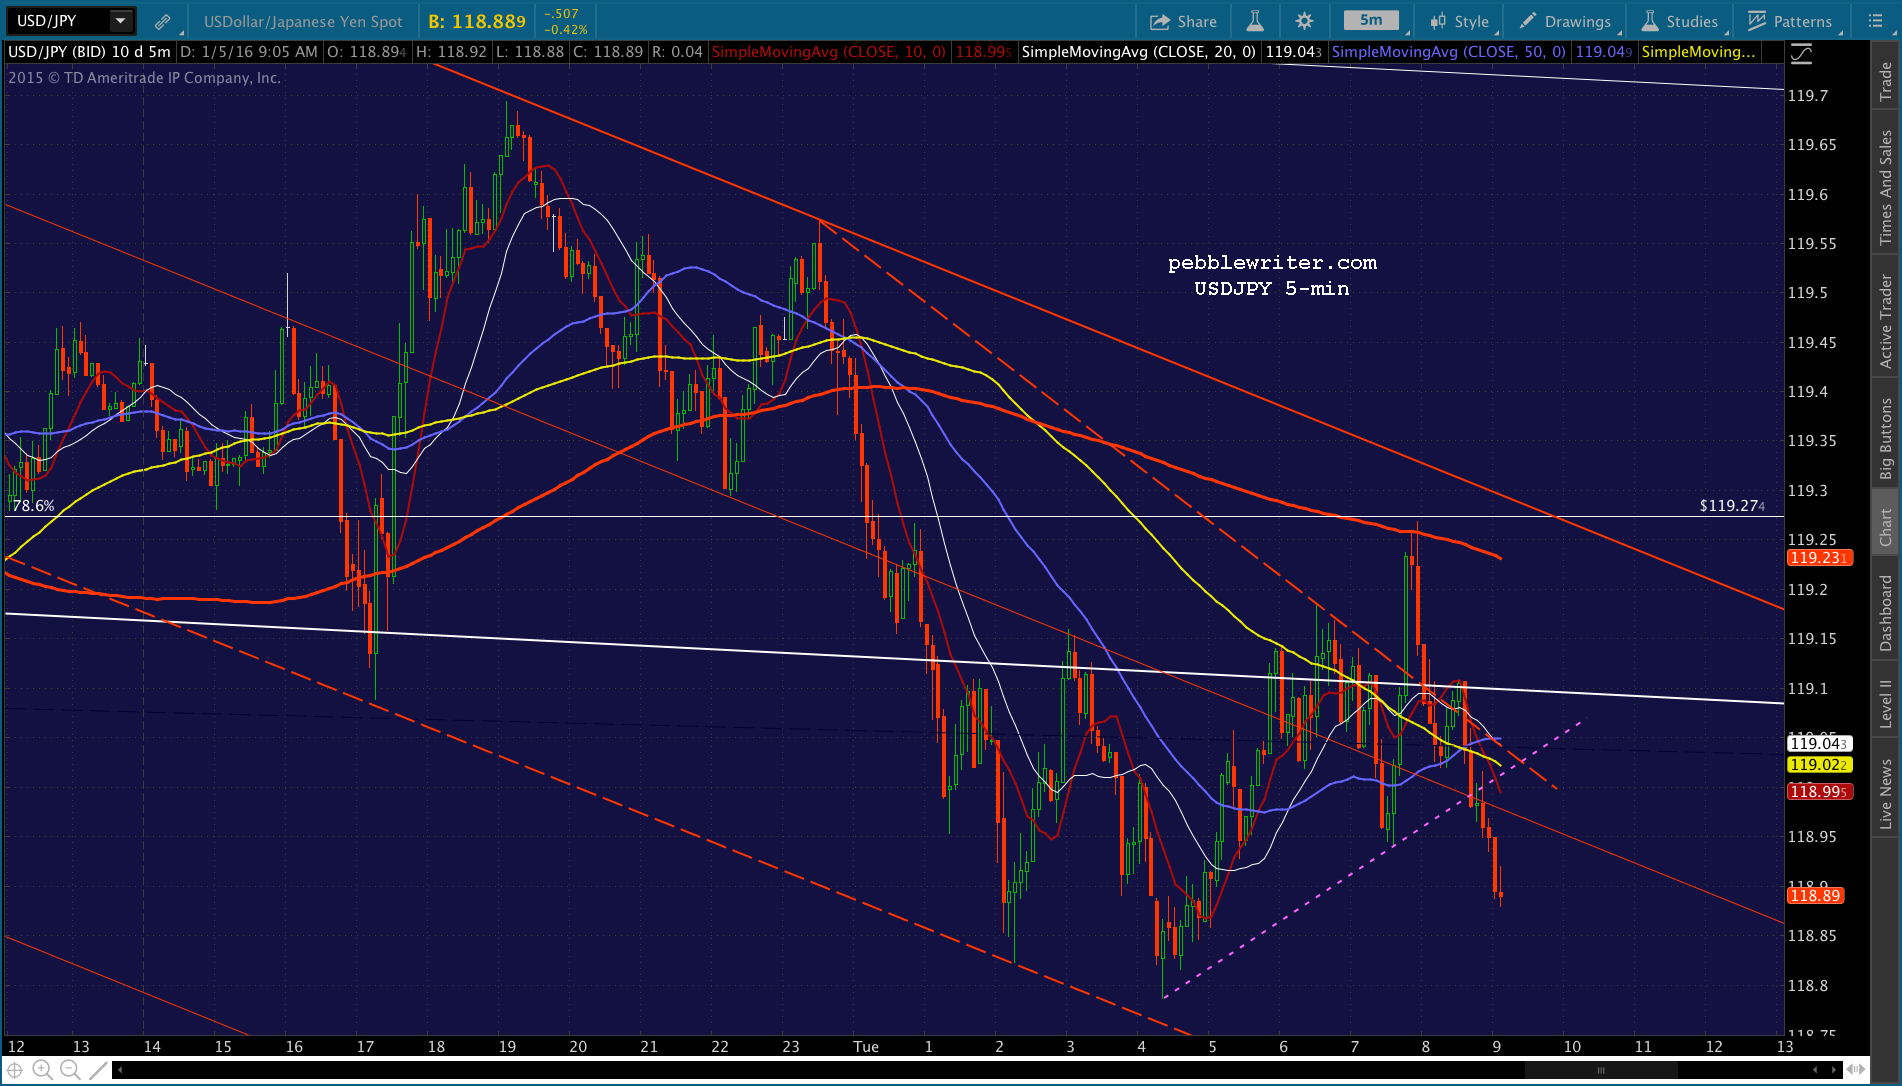 Note that CL is poised to potentially break higher again.
 UPDATE: 12:21 PM
I don’t know if it’s going to tag the SMA100 or not. But, it’s acting pretty squirrely here, so I’d go to cash here and see which way it breaks.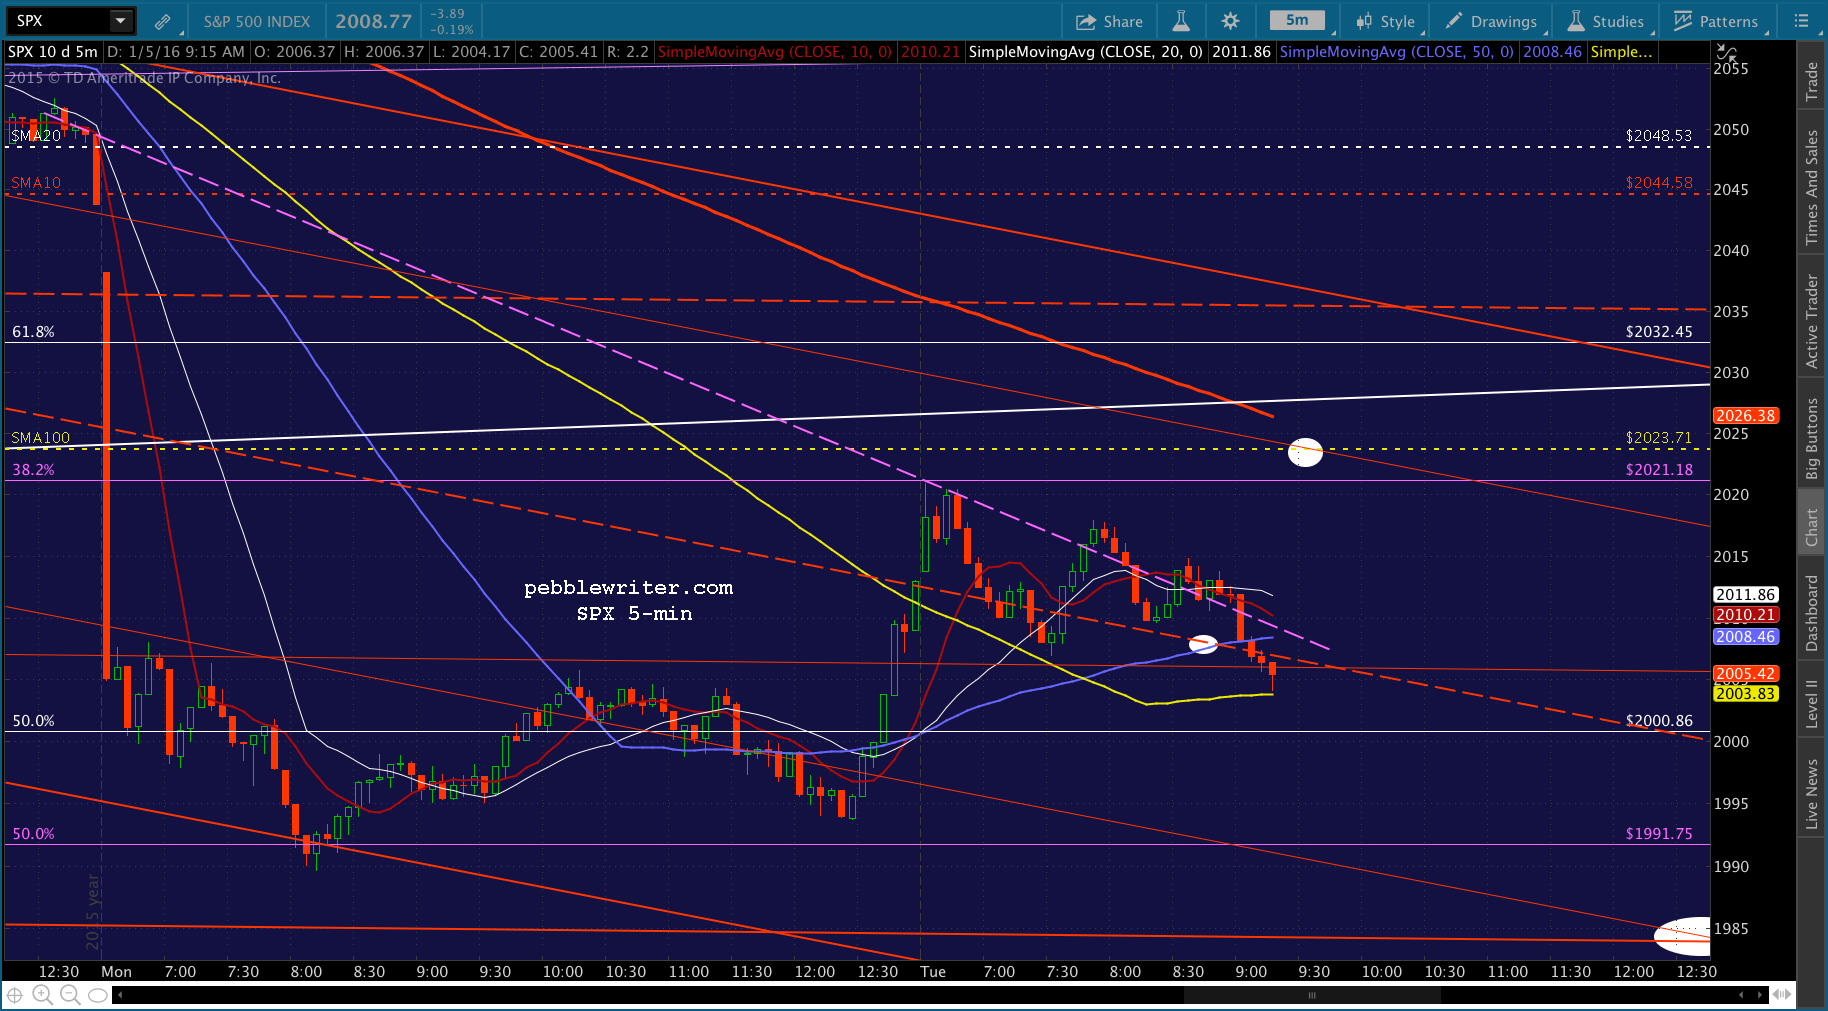 My suspicion is still that it’ll pop up and tag the SMA5 200, now at 2025.75. But, they might just rip the band aid off and go for 1984 any second. Bottom line, I’ll wait and see if USDJPY pops up and reverses off the SMA10, and CL dips below the purple TL.
UPDATE: 12:28 PM
Quick update on CL and USDJPY, which are now working SPX higher.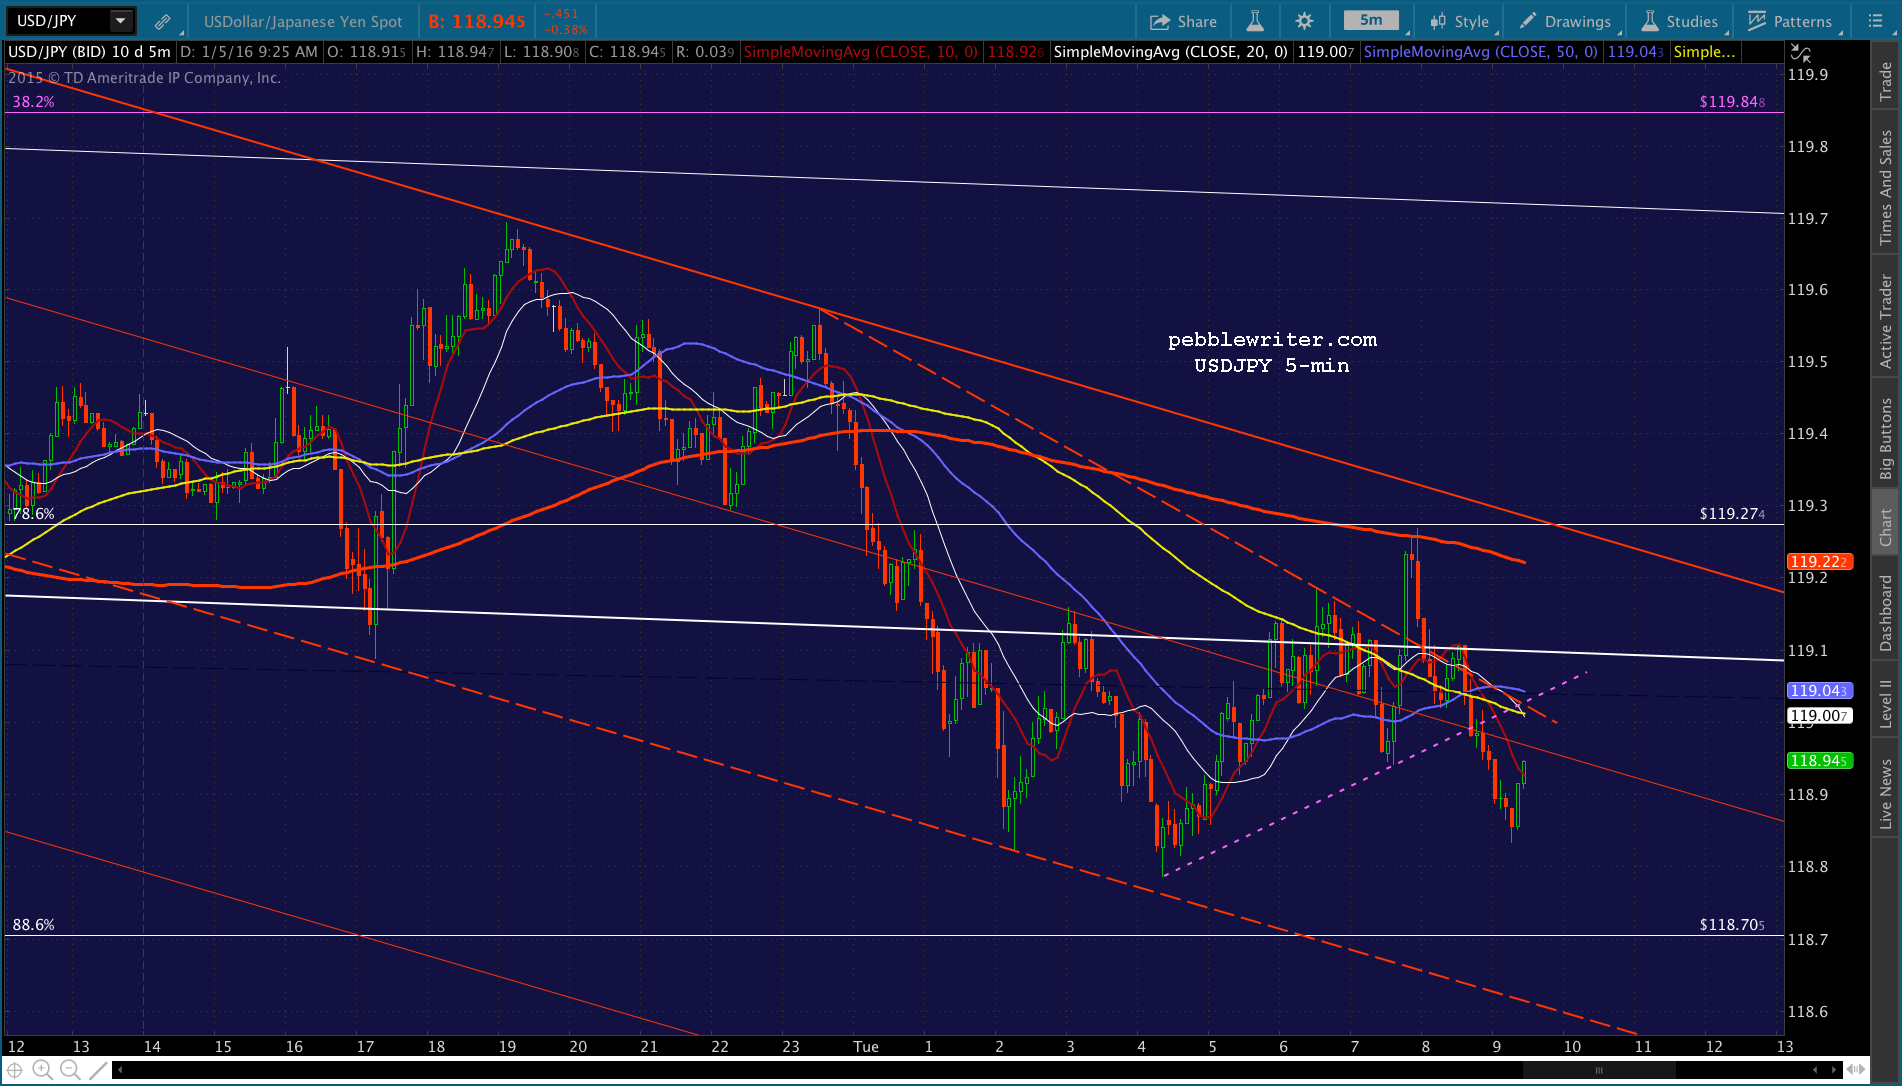
 UPDATE: 1:40 PM
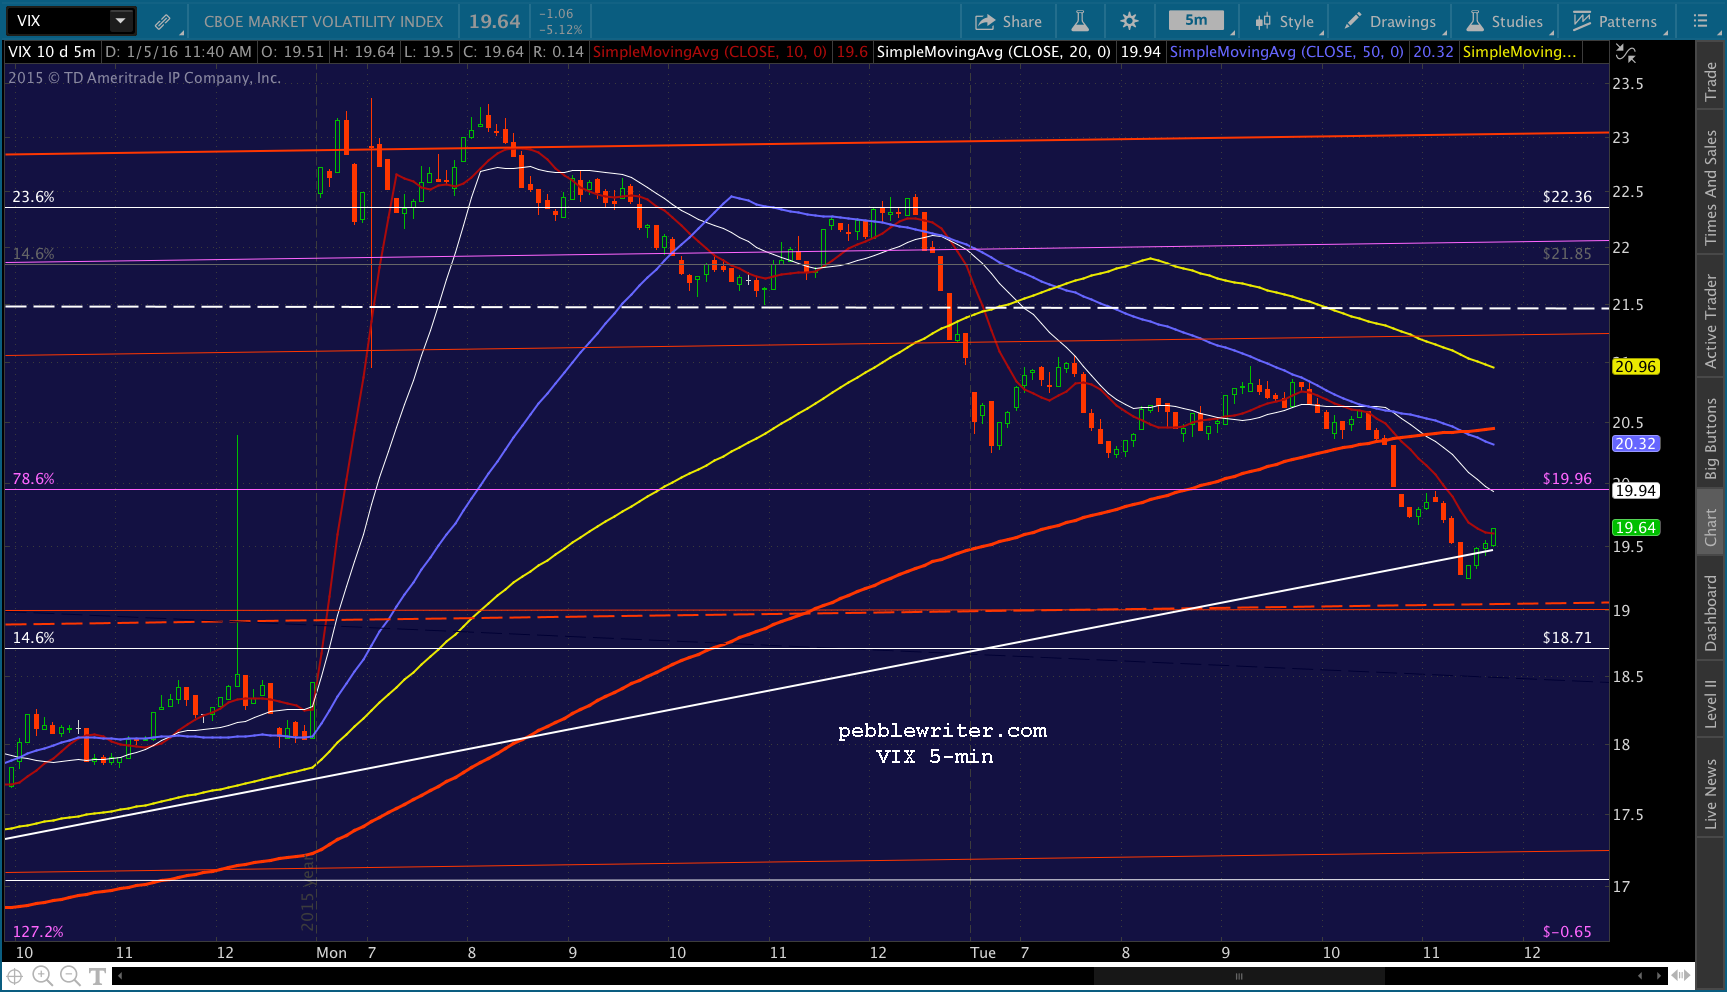
SPX just broke through the SMA50 as VIX broke down. I’d play along on the long side for the SMA5 200 or SMAD 100 at 2021.73-2024.96. VIX supports the notion of a limited bump here, as it should receive support at the white TL below.
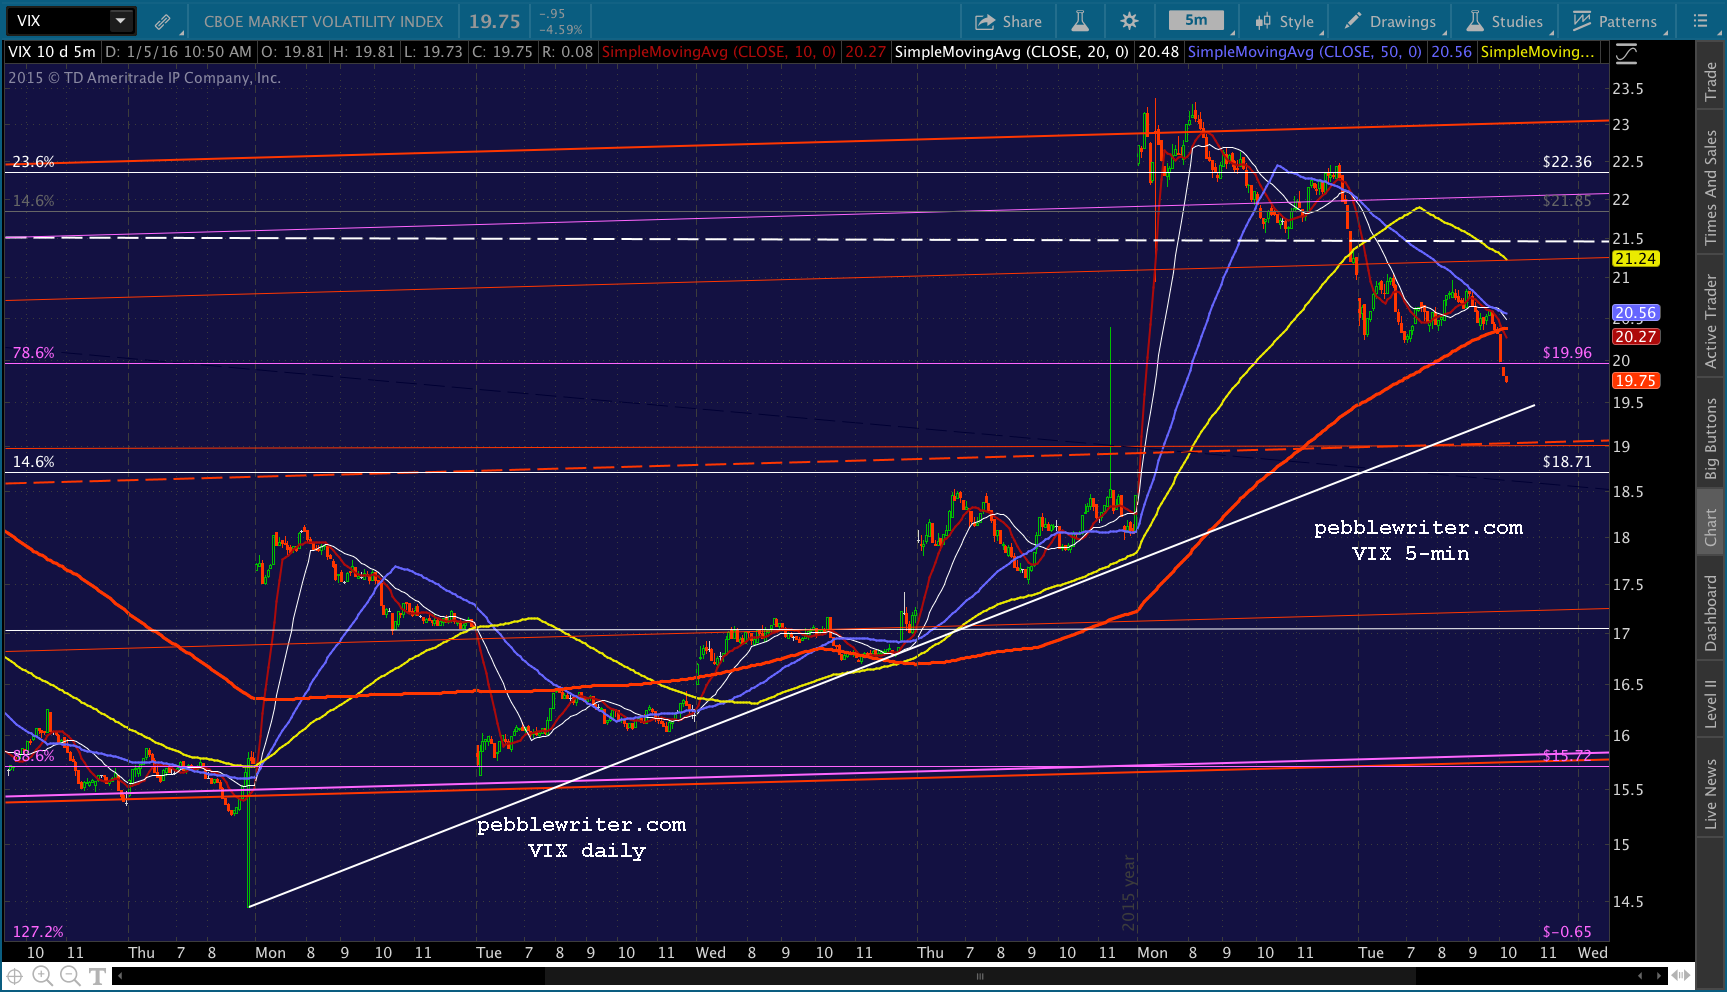 UPDATE: 2:30 PM
Punched a little higher than the SMA5 200, but not quite to the SMAD 100. There ought to be another leg left, with an outside chance that it’ll run up and tag the top of the falling red channel. But, I’ll just take profits here and jump back in if it pushes higher. Don’t be surprised if the SMA5 10 comes along and scoops it up. And, here’s the reason why…every one of them suggesting a reversal here.
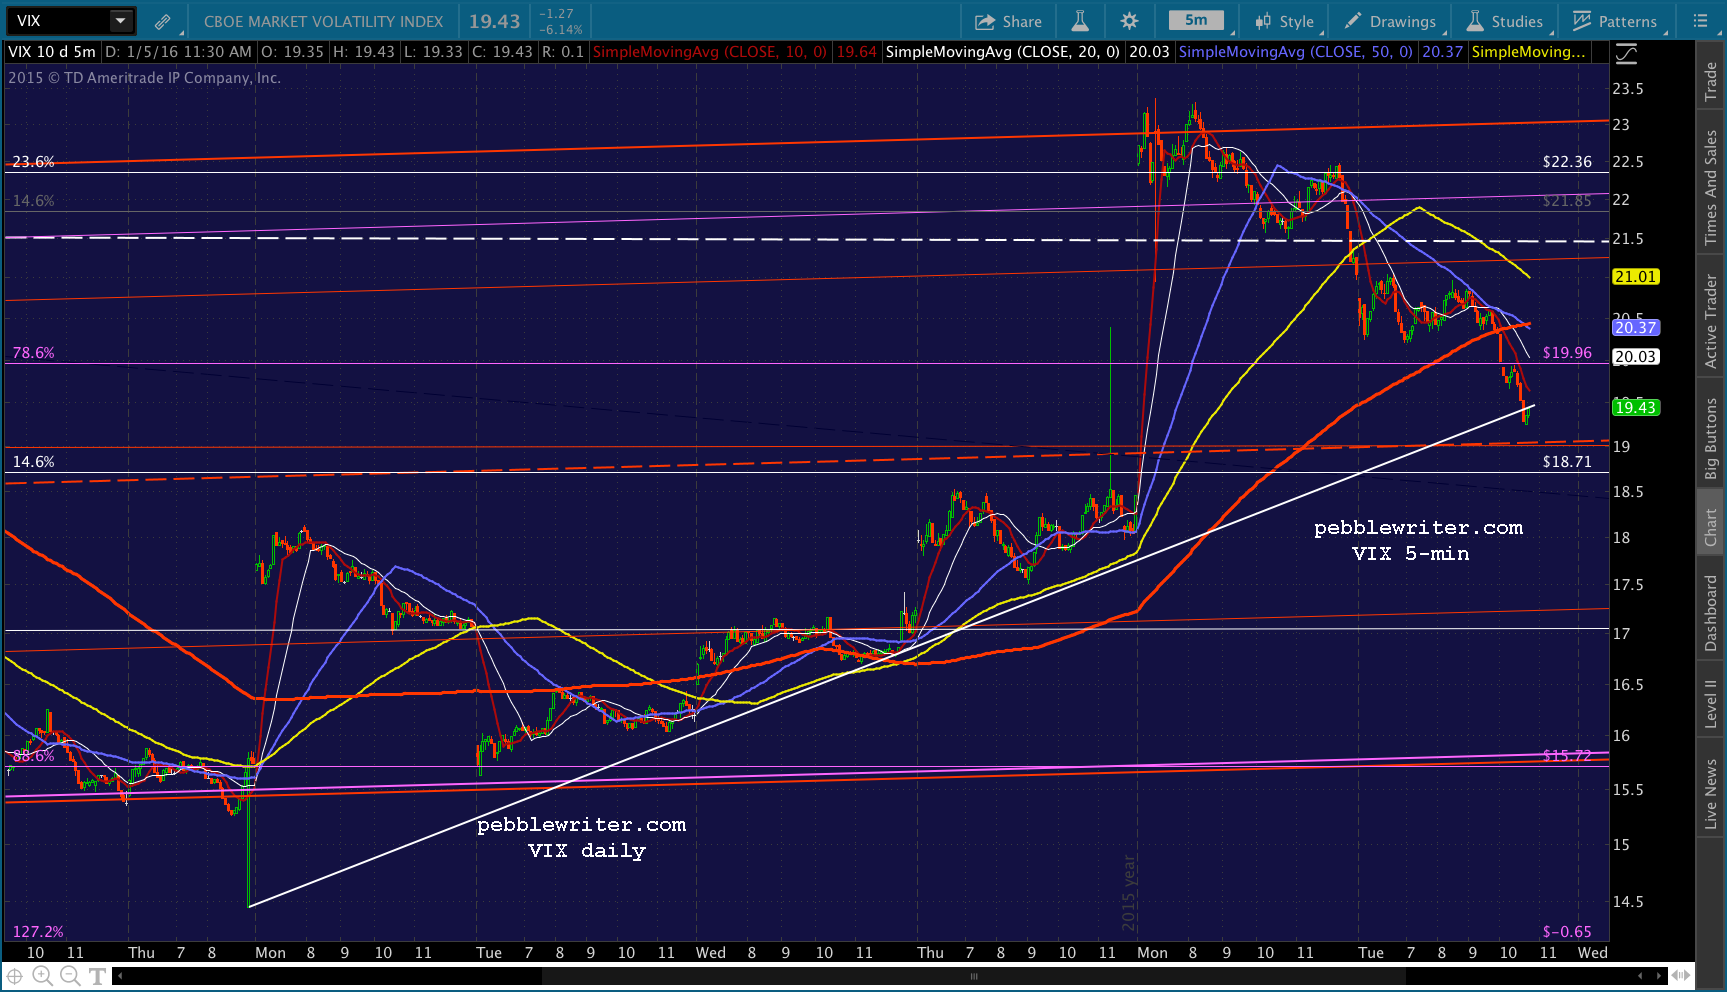
 UPDATE: 2:43 PM
This is probably a head fake, but it seems as though SPX wants to head down here. I’m encouraged enough by VIX and CL to give it a shot. Back to short.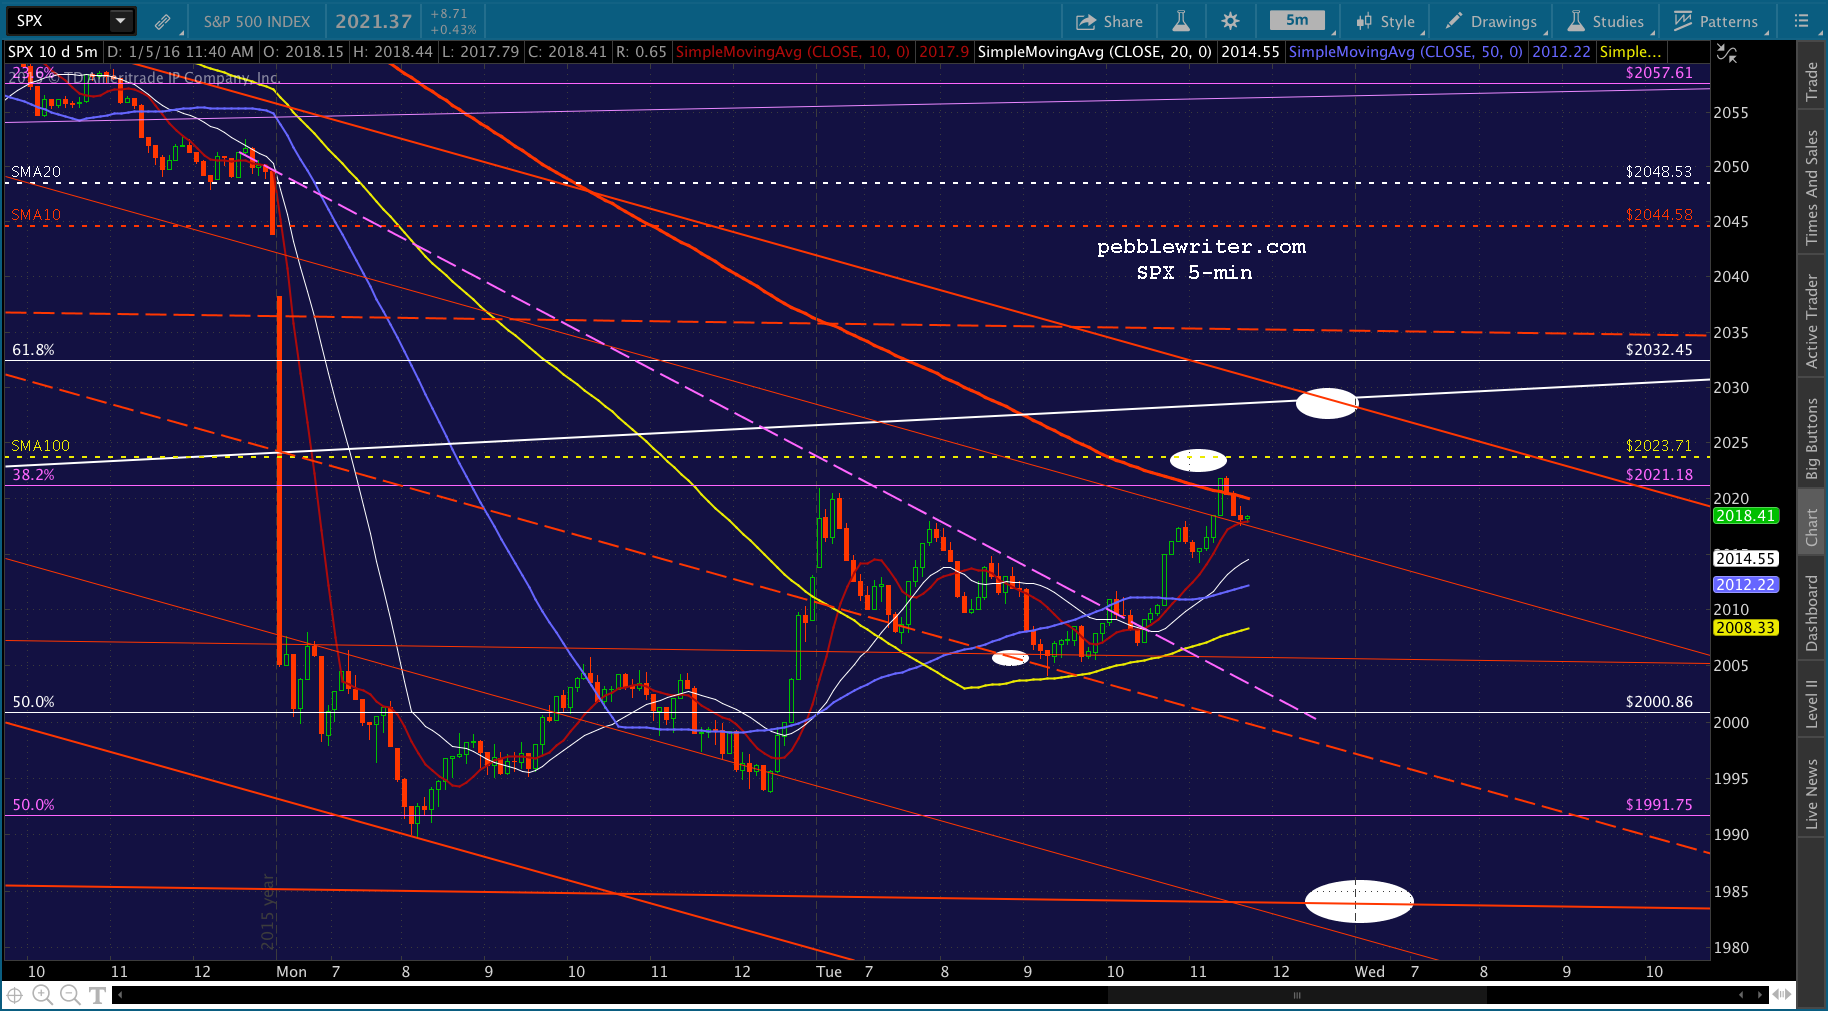
 UPDATE: 3:05 PM
So far so good, but coming up on more potential support at the gray TL/SMA5 50 at 2011.75ish. Staying focused on USDJPY and CL.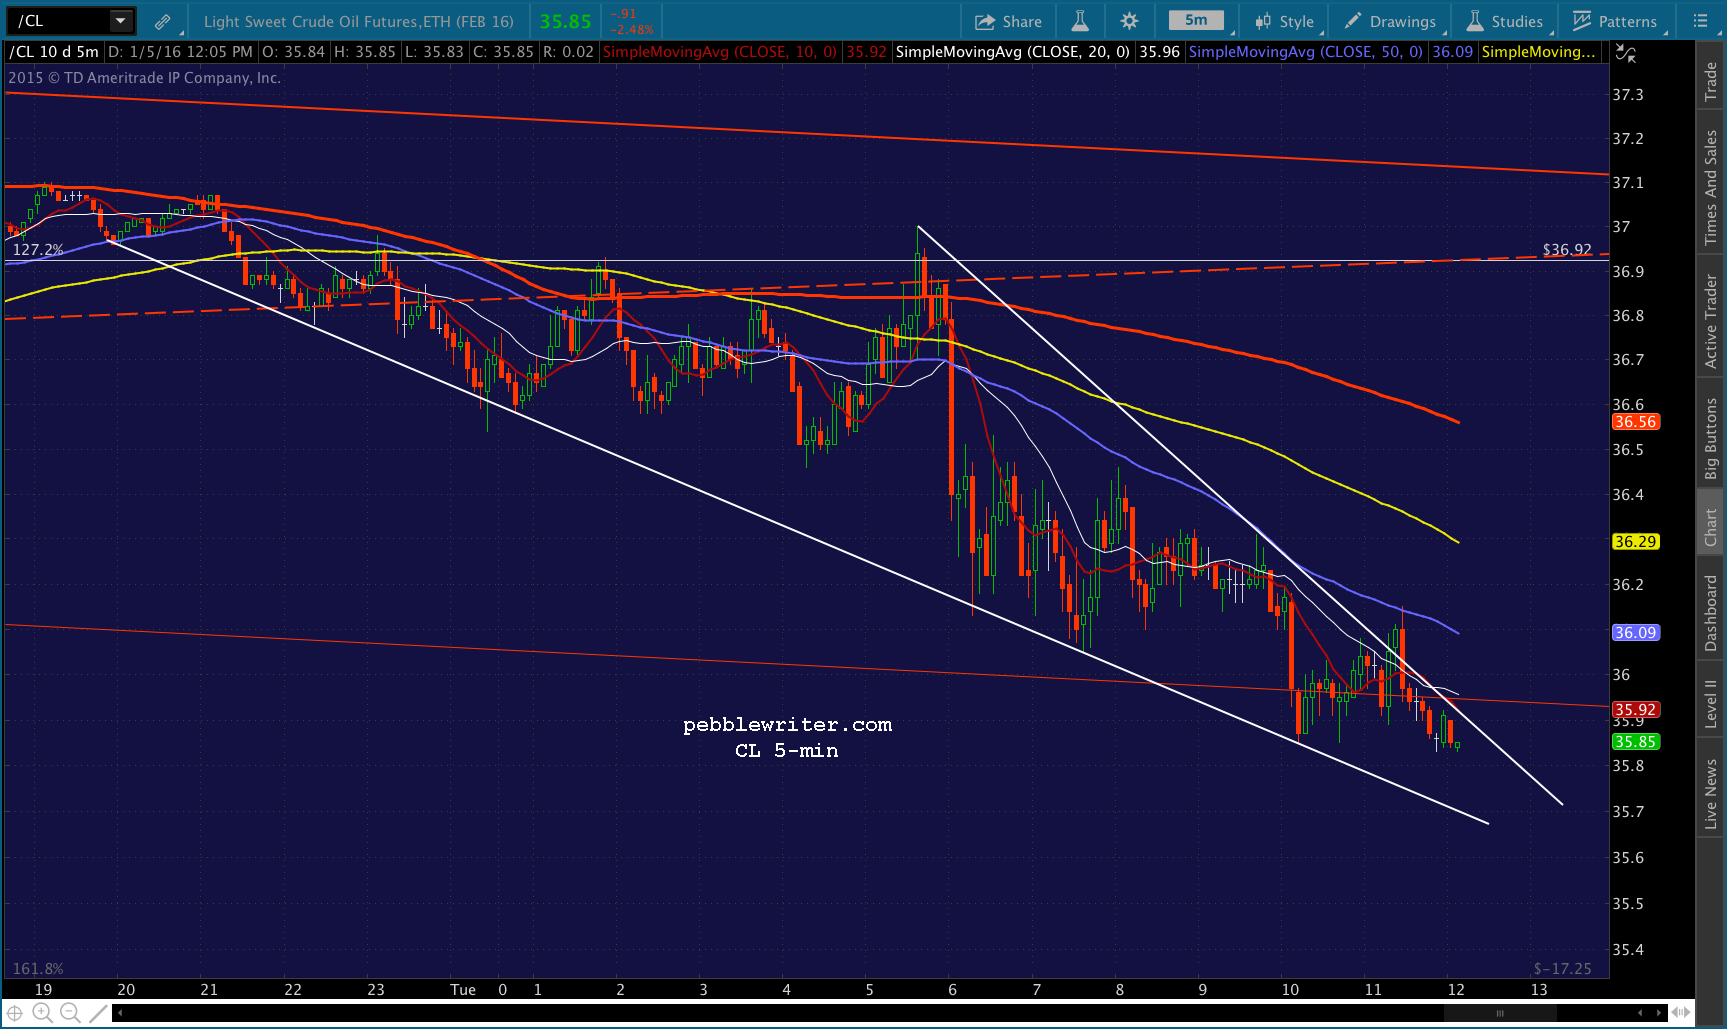
 UPDATE: 3:23 PM
Just reached support here at the gray TL and SMA50. Could bounce here, and I have to take off a little early. So, I’ll close the short and call it a day. If it drops through the TL, then stay short with trailing stops into the close and you should pick up quite a bit more – perhaps to 2000 or, with a great deal of luck, 1984. But, I think that’s more likely to occur tomorrow am.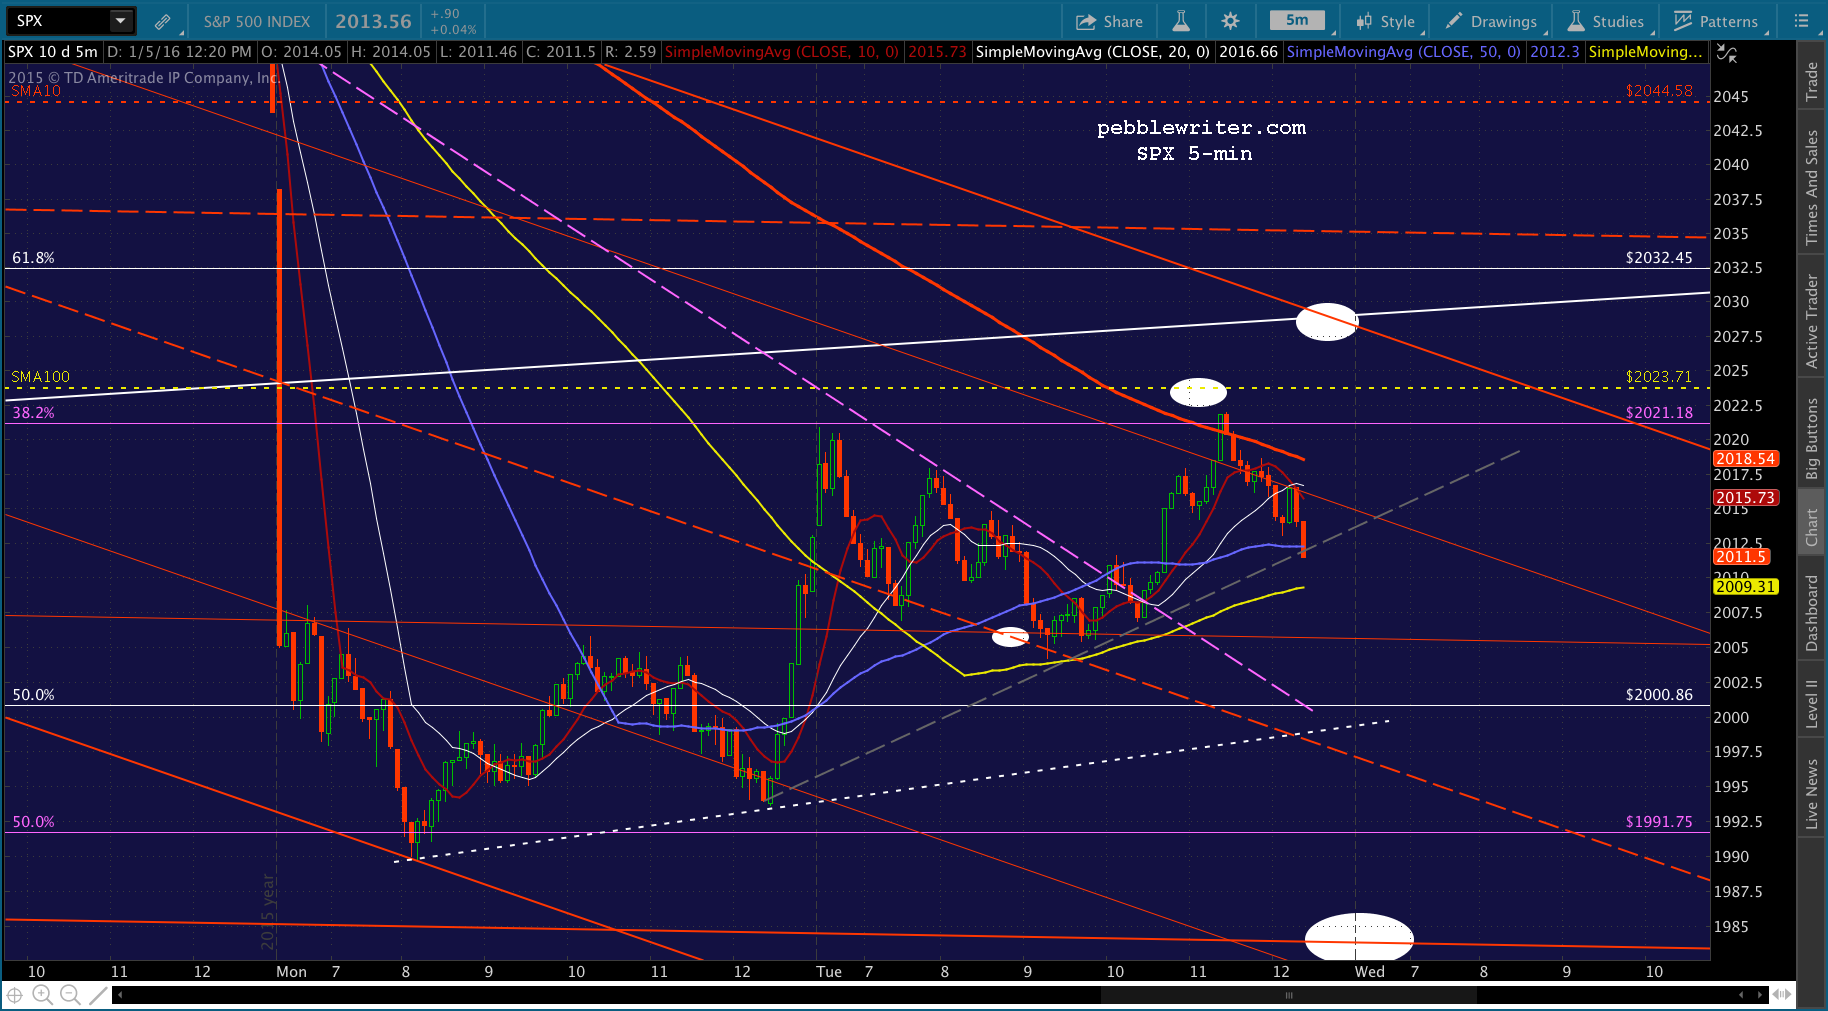 If it closes in this area, then there’s an equal chance of a pop up to the SMA100 or top of the red channel in the morning. In other words, I wouldn’t hold long or short overnight.
Comments
12 responses to “The Big Picture: Jan 5, 2016”
and u r right about getting the information out to us in a twitter feed would be good; lots of times when i see the post the trade is no longer good entry anyway at least for me
I agree elsafisk. A Twitter feed for updates would be useful. Ar du Norsk?
what index do u trade and thanks for specifying the sma levels very helpful in busy market
SPY etf is what I use long or short. Excellent liquidity and tight bid and ask.
what do you think of the risk reward of the spy versus the es or any disadvantages of either thanks for input.
They both theoretically track SPX very closely. A few differences are the trading hours (ES almost 24 hrs), the liquidity (ES much more liquid), spreads, commissions, etc. But, IMO, the biggest difference is the speed at which ES flits around on HFT input. LOTS of predatory HFT going on. And, just know that it’s often used to push SPX/SPY in one direction or the other. So, you can easily see price movements that seem like a breakout/breakdown, but no follow-through. So, in the end, just a head fake. If you’re okay limiting your trading to NYSE hours, SPY is a safe choice.
Michael, that 5 min. SPX chart on the 11:09 update with a low around 2008, bounce to 2025 area, and then down to the 1985 area is very useful for me. I have my own trend following system on the 5 min. chart and having this type of roadmap helps to highlight where I should be paying extra attention. Cheers! Neal
Thanks, Neal. Glad it helps. I imagine it’ll be even more helpful if it turns out to be correct!
If you would indicate,
smad, sma5, sma60, etc.
in your comments, that would help me.
Thanks
Will do.
is it possible for you to state where the sma levels are when you mention a reversal at that point. You do sometimes and sometimes not. Just a lot to keep track of with a fast moving market thanks
Absolutely. I will try harder to remember. Just know that if I ever forget (which is pretty likely) the SMAs are color coded: 10/20/50/100/200 are red/white/blue/yellow/thick red. On a daily chart, you can see the value for that SMA over on the right hand side in the correct color — though sometimes it’s obscured by the current price or another SMA. When I switch to 5/15/60 min charts, I usually have a dotted horizontal line in the correct color to represent the previous day’s SMAs — but, not always. They can really clutter up a chart, and mine are busy enough already.