

When we reviewed the big picture back on Apr 27, we finished it on a bearish note. With the S&P 500 at 2098.75, I wrote:
…this would be a great place to short. I still believe the yellow .786 at 2065 is in play, though it might be delayed until early next week as the red channel .236 line comes into view.
I don’t often hold short positions overnight. TPTB are experts at eviscerating bears with after-hours ramp jobs, no matter how bearish things appeared at the close. But, SPX had just failed to retake a a key Fibonacci level. Furthermore, it had just failed to break out of a bearish channel. It seemed like a safe bet. The high that day was 2099.89, and SPX has since tumbled 2.5% — a very mild decline by traditional standards. But, it’s the biggest and longest lasting decline since February. So, it matters somewhat. The question, now, is whether it will reverse at the support we identified earlier this week, or turn into a decline that really matters.
I believe the answer to that question lies in how the 2.5% decline has unfolded.
continued for members...
It’s been an incredibly choppy decline: two steps lower and one step back up. And, as I mentioned yesterday, there’s a reason why it’s been done this way. First, it allows market makers to make a lot of money from traders who are blowing a lot of money on puts and calls.
Second, it allows a decline to occur very inexpensively and without a panic setting in. If SPX declines through support during the session, sellers will rush for the exits. It could be expensive to prop up such a market.
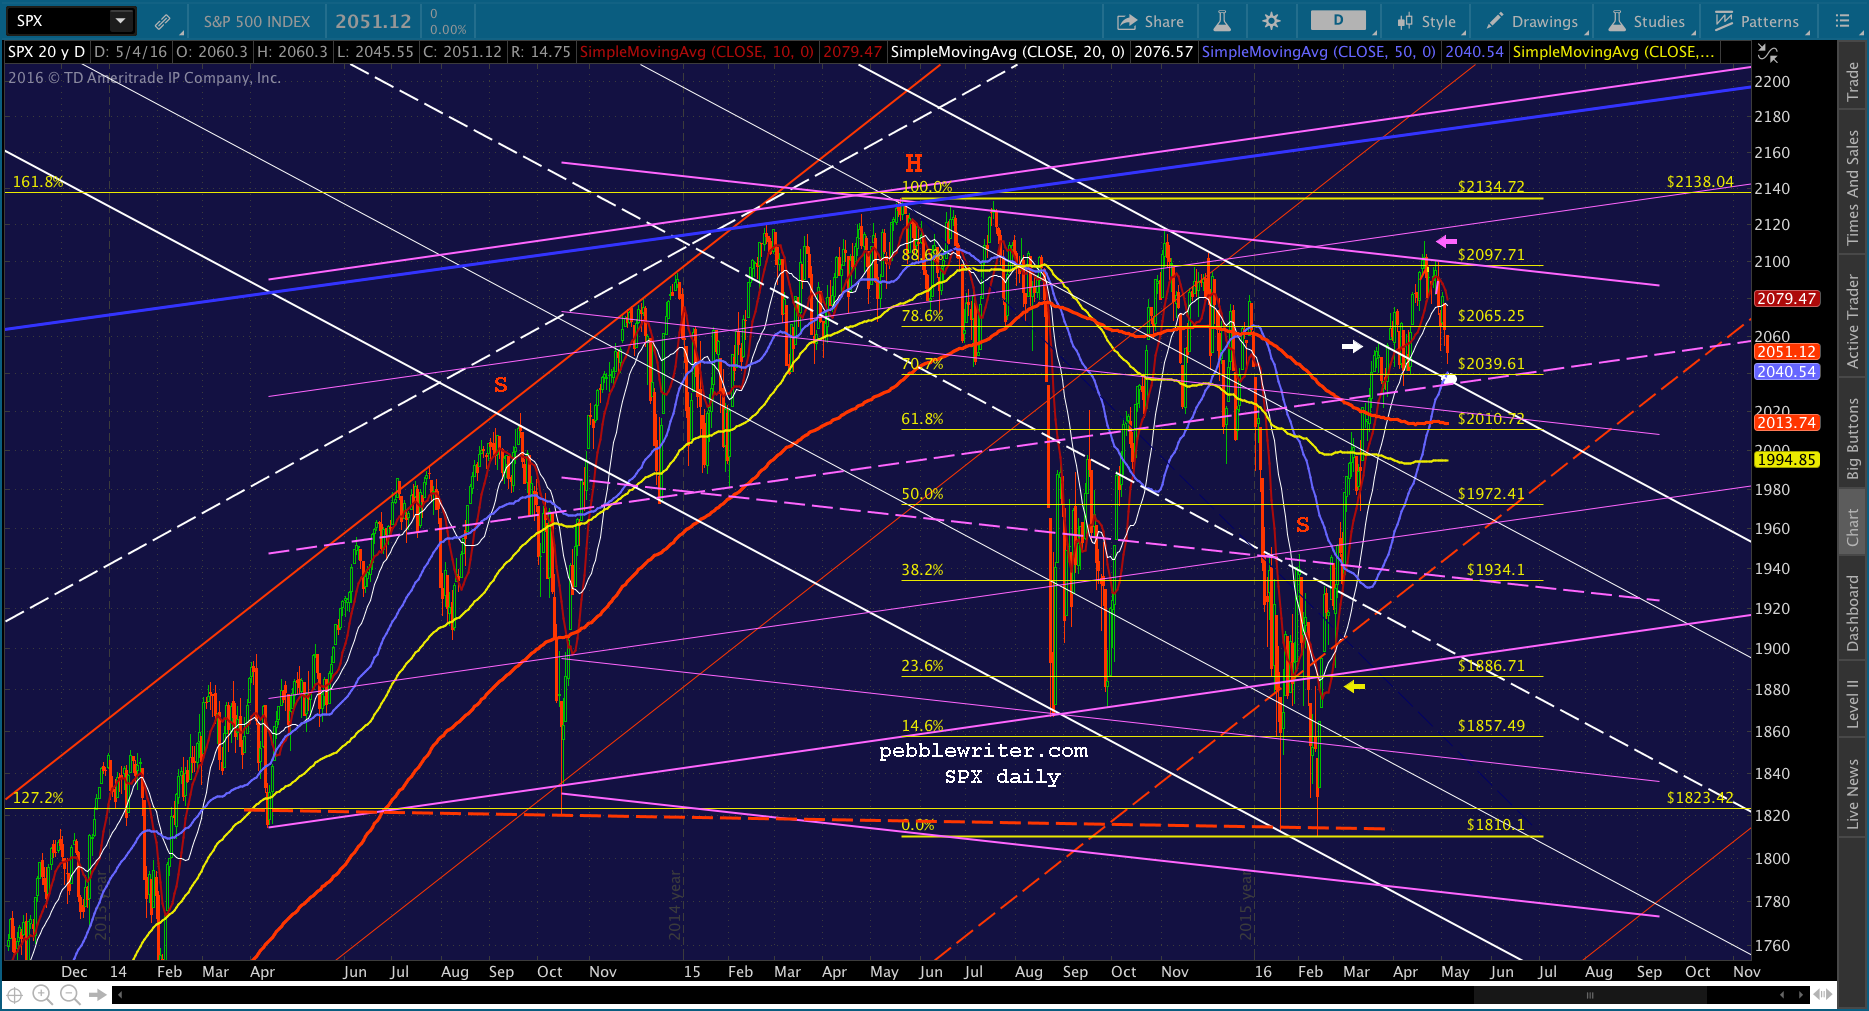
If it occurs overnight, however, then sellers have to decide whether to jump in after a decline has occurred. Given all the V-shaped recoveries we’ve had over the past 5 years, traders know this is a dicey proposition. The big picture shows a very cautious effort to complete a tag on the bottom of the rising red channel from Feb 11. They could have easily allowed it a couple of weeks ago, and it would have backtested the SMA200.
It actually would have strengthened the bull case.But, someone (aka BoJ) panicked and bid up USDJPY/CL in order to prevent any kind of collapse. No surprise, there. Stupidity, but not surprise. I can’t promise you a tag of the SMA50. But, it’s 2040.54, and SPX could easily shed 11 points this morning and tag it and the red channel bottom without violating the purple channel midline (the channel it broke down from in Jan-Feb – yellow arrow.)
More importantly, this would backtest the gray channel that it broke out of (the white arrow) on April 12. I’ve highlighted the channel in white below.
 It could happen any time between now and then, and it could even wait until Friday or Monday. But, the point is to backtest and, thereby, firmly establish support in order to legitimize another push higher.
If the white channel doesn’t hold, then the SMA200 down at 2013 becomes the next bogey. It’s just above the yellow .618. And, it”s close enough to serve as an intraday target for a vicious V-shaped bounce back above the purple channel midline.
If the white channel ultimately holds, then we’re looking at another effort to break out of the falling purple channel. Note that it’s very well-formed, except for the failure to tag in February, as TPTB successfully aborted a huge H&S Pattern (red neckline) that would have targeted SPX 1500.
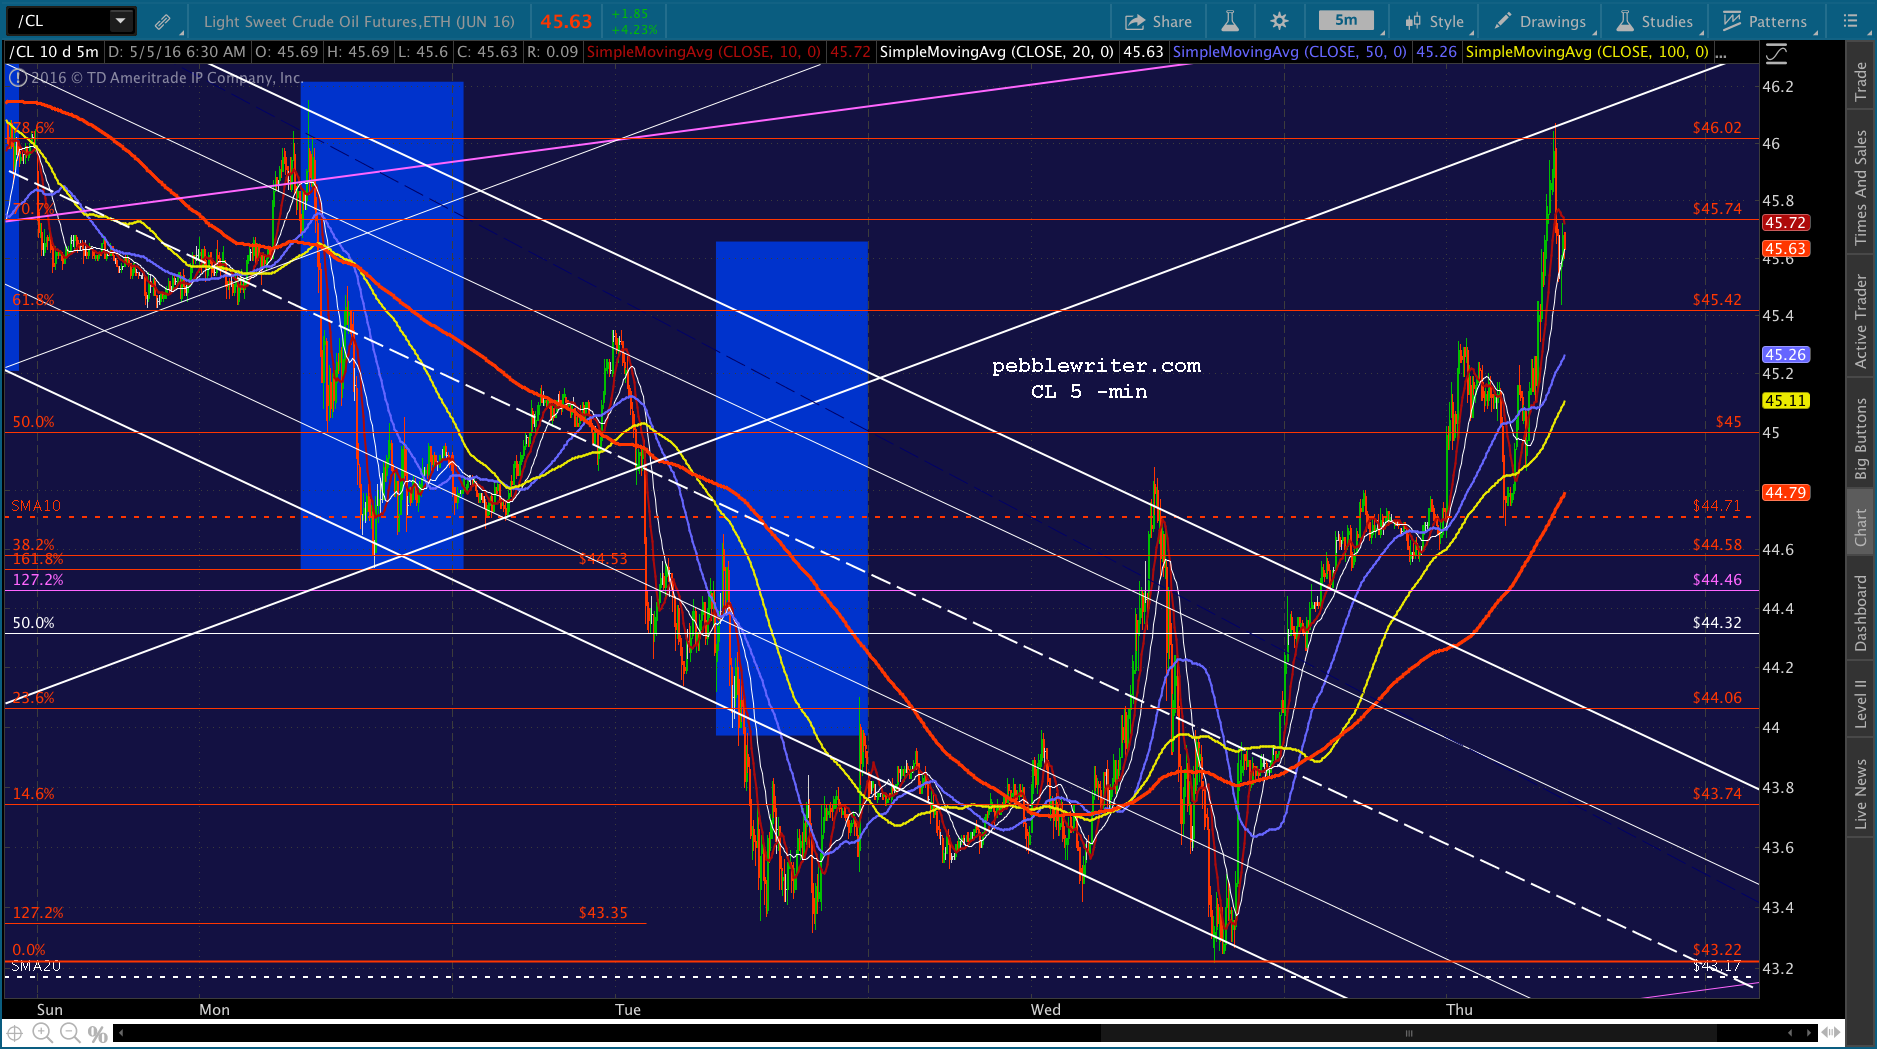
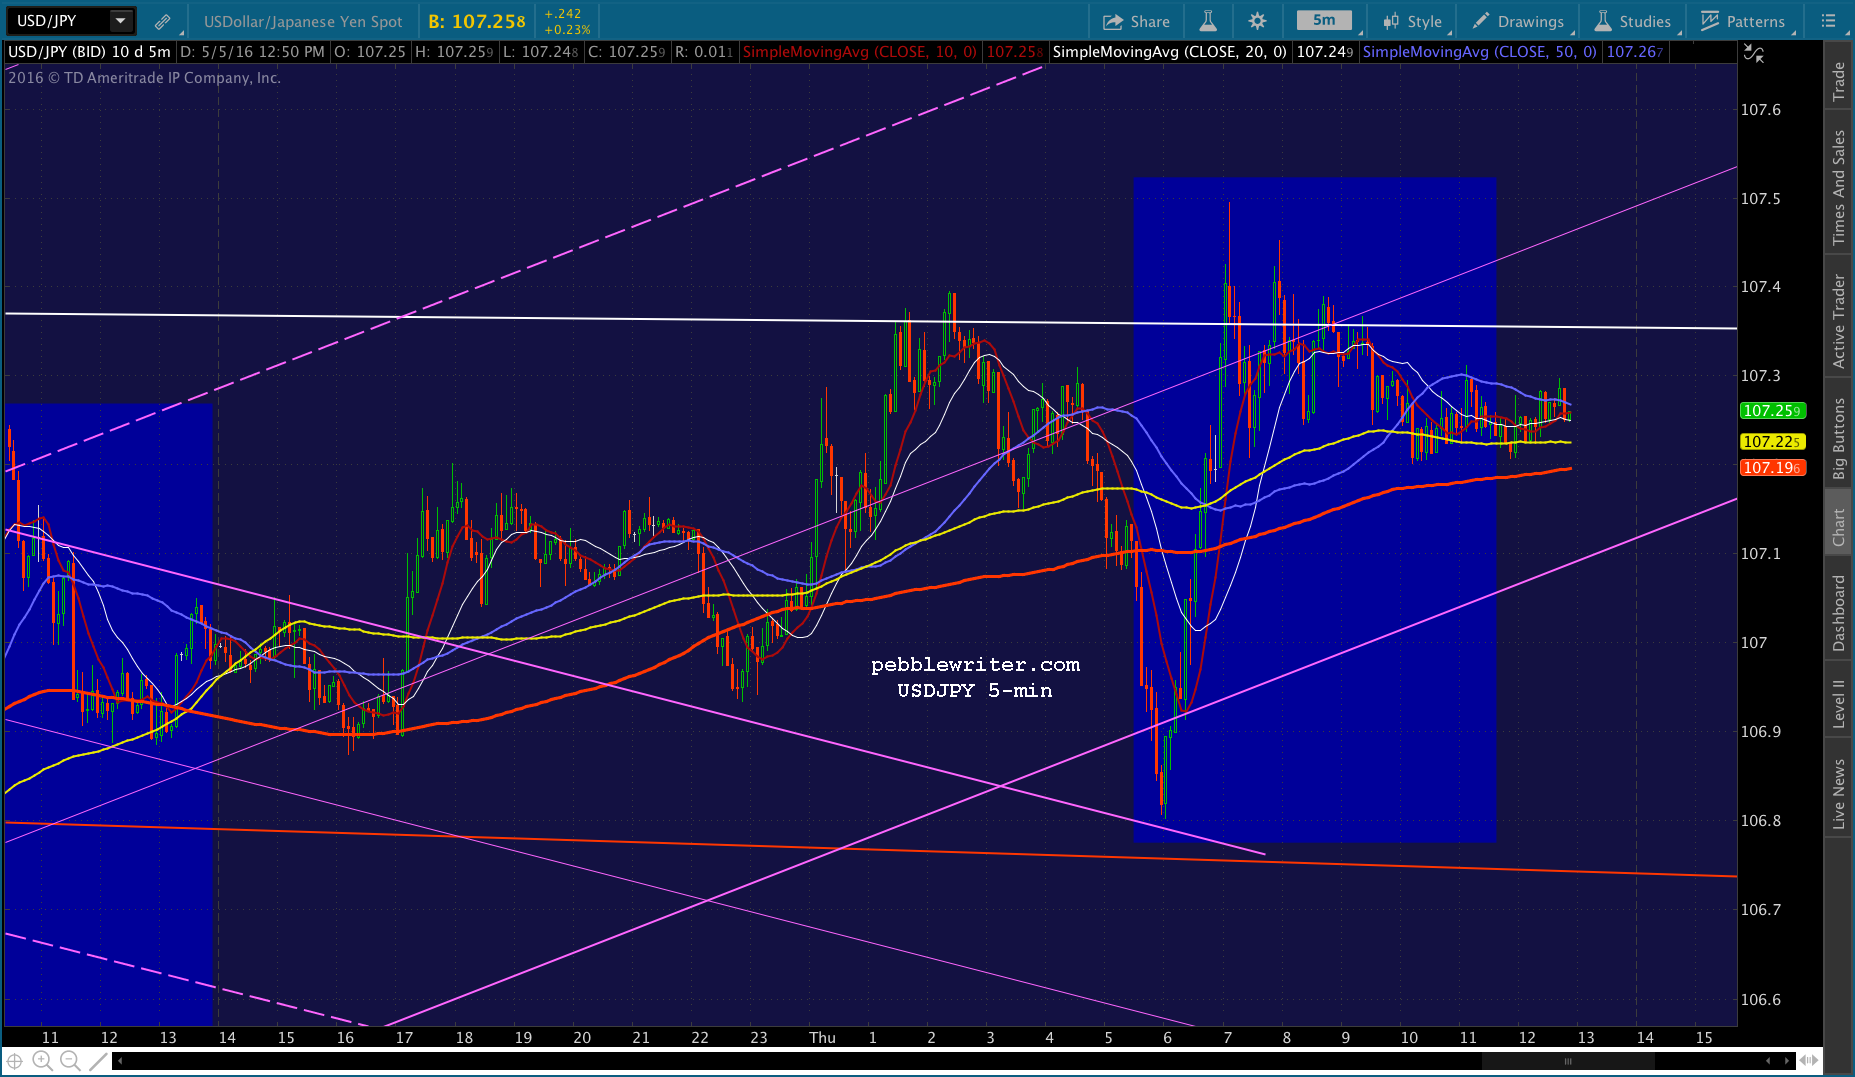
The futures were up last night, so the implication is that today might be positive on CL’s huge rally. 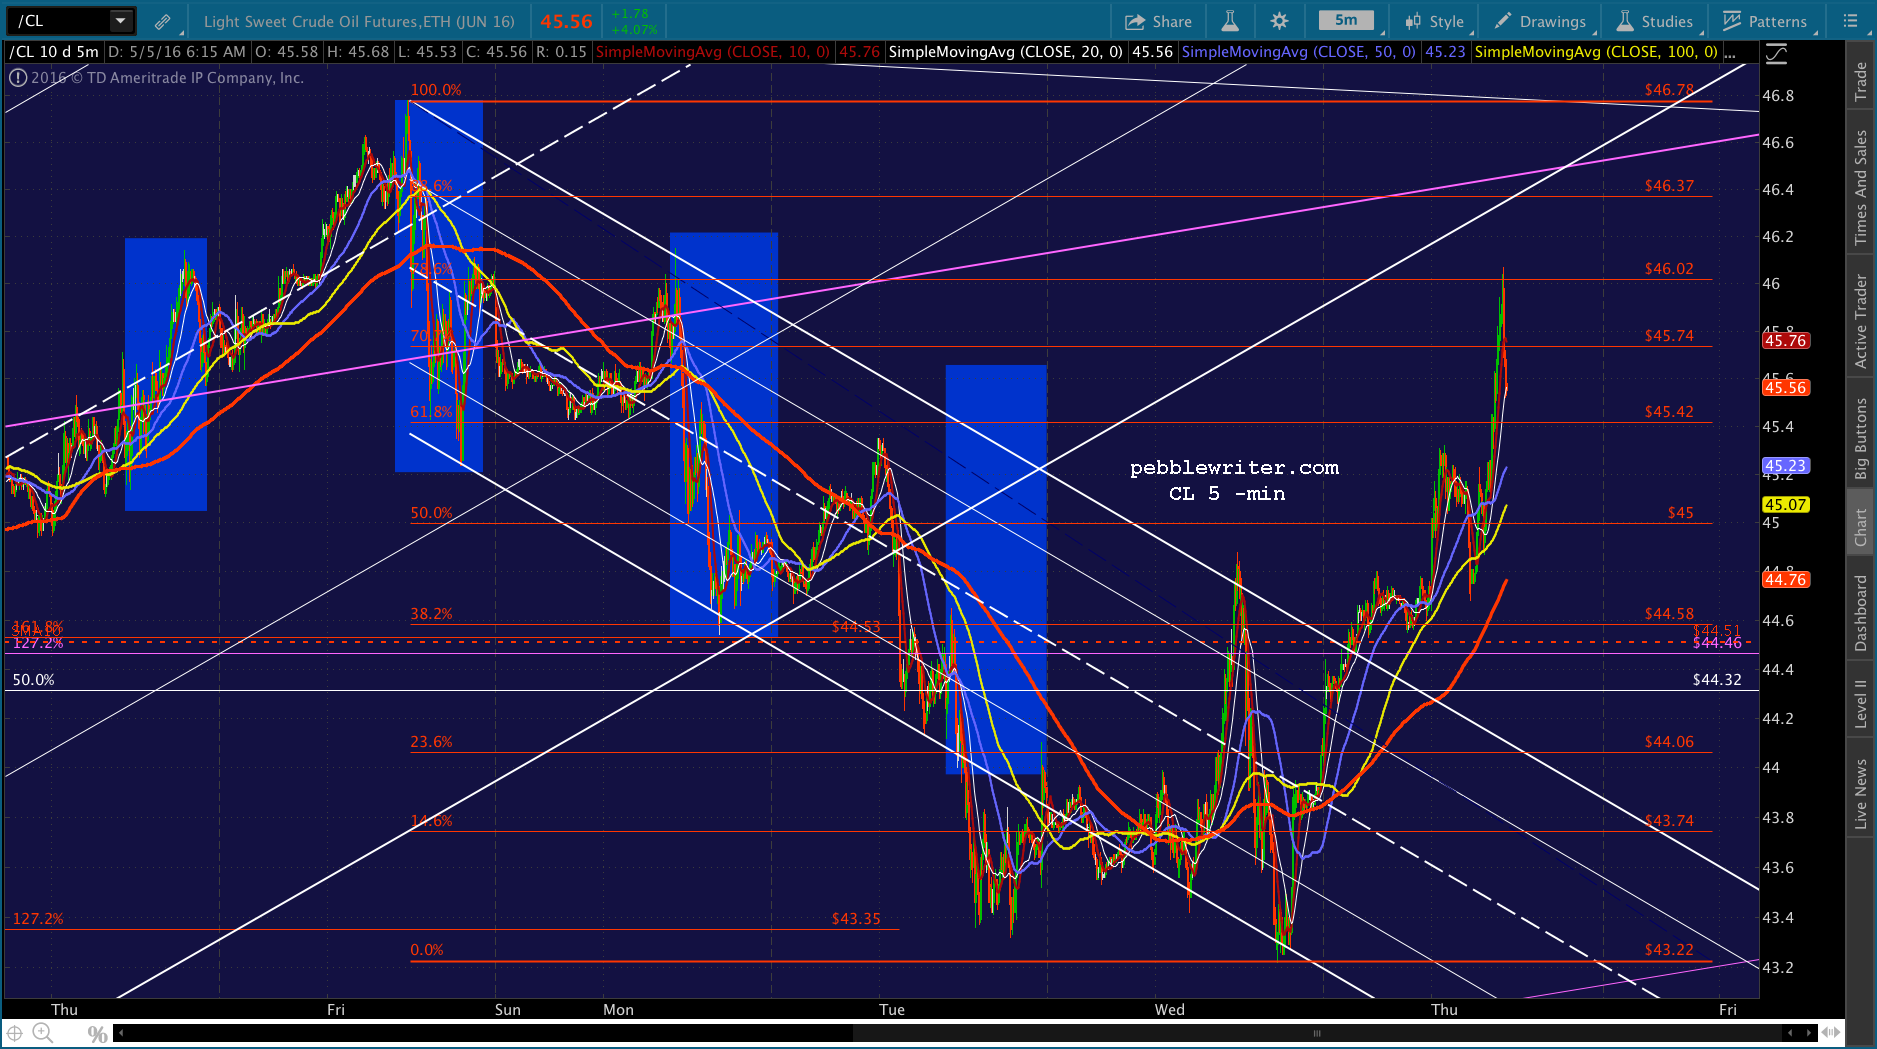 However, USDJPY is dipping below the rising purple channel bottom, implying that the rally might be short-lived.
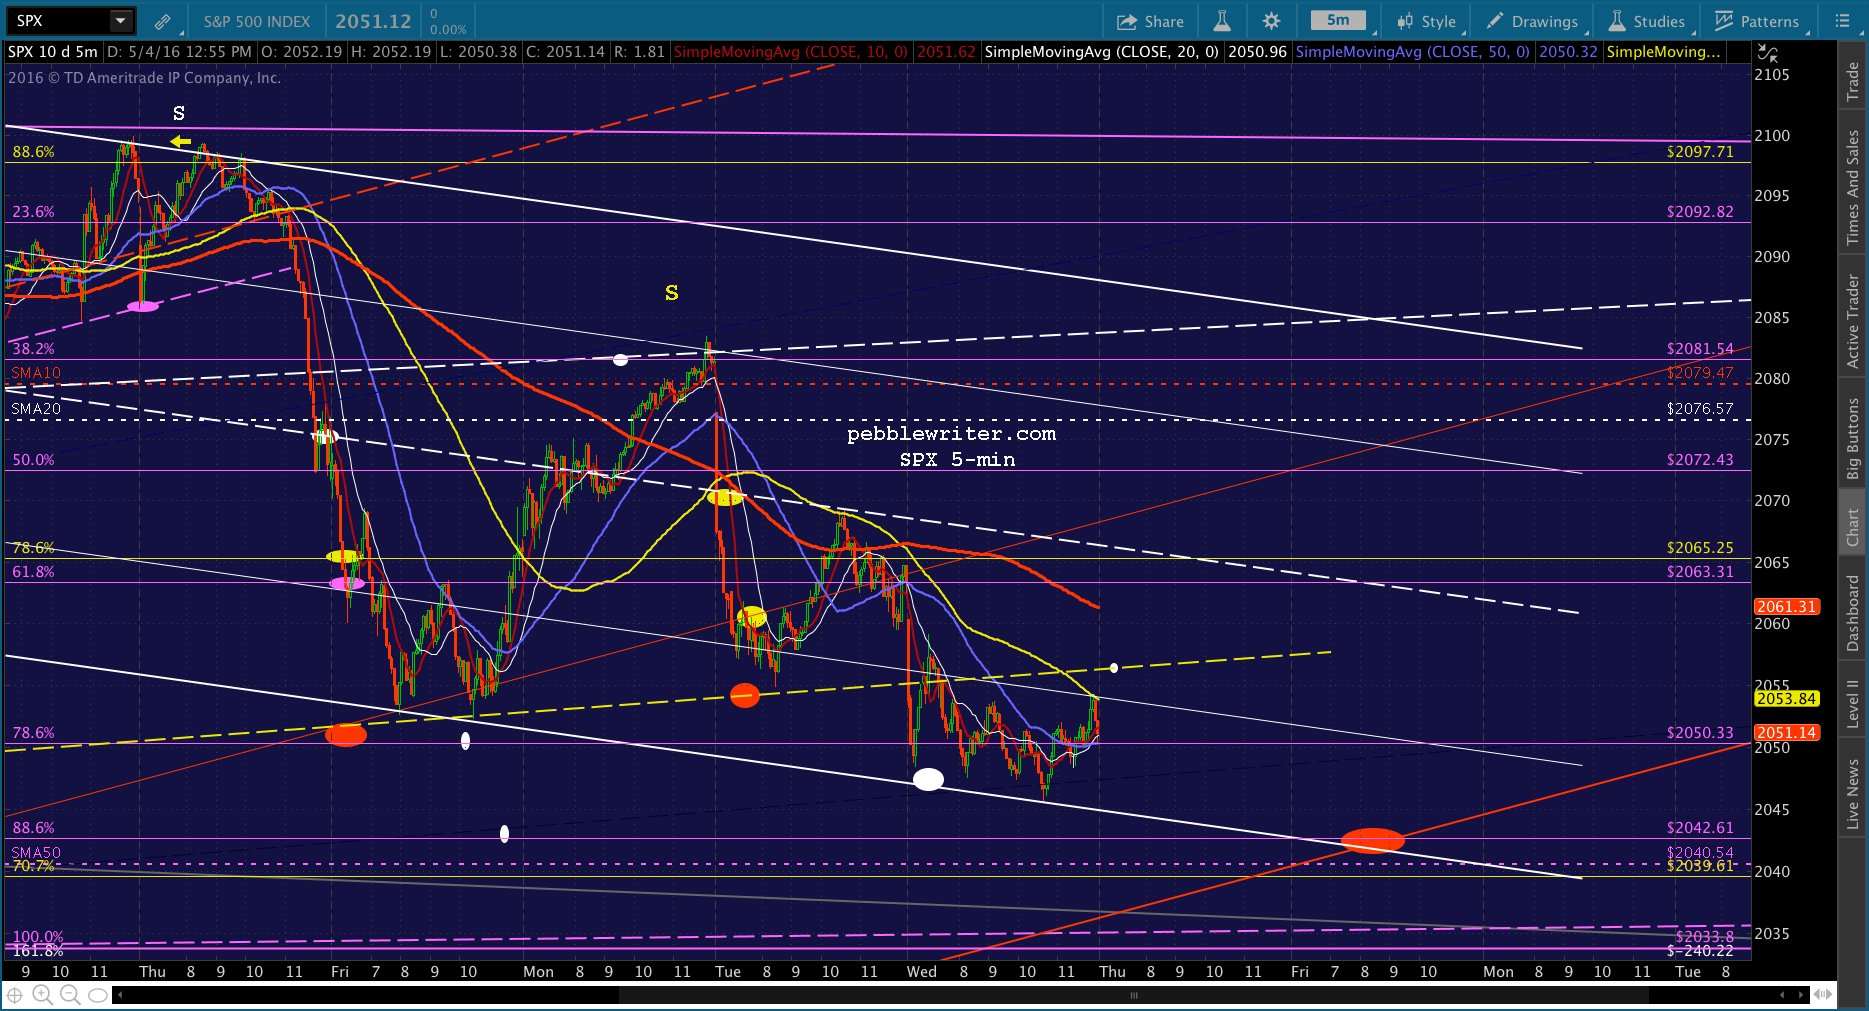
 If they intend to tag 2040 today, then look for this morning’s bounce to fizzle out at the yellow neckline or even the SMA5 200 currently at 2061.31. If it pops above the neckline, I’d ride along and look for a reversal later in the day as is implied by the timing of the intersection between the white channel bottom and the red channel bottom.
 Stay tuned…
UPDATE: 9:33 AM
SPX just tagged the yellow neckline on a USDJPY rebound, but CL is really tanking after backtesting the rising white channel. So, if you didn’t hold short overnight, here’s another chance.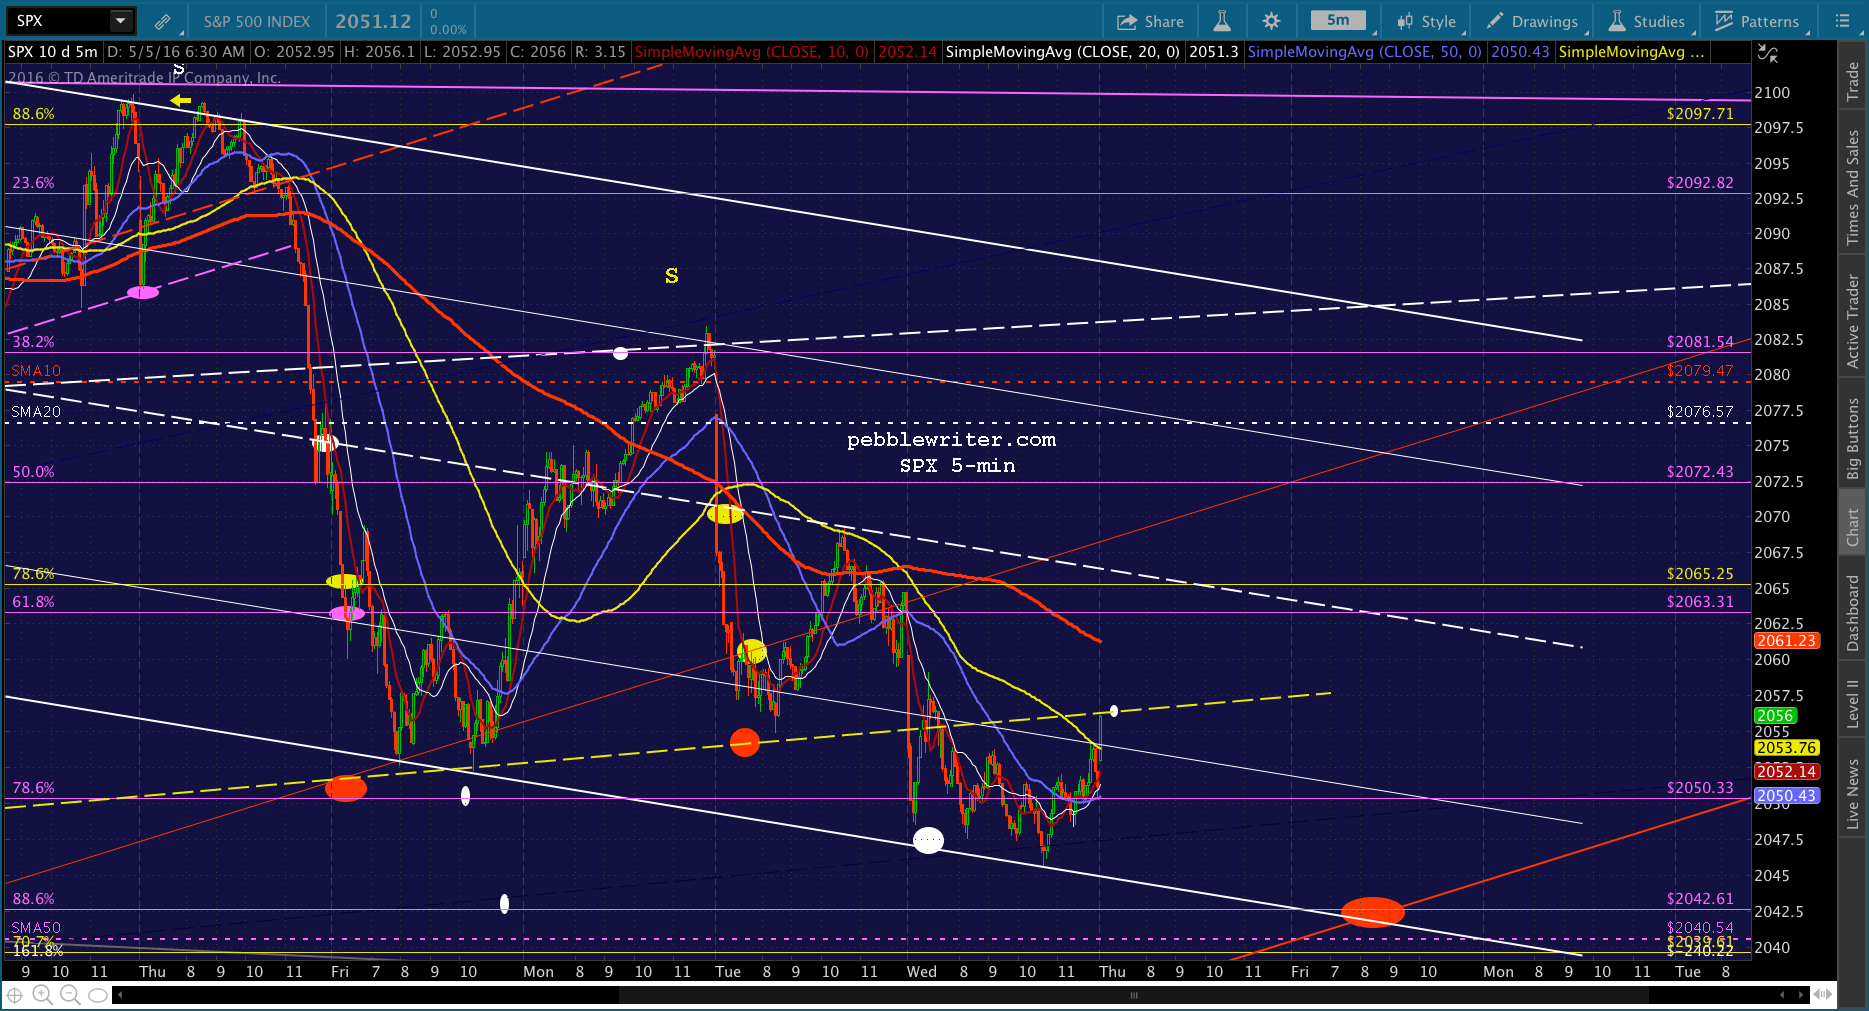
 UPDATE: 10:05 AM
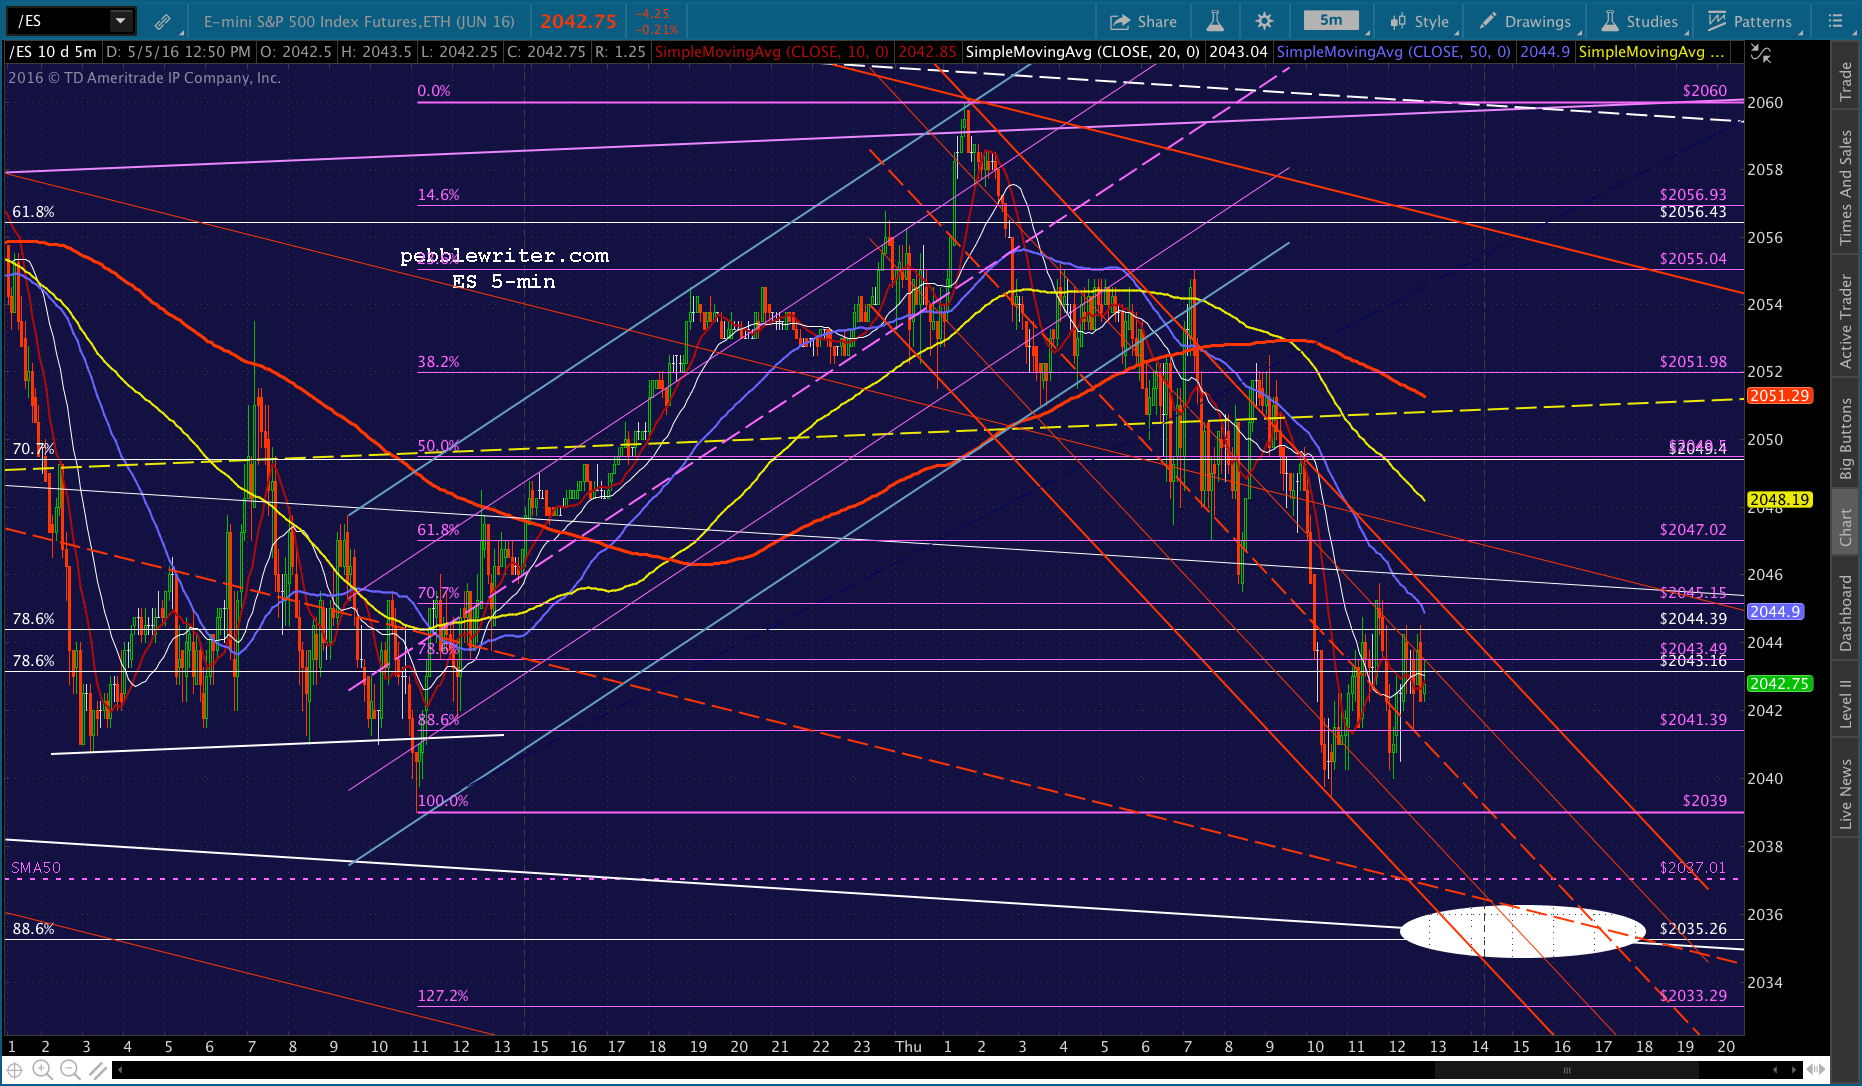
SPX is pushing up through the neckline again, probably headed for the SMA5 200 now at 2060.66.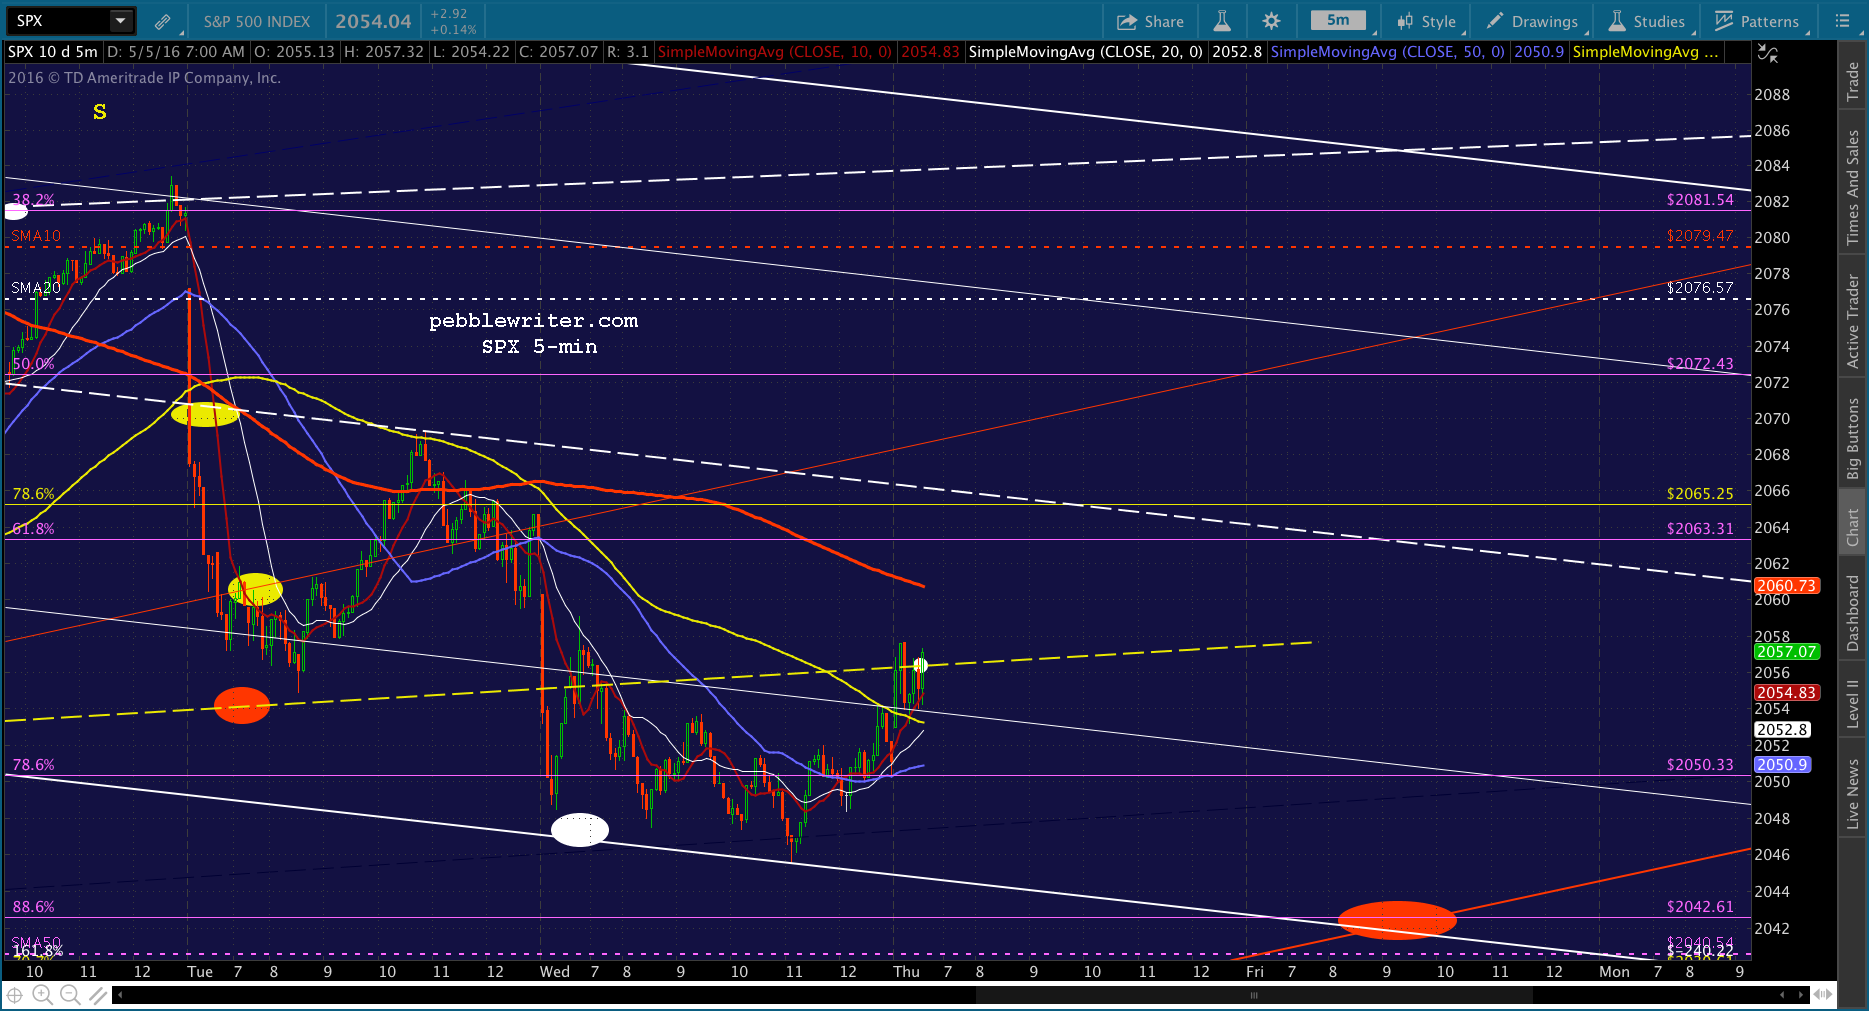 There’s not a clear channel to track it with. But, there is for ES — which is showing a slight breakout that’s being limited by the purple channel backtest and SMA5 100.
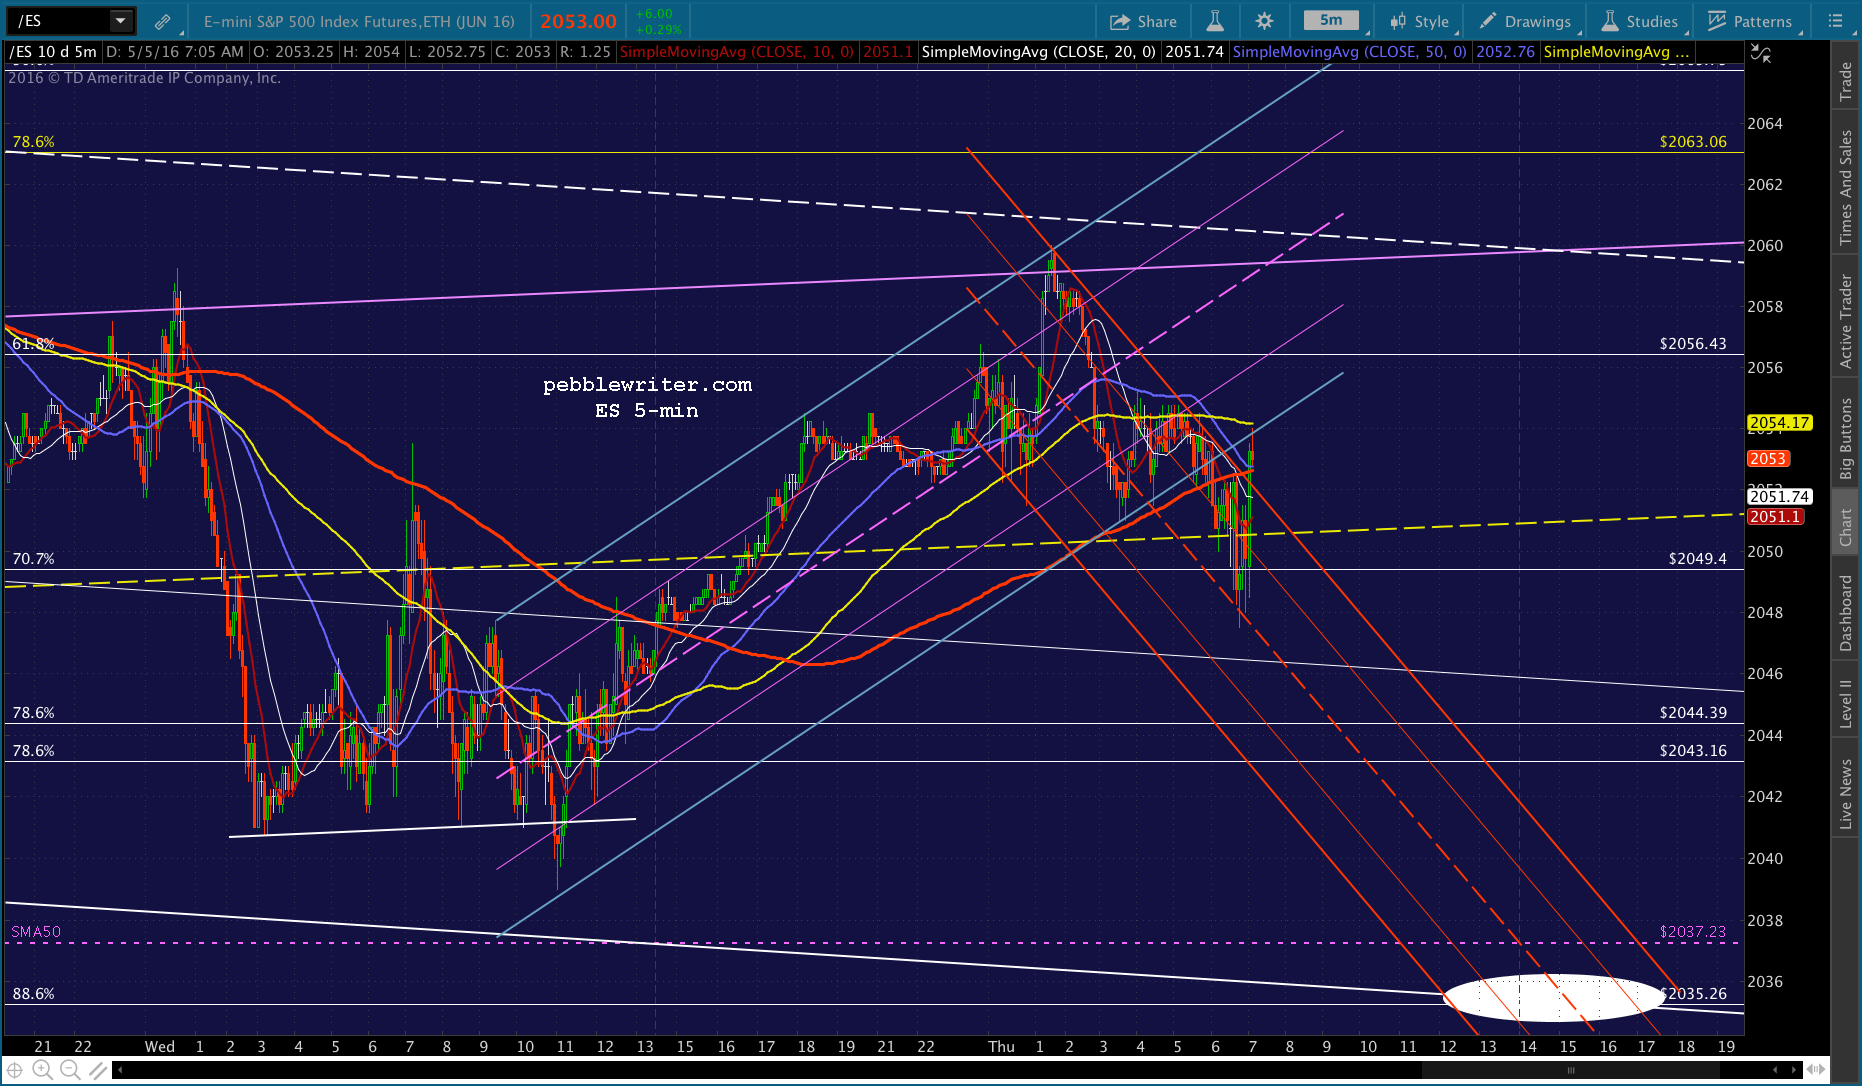 Could switch to long here, but I believe we’d be switching right back to short. From both ES and SPX’s 5-min charts, it appears the SMA50 tag could be tomorrow if it doesn’t happen towards the close today.
UPDATE: 3:47 PM
Just a few minutes left, and it’s still up in the air whether it happens today or tomorrow. My guess is tomorrow, meaning one more night of uncertainty. Note that ES’ SMA50 at 2037.01 is out of sync with SPX’s.
But, this will probably straighten itself out, and a tag of SPX 2043ish will suffice for both. Having said that, if ES reaches 2037, or especially 2035, or SPX reaches 2043, I’d revert to cash and forget about any positions overnight.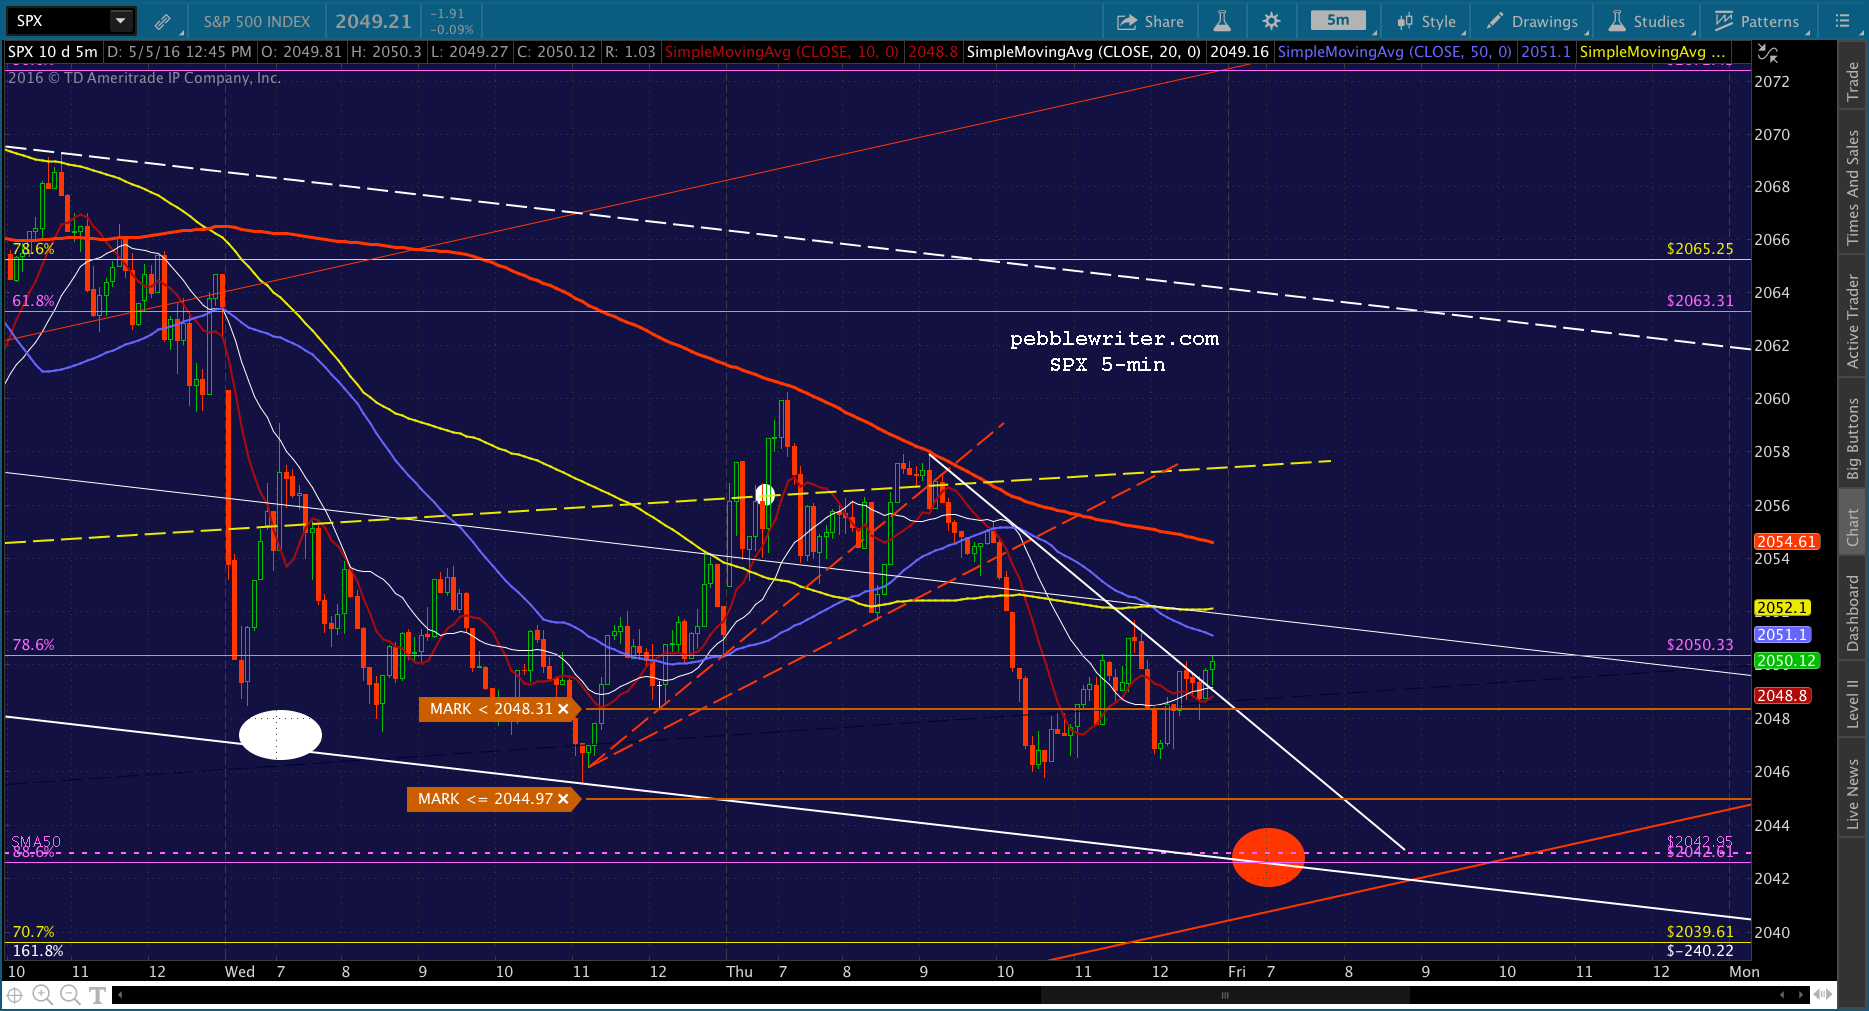

Comments
3 responses to “The Big Picture: May 5, 2016”
nice little ramp job at the end. I do like your bounce off the trendline theory. I think TPTB were trying for new highs and they just couldn’t get it done, so this is a reasonable backup plan.
I stayed short overnight, it will be interesting to see how things look tomorrow!
you think the tag may still occur today?
It could go either way. If I had to guess, I expect it to be on a gap lower in the morning. It fits the channel a little better. But, there’s still 30 minutes left, so who knows?