Tag: USDJPY

  • This Is Getting Old

    Lots of calls and emails yesterday from folks wondering how the hell the market could be up so strongly in the face of the violent unrest in D.C.

    When the capitol was breached, shortly after 2pm, the S&P 500 was already up 55 points on the day.  This came on the heels of a sharp 22-point plunge on the open.  Altogether, the S&P 500 rallied 78 points from the daily lows before finally topping out.

    We know why this happened. As is so often the case, the algos were directed to erase any signs of dissatisfaction with the events of the day: an abysmal ADP employment reading, FOMC minutes, a brewing constitutional crisis, etc.

    Note the slight breakdown of the futures around the time ADP employment (-123K vs prior month +304K and +120K consensus) was released at 8:15.  Now, see if you can tell when Fed minutes, which the Fed obviously knew reflected a less than rosy assessment of the economy, were released.

    I’ve marked it in case it’s not obvious.  Note that it didn’t stop until ES had made a new all-time high (by 1.5 points at 2:15.)Now, here’s what happened to VIX as the market opened and the day progressed.  The breakdown of a falling red channel and the 10-day moving average are pretty common and effective algo signals. I’ve marked the release of the Fed minutes with a yellow arrow. As fate would have it

    Sure, there’s too much liquidity in the markets thanks to central banks’ obvious agenda to prop up stocks. But, the cash on the sidelines we always hear so much about didn’t suddenly materialize yesterday at 9:30.

    Let’s be honest about what’s really moving markets like this: the systematic and deliberate crushing of volatility which, in turn, signals the machines to buy anything that isn’t nailed down. It happens over and over – and especially when the market’s protectors fear a potential downturn.

    As I wrote yesterday…

    Either this is the start of a chart-busting rally, or things are about to get very ugly right as ES’ 50-day SMA has reached its Dec 21 lows.


    continued for members(more…)

  • Update on Bitcoin: Jan 4, 2021

    BTC reached our next upside target at 29,890-30,108 [see: Dec 22 Update on BTC.]  Had it remained in either the rising pink or purple channel, it might have taken quite some time. But, as we discussed last month, it broke out of both channels and topped the Fib target at almost exactly the time forecast by our cycle model.

    continued for members(more…)

  • Collateral Damage

    Maybe Warren Buffett can get through to Congress. In a CNBC interview aired this morning:

    “It’s so important that small businesses, which have become collateral damage in a war that our country needed to fight, but we, in effect, voluntarily had an induced shut down of parts of the economy, and it hit many types of small businesses very, very hard… We made some provision for that in March in terms of the CARES Act, but then nobody really knew how long this self-inflicted recession would last with this particular effect on small businesses, so we need another injection to complete the job.”

    Congress, the Treasury and the Fed have done a terrific job of “saving” corporations that already had access to plenty of cheap capital and whose stock prices could then vouch for the strong recovery from the pandemic.  The rest of the economy?  Not so much.

    For all the independent restaurants, mom and pop stores, non-big box retailers, things are dismal. And, to all the unemployed folks barely hanging on to their house or their apartment, it will get much worse if Congress doesn’t act in the next few days to prevent them from being evicted during the depths of winter in the midst of a pandemic.

    Naturally, futures are up 25 points.According to VIX, it probably won’t last.

    continued for members(more…)

  • The Yield Curve Model: Dec 8, 2020

    One of my favorite market indicators is our yield curve model. It has warned us several times in advance of significant correctionsthis year.

    Warnings over the past few years have included:

    July 16, 2018: The Yield Curve Update – We were a little early. SPX closed at 2798 that day, rose to 2940 before crashing 20% by Dec 26.  The final 13% was signaled on Dec 5: The Yield Curve’s Warning.]

    April 25, 2019: The Yield Curve Model Warns Again – SPX gained 21 points over the next four sessions before quickly shedding 226 points.

    February 20, 2020: Buckle Up – SPX (which had topped out the day before) crashed by over 35% over the next month.

    August 25, 2020: Update on AAPL – We were about a week early, but the model signaled a correction which saw SPX fall 11%, followed by another 9% the next month.

    The recent breakout of the 2s10s is clearly a bearish signal – though it hasn’t yet paid off.  Is the model still working?  First, a little history. Among other things, the model holds that breakouts above significant resistance are bearish for equities.

    If we plot the 2Y and 10Y together, we can see that significant sell-offs in stocks were marked by more rapid declines in 2Y yields than in 10Y yields (i.e., a widening of the spread between the two.)

    The shaded areas below illustrate the period during which stocks experienced their most significant corrections between 2000-2013. Though the 2Y and 10Y both declined during these periods, the 2Y yields clearly fell faster.

    But, as we saw in 2015-2016 and again in late 2019, not all corrections involved a steepening. These selloffs occurred without the yield curve model signal being triggered. Did the model stop working?  Hardly. The decline earlier this year was a stark reminder of its predictive power.  What made these corrections different?  More importantly, what is the model signaling now, and how likely is it to play out?

    continued for members(more…)

  • Update on Bitcoin: Nov 17, 2020

    Almost 8 months ago I posted our first outlook on BTC [see: FOMC Embraces MMT.]   We noted at the time that the FOMC was “officially in the short-squeeze business” after ES came within 19 points (trading was halted there) of our 2155 target and the Dow was set to test the Nov 8, 2016 (election day) lows.

    This was the perfect time to assess what unleashing massive amounts of liquidity might do to crypto.  We noted at the time that BTC should bounce from its triangle bottom (on the arithmetic chart) and return to test the top trend line at around 9,925. We also noted that BTC had rebounded back above a TL on its log chart – an encouraging sign that supported the fundamental outlook. We left off with the note:

    If you believe that BTC will necessarily rise (as gold will) as QE explodes, the charts support a continuing bounce. If you believe the FOMC will do whatever it takes to support the USD and crush surrogates such as BTC and GC, then keep an eye on that TL (5,000ish) as a fairly clear stop level.

    As it turned out, BTC did return to the triangle top where, as we noted in our May 28 Update on Bitcoin that it had an important decision to make. Having reached 10,074, it had held an important trend line on its arith chart…

    …but had failed to break out above a fan line on its log chart.Our outlook at this point was that price action should determine the next move.

    Is BTC a buy here on a potential breakout? Maybe. But, given the fact that it’s barely off its April highs, cautious types might want to wait for an actual breakout. If it occurs, there would be a small opportunity loss from not getting in here.  But better to give up a few percent than lock in a trade with a lot more downside.

    The alternative for more nimble types: go long but watch that rising TL from Mar 16 on the arith chart like a hawk. If BTC drops below it, run for the hills.

    It took over three weeks, but BTC eventually broke out and, in the process, completed an IH&S pattern we’ve been watching and, just this morning, tagged the pattern’s 17,150 target well ahead of our target date in mid-December.After exploding 2.65X since Mar 23, what’s next?

    continued for members(more…)

  • CPI: MIA

    Futures remained slightly lower following lower than expected initial claims (709K vs 740K consensus) and CPI – which came in at 1.2% annual and 0.0% for October.  Note that it took a plug number outlier +1.2% pop in electricity to keep CPI from going negative.

    One would think if the economy were really all that healthy, especially with the flood of liquidity still being thrown at it, we’d see at least some inflation.  But, hey, we got the 10/20 crosses we were expecting in ES, SPX and VIX. So, the rally is safe…right?

    continued for members(more…)

  • The Latest Cringeworthy Rally

    Sometimes I cringe when I place a target on a chart. Such was the case yesterday when ES reached our IH&S target at 3425. If it kept going, it was sure to backtest the intersection of the broken rising white channel at the falling channel top. Was that likely in the midst of election and pandemic turmoil?

    Apparently so, because that’s exactly where ES ended up overnight.Although I tire of saying it, this is an important threshhold for the overall market – which has benefited smartly from a rescue maneuver that wasn’t even really necessary.

    continued for members(more…)

  • Election Aftermath

    Futures were all over the map last night, with ES’ 113-pt range dictated almost entirely by factors as opposed to election results – which, contrary to Trump’s declaration, are still AWOL. Note that ES tagged our IH&S neckline (also the former H&S neckline) target where it is currently running out of gas.

    As expected, the most important factor was VIX which collapsed over 18% from its overnight highs – slicing through channel midline and the 10, 200 and 20-day moving averages.

    continued for members(more…)

  • GDP Beats, But…

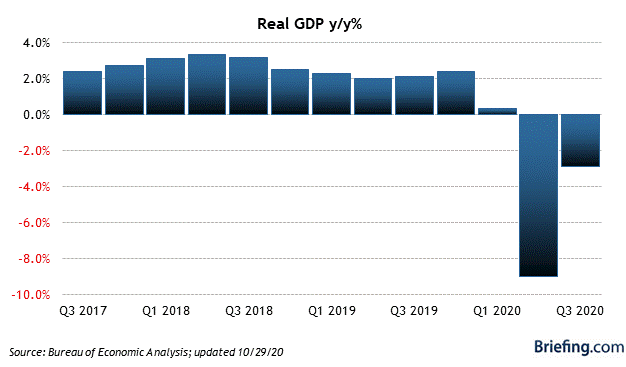
    After the government “put $5 trillion into a $3 trillion hole,” as Ares Management’s Michael Arougheti so eloquently put it, GDP bounced back sharply last quarter. Unfortunately, it’s still down 2.9% for the year.Keep in mind that this is also the advance read for the third quarter, days before an important presidential election, and that all indications are that the pandemic which powered the initial plunge is gathering steam.

    ES is undecided on the import of the data, giving up a nice overnight bounce after slightly overshooting our next downside target yesterday.

    continued for members(more…)

  • Rally Faces Another Test

    Futures have given up all of Friday’s rebound gains and then some, again testing the IH&S neckline and the bottom of the rising white channel from last March.

    At the risk of sounding dramatic, a failure of the channel would mark the end of the current rally and usher in the correction suggested by our yield curve model as detailed on Oct 12 [see: A Cure?] and reiterated this past Friday [Yield Curve Model: Correction Imminent.]

    Stay tuned…

    continued for members(more…)