Tag: SPX

  • New H&S Pattern

    Nothing to do with markets per se, but this kind of story really makes you stop and think…  Anyone who thinks the same couldn’t be done just as easily with a FAB-250 from a Skyhawk is deluding themselves.


    UPDATE:  3:40 PM

    The H&S neckline back test we discussed in the 2:20 post below is likely complete.

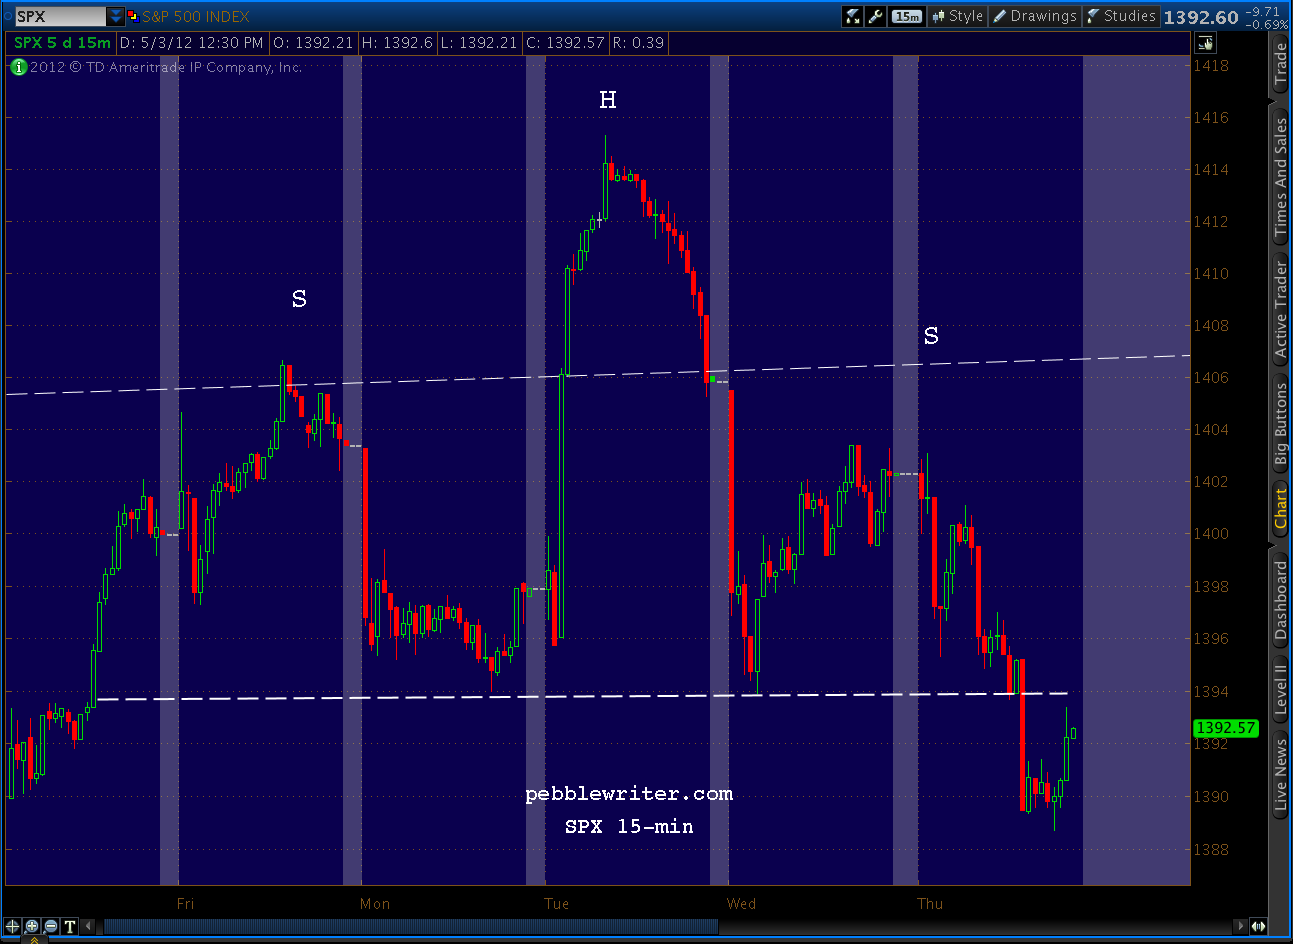
    Note that the head of this little H&S pattern came at the 1.618 extension of last week’s 1392-1358 decline — in other words, a Crab pattern (drawn in yellow.)  And, it’s nestled in the C and D legs of the Bat pattern that completed at 1415 (the purple pattern.)

    After weeks/months of normally reliable patterns busting left and right, it’s so nice (not to mention profitable) to see patterns play out the way they should.

    UPDATE:  2:20 PM

    SPX traded through the small neckline and seems quite content to pause at the small fan line I posted about this morning.  It’s line k-4 on the chart below, and just so happens to correspond to the SMA 10 on the daily chart (1390.81.)

    In H&S patterns, neckline breaks are often followed by a back tests.  If the NFP print in the morning is lousy, we should head down to 1372 pretty quickly.  If the numbers are great (or the market perceives them as guaranteeing another round of QE), the pattern will bust.

    UPDATE:  1:15 PM

    Be cautious with this smaller pattern, though.  The 60-min chart shows a distinct possibility of a bounce at the neckline (as happened with the larger pattern.) Focus on the bold, yellow TL on the RSI below.  I would suggest anyone considering piling on shorts protect themselves, as always, with tight stops.

    UPDATE:  12:30 PM

    Over on the right shoulder of the Head & Shoulders pattern we’ve been watching is a… H&S pattern.  It would complete somewhere just below 1394 and targets 1372 — the (wait for it…) neckline of the larger pattern.

    Ever get the feeling the market is just toying with you?  Seriously, though, this fits rather well with the RSI indicators, which as I posted earlier, support the idea of another test of the neckline.

    If we get crazy positive non-farm payroll numbers in the morning, all bets are off.  Barrons is reporting consensus estimates of 165,000 (below), while Briefing.com estimates 140K.


  • Charts I’m Watching: May 3, 2012

    NOTE:  New on the MEMBERSHIP>MY PROFILE page, a sign up area that will allow subscribers to be texted whenever a new post is added or added to [note:  additions don’t seem to be generating additional texts — working on this].   I tested it last night, and it took only 3-4 minutes for a SMS text advising me of a new post to appear on my mobile.  It doesn’t appear to handle non-US cell providers, so I’m looking for additional vendors that can accommodate those outside the states.


    UPDATE:  1:15 PM

    Be cautious with this smaller pattern, though.  The 60-min chart shows a distinct possibility of a bounce at the neckline (as happened with the larger pattern.) Focus on the bold, yellow TL on the RSI below.  I would suggest anyone considering piling on shorts protect themselves, as always, with tight stops.

    UPDATE:  12:30 PM

    Over on the right shoulder of the Head & Shoulders pattern we’ve been watching is a… H&S pattern.  It would complete somewhere just below 1394 and targets 1372 — the (wait for it…) neckline of the larger pattern.

    Ever get the feeling the market is just toying with you?  Seriously, though, this fits rather well with the RSI indicators, which as I posted earlier, support the idea of another test of the neckline.

    If we get crazy positive non-farm payroll numbers in the morning, all bets are off.  Barrons is reporting consensus estimates of 165,000 (below), while Briefing.com estimates 140K.


    UPDATE:  12:30 PM

    Non-manufacturing ISM numbers confirm the economy’s slowdown.  Recall that the recent national numbers for manufacturers inexplicably showed an improvement — in stark contrast to the regional numbers and most other economic indicators I watch.

    The services sector (the larger share of the US economy) confirms what I suspect was a bad print a couple days ago.  We see worsening in the overall index (from 56 to 53.5 and vs expectations of 56.5) and in the categories of business activity, new orders, employment and prices (the largest drop of all.)


    ORIGINAL POST:  11:00 AM EST

    The RSI channel we analyzed (in excruciating detail) yesterday is holding so far.

    If we can break that last little fan line (k-4) things should accelerate a little to the downside, probably to test the k-5 line, which I believe will correlate with the H&S pattern neckline.

    It seems like the market is waiting for a sign of some sort for any serious downside to develop — which will likely come from Europe, China or MENA.  Why?  If good economic news drives the market up, and bad economic news increases (even falsely) the odds of QE, then it stands to reason that only an exogenous shock — one over which the Fed has less control — will drive prices lower.

    Having said that, the entire economic picture has the feel of a triangle pattern.  We careen from good news to bad, euphoria to despair — all the while drawing closer to the (IMO) inevitable day of reckoning where the mountain of debt shakes just enough to unleash a major landslide.

    We see a preview of the effects in places like Greece, Ireland, Portugal and increasingly Spain.  Total debt to GDP is much too high in these countries, but the US tops them all.  Official reports put acknowledged debt/GDP in the US at 101.5%.  But, as this Zerohedge article points out, the contingent liabilities such as the NPV of unfunded pension and health care drive our true debt/GDP to well over 300%.

  • To Scalp or to Swing?

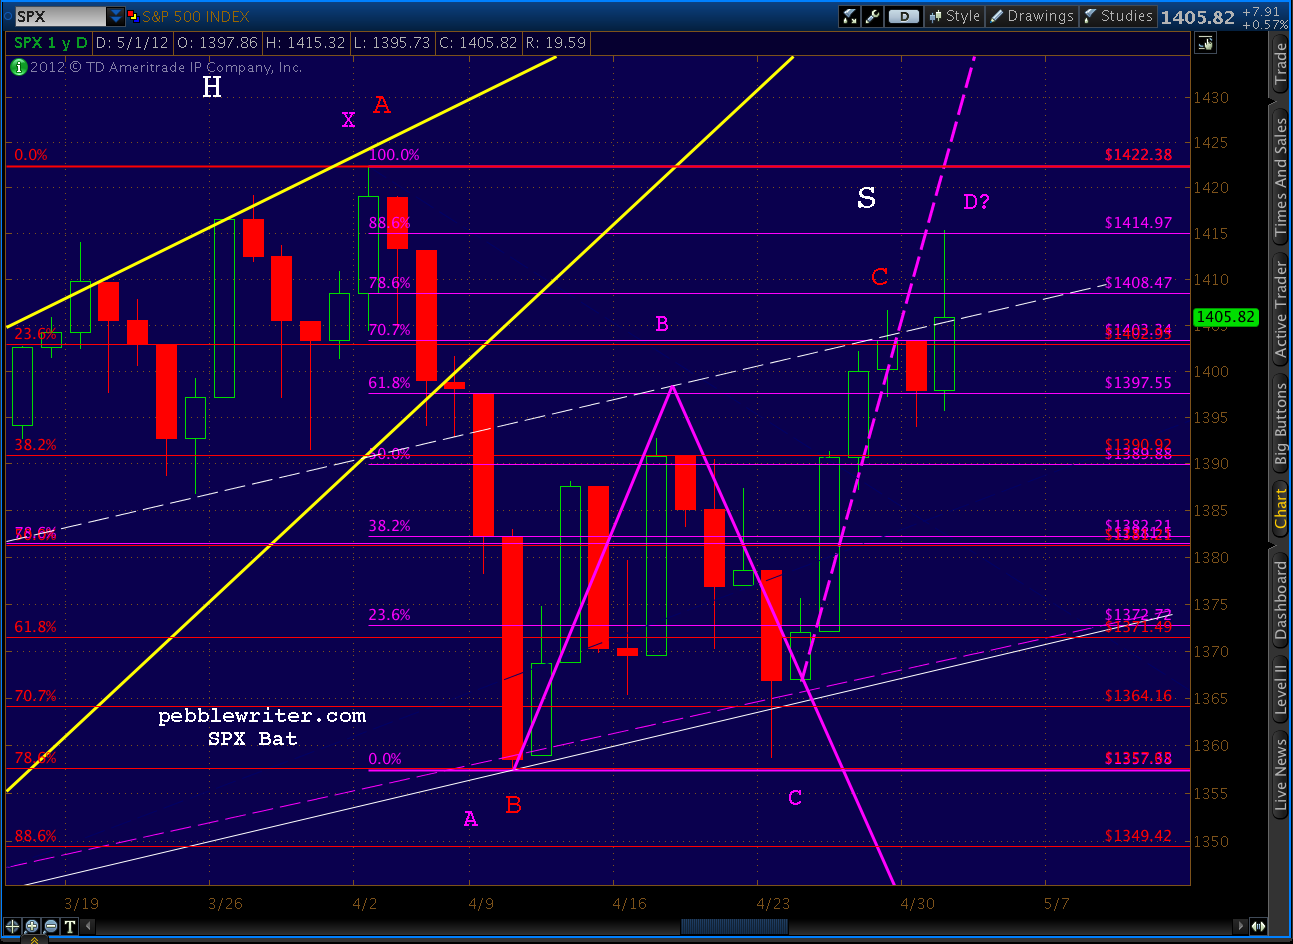
    Yesterday’s Bat pattern reversal we expected has confirmed this morning.  SPX, currently down 7.42, was off as much as 11.90 just after the opening.

    Bat patterns complete following a .886 Fibonacci retracement of a significant move — in this case, the 1422 to 1357 drop from April 2 to April 10.  88.6% of that drop was 1414.97, and we exceeded it just slightly before the market reversed course (at 1415.32.)

    Cash short positions established at 1415 were up almost 1% this morning.  At-the-money puts bought when SPX hit 1415 were up at least 100%.    If you bought a few, congratulations!  Your pebblewriter membership just paid for itself.

    The tricky thing with harmonic patterns is how much of a reversal to expect.  Some harmonics traders, therefore, practice scalping — establishing a position just before the expected reversal (with appropriate stops) and taking a profit shortly after.  This can be very profitable and, if done properly, entails little risk.

    The other method is to use these reversals to establish longer-term swing or momentum trade positions.  This method works well if there is a reason to believe the position has more room to run; i.e., other chart patterns or technical analysis hint at a continuation of the new trend.

    If you’ll indulge me, I’ll walk us through my thought process.  It doesn’t always work, but it provides a useful framework for the scalp/swing decision.

    In this case, the dominant chart pattern is the H&S pattern that completed but didn’t play out back on April 23.  We would expect a busted H&S pattern to go up and take out the head — 1422.  But, this pattern has continued to loiter, and now reverse, at the shoulder line already established.

    For that reason, it’s quite possible we’re establishing a complex H&S pattern, which simply means there are more than one shoulder on each side.  There are two shoulders on the left, although they’re not perfectly formed.  But, good enough?  Probably.

    We can’t put a number on it, but I did observe the other day that the pattern would be balanced time-wise by today.  While not an absolute requirement, balanced right and left shoulders contribute to a more reliable pattern IMO.  In other words, if the pattern is going to play out, it had better get on with it.  A substantial delay increases the odds that the alternate path to 1462 plays out — without a trip to the low 1300s.

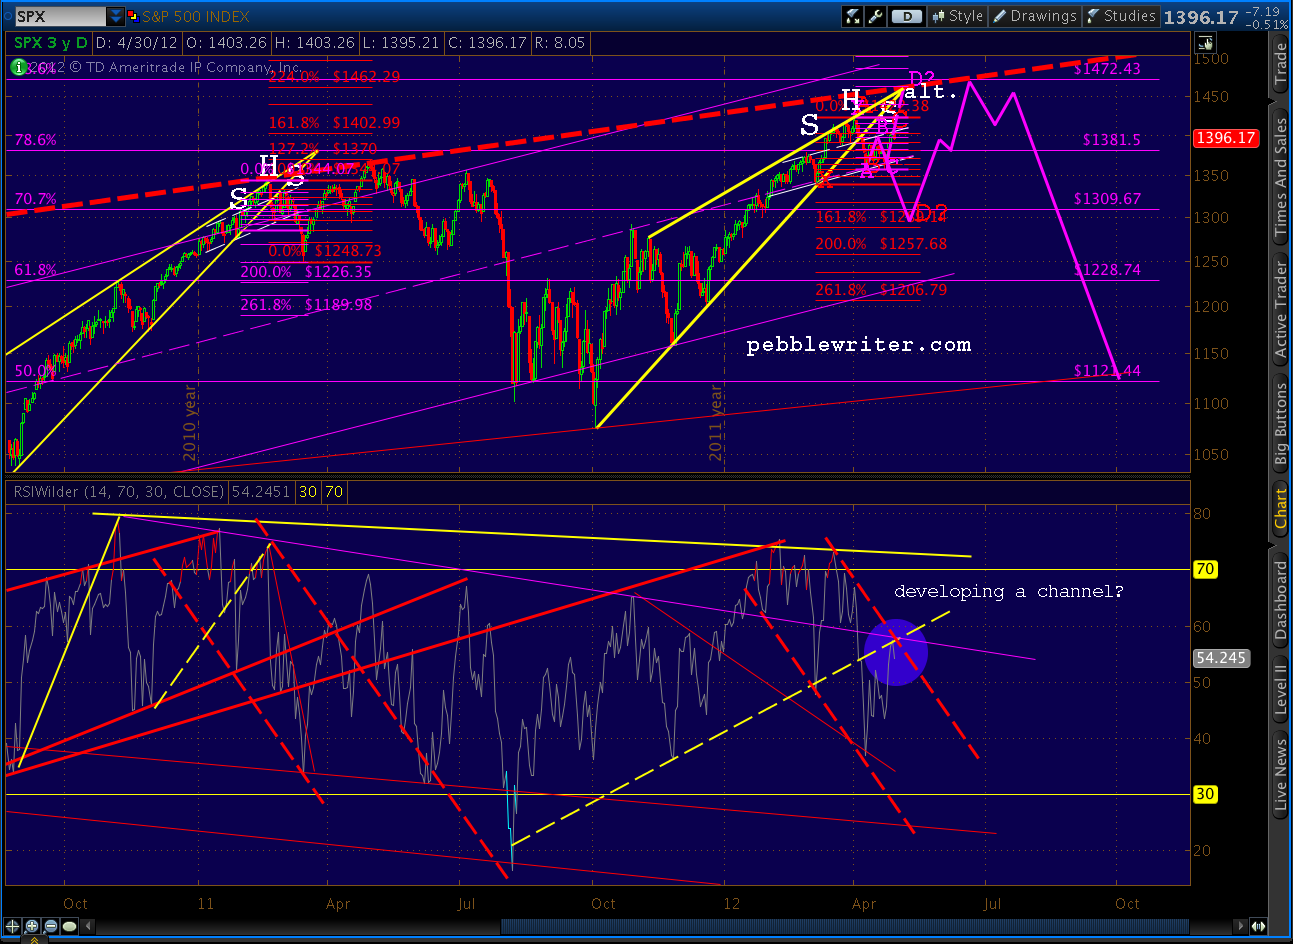
    The other chart pattern I’ve written about a lot these past few days is the RSI channel.  Along with the Bat pattern, it correctly forecast yesterday’s turn as a back test of the major trend line (yellow, dashed) running through the middle of the chart.  Note that it can be viewed as a system of fan lines originating from August 8 when SPX had nearly completed its initial 246-point plunge [see: Analog.]  We’ll label this point “a.”

    Point “a” was just a point until the Oct 4 1074 bounce.  With the addition of a “b”, we had a trend line/fan line.  The bounce at “c” more or less confirmed it.  Shortly after, we broke the fan line and fell to “d.”

    Line a-d now becomes a new fan line, though SPX would go back up and back test line a-b starting at point “e” and continuing for months — until point “g” in February.  Along, the way, a new line was established at “f” — which correlated with the 20-point Dec 19 plunge.

    Point “f” established both a new channel (line d-j) and would also serve as the origination point for new fan line f-g that, together with a-g, would form a rising wedge within RSI.  The break and back test (at the apex) of that rising wedge would mark the topping out of RSI, and thus the beginning of the serious divergence that would begin to drag on the bull run.

    Note that the 1422 high didn’t occur when RSI peaked at “g” or even later at “j.”  It came at “1” — 4 little peaks later.  Of course, “j” wasn’t just another little peak.  It was a back test of the channel created by d-j and followed a major dip to “i” that correlated with a 23-point drop on Mar 6 — further defining the SPX rising wedge.

    Point “i” also helped establish the downward-sloping channel (red, dashed) on which I’ve been so focused lately.  The dashed fan line from “i” to “1” (the SPX high) provided a clue as to the drop to come — since “1” was established during a back test of that line.  When fan line i-2 was broken, it was followed by a 65-point drop in SPX.  And, the corresponding “k” in RSI helped validate the current channel.

    Note that i-3 is a third fan line and is simply a segment of the major a-i fan line.  Its back test is what we’re trying to complete right now.  Will it be a short, sweet back test like point “j”, or a long, drawn-out affair like the period from “e” to “g”?

    All channels work forever…until they don’t.  So, there’s no guarantee that this one will contain SPX’s moves going forward.  The key points I’ll be watching are the fan line k-4, which was established by the Apr 23 neckline tag (and H&S completion.)  A break of this fan line would really help the bearish case — while a RSI move up through “3” would be bullish, establishing k-4 as the lower bound of a new upward sloping channel.  In fact, a break up and out of the channel at any point would be bullish.

    If we do break beneath k-4, the next major fan line is a-k.  Both prior major fan lines got two bounces before they gave way — a common occurrence, so it’s entirely possible this one will, too — especially if it’s still within the channel.

    So, which is it?  Will the new channel hold, or will the alternate case play out?   The bulls have their work cut out for them, as an upward move to the apex means not only breaking out of the channel, but through the solid, purple trend line that dates back to November of 2010.  This same TL (or its lower parallel) figured into the reversals on Feb 18, May 2, July 7 and Oct 27 in 2011 — some pretty good company.

    The break above it from Jan 9 to April 4 2012 ushered in the 1280 to 1422 melt up.  We broke below it on April 4 — the SPX high — and have back tested it twice in the past week (the highlighted area.)  All things being equal, I suspect it would be much easier to break out of the red, dashed channel than above this TL.

    If I haven’t put you to sleep yet…

    Therein lies the reason I’m still clinging to the analog as my top scenario and the alternate case as just an alternate.  I think the bullish case is stretched very thin, meaning SPX needs to pull back and gather momentum if it’s going to take a run at 1462-1472.

    At these levels, it would have to bull its way through that purple TL in an already extended state.   The much easier way of achieving a higher high would be to go down and bounce off line a-k — corresponding to the low 1300s in SPX — and zip back up to the purple trend line.

    A new high on SPX at the century mid-line around 1462-1472, combined with a lower high on RSI would establish another significant divergence that just might unravel the bull run in a much bigger way.  More on that later.

    Conclusion:

    We started off with the question of whether to scalp or swing.  It’s largely a matter of wits and nerves.   The market is consolidating now, trapped in the channel created by the shoulder line and neck line of a H&S pattern — which is the perfect environment for day trading and/or scalping.

    But, one of these days, it’ll break out.  If it’s to the upside, that’s 60-70 points of swing trading that could be very profitable.  If the downside, I expect a swift 80-100 points.  When it does, swing traders will be very happy campers.  Scalpers will be kicking themselves for settling for a lousy 100% return.

    Either way, these are the charts we’ll be watching.  It should be exciting!

    ********************

    BTW, there are still about 12 hours left until the introductory pricing on pebblewriter.com runs its course.  Current Followers get $100 off the price of an annual membership.  And the first 100 annual members, regardless of whether they’re a Follower or not, will have their current annual subscription price grandfathered for the life of the site.

    For full details, click here.

    ********************

    P.S.  I promise not every post will be this dense.  Some of you want to know what time it is, not how a watch works.  But, there are plenty of guys out there who, for a small fee, will tell you whether the market’s going up or down.   My goal is to teach you why and, together, to discover new ways to make sense of it all.

    Good luck to all.



  • A Swing and a Hit!

    We didn’t have to wait long for the Bat pattern I posted at 11am to play out.

    The .886 target was 1414.97, and we reversed at 1415.32 at 11:50am — closing just a fraction above the subsequent low for the day of 1405.25.

    I was disappointed to be stopped out of my short position early this morning, but more than made up for it by establishing new shorts at 1415.  I enjoy 60% intra-day profits as much as the next guy, but what’s really cool about the way the day closed is the effect on the RSI channel.

    I posted yesterday about the RSI channel that was setting up on SPX.  I added another post late last night (early this morning?) showing essentially the same pattern on all the other indices I watch.  It strongly suggests that the rise since 1357 is nothing more than a back test.  Here’s the view at yesterday’s close.

    This morning’s elevator ride sent RSI right through that dashed, red line — making the channel look about as valid as a $3 bill.  In fact, RSI spent most of the session ignoring my channel line. But thanks to the Bat pattern reversal, at the end of the day (literally) the channel held.

    And — wouldn’t you know it — SPX closed right at the shoulder line (white, dashed line) where it can torment us with uncertainty for another day.

    For a peek at the other indices and their channels, check out New Charts! posted last night.  Also, each index has its own page under the MARKETS menu, and will be updated at least weekly.  SPX, DX and VIX are typically updated intra-day on the main page, depending on market conditions.

    ************************

    While you’re poking around, consider signing up.   Current pebblewriter followers who join by midnight tomorrow are entitled to $100 off an annual membership.  Also, the first 100 annual members who sign up by tomorrow will have their membership rate grandfathered for the life of the site.  No increases, ever — which will be pretty cool when it costs $500 just to fill up your Suburban.

    Over the next day or two, this website will be password protected, so those of you who have already subscribed (thanks!) will enjoy first dibs on the latest and greatest.  If you haven’t subscribed yet, might as well do it now and save yourself $100.  If you bought a dozen at-the-money puts at 1415 today, you’re already up more than the cost of an annual membership.

    Good luck to all.

  • New Charts!

    Lots of updates posted here tonight:  SPX, DJI, VIX, COMP, NYA, NDX, DX and EURUSD.   Summary charts here, or check the index tabs under the MARKET tab in the MENU.  I’ll have the rest of the indices and the metals posted later today.

    Each of these will typically be updated at least weekly, while I usually rely on SPX, VIX and DX to tell the day-to-day and intra-day story.

    In general, I’m seeing an almost identical pattern setting up in each of these RSI charts — and it’s bearish.  Unless this is a masterful fakeout, the next move should be down — possibly the result of PMI manufacturing or construction spending data due out at 10:00AM EST.

    Good luck to all.

  • Going Out on a Limb

    In spite of the indecision demonstrated in this morning’s post, I’m seeing a channel set up on the RSI that’s tilting me slightly more bearish.  It’s the dashed, red channel on the chart below.

    Remember, everything that’s happened since April 4 is technically a back test of a broken rising wedge — unless we break above 1422.  It’s possibly a replay of the events of Feb-May 2011 [see: Analog Details.]   This back test correlates with a back test of the dashed, yellow TL on RSI (redrawn this morning.)

    Viewed through this prism, the channel makes a lot of sense.  In 2011, a similar channel sent SPX down 45 points or so — but that was after the H&S pattern had played out.  In the current time frame, we had a bounce at the neckline and no follow through since.

    One more thing: the purple trend line intersecting with that RSI channel.  Previous failures to push through it have proven disastrous to SPX.   All things considered, I’m going to layer on more bearish positions — with tight stops.

    The same channel is setting up on NYA and COMP, too.

    Stay tuned.


  • Go Away in May?

    Maybe it should read “be put away in May?”

    It occurred to me over the weekend that Friday’s posts probably sounded a little schizophrenic.   “Next Stop 1462?” does seem a little out of step with “VIX Ready to Rumble.”  Is it me, or is the market perhaps a little schizophrenic?

    This morning’s drop does little to clarify things.  Again, we reversed right at the H&S pattern shoulder line — dropping as low as 1395 on the Chicago PMI survey (off 6 points to 56.2 for the third monthly drop in a row — see details below.)

    Furthermore, the RSI TL we were watching so closely last week appears to be holding.  It broke on Friday, but has snapped back to the point where we can probably ignore Friday’s action.

    As anticipated, VIX did do a little rumbling this morning, up almost 7% to 17.41, currently loitering at 17.30.  These RSI channels have done an amazing job at forecasting VIX over the past couple of months.

    Unfortunately, we’re no closer to resolution of last week’s “analog vs alternative” quandary.  For a long, tedious discussion please re-read the past few posts from last week.  The cliff notes version is: “50:50.”  That is, both options are on the table, and will be until we see some sort of break out. I’m keeping my powder mostly dry until the path forward is more clear.

    I’ll continue to watch the red-dashed RSI TL on SPX above.  I’m also watching the McClellan Oscillator, which is often a good indicator.  Like many other indicators, it’s on the verge of a breakout or breakdown.  Now, if we can only figure out which one…

    The economic data continues to forecast slowing.  But, at what point will the market care?  As we’ve discussed many times — good news is good, and bad news is good (if it stimulates another round of QE.)  It seems the only thing that might quash the QE hopes is an announcement from the Fed that it’s off the table (don’t hold your breath.)

    Stay tuned.

    ******************
    The April PMI survey isn’t pretty.  The production component dropped a huge 11 points — the largest drop in 11 months.  But, the Buying Policy component is particularly telling.  It asks respondents to report how far in advance they must order what they need for their businesses.  It’s a good handle on the tightness in the supply chain.  This month, it fell dramatically — from 45 to 28.  In other words, there’s plenty of capacity — not a good sign for those expecting the economy to heat up.


  • Next Stop 1462? April 27, 2012

    Yesterday we explored the alternate path in detail, noting that one of the two RSI trend lines we’ve been watching had broken, and the second was coming into play.

    There is the possibility that the downward sloping red, dashed TL will catch it on the way up, but the yellow TL just broken was a major feat.  A close above the TL would imply a definite momentum shift.

    This morning, the second (red, dashed) trend line just gave way, lending more credence to the alternate path higher if — and this is key — we can manage to close above it.

    As can be seen on the chart above, there’s very little in the way of resistance between here and 1462.  We’re at the H&S shoulder line now, and it’s possible that the pattern will still play out.  But, as discussed in Bulls Fight Back, the pattern will start looking lopsided with much higher prices or passage of a few more days before it resolves.  It fails definitively at 1422.

    Harmonics give us some ideas as to the path forward and potential turning points.

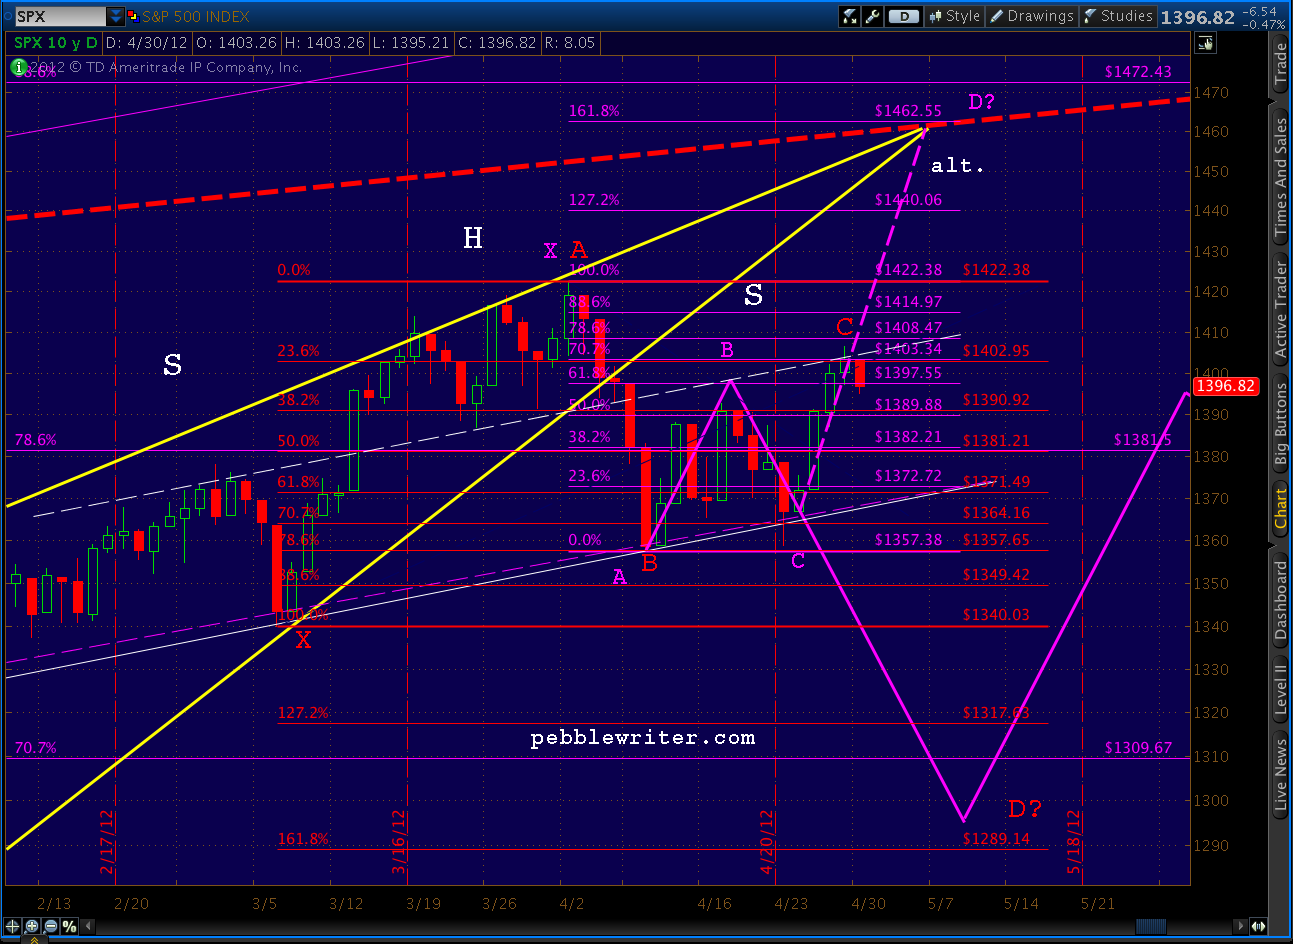
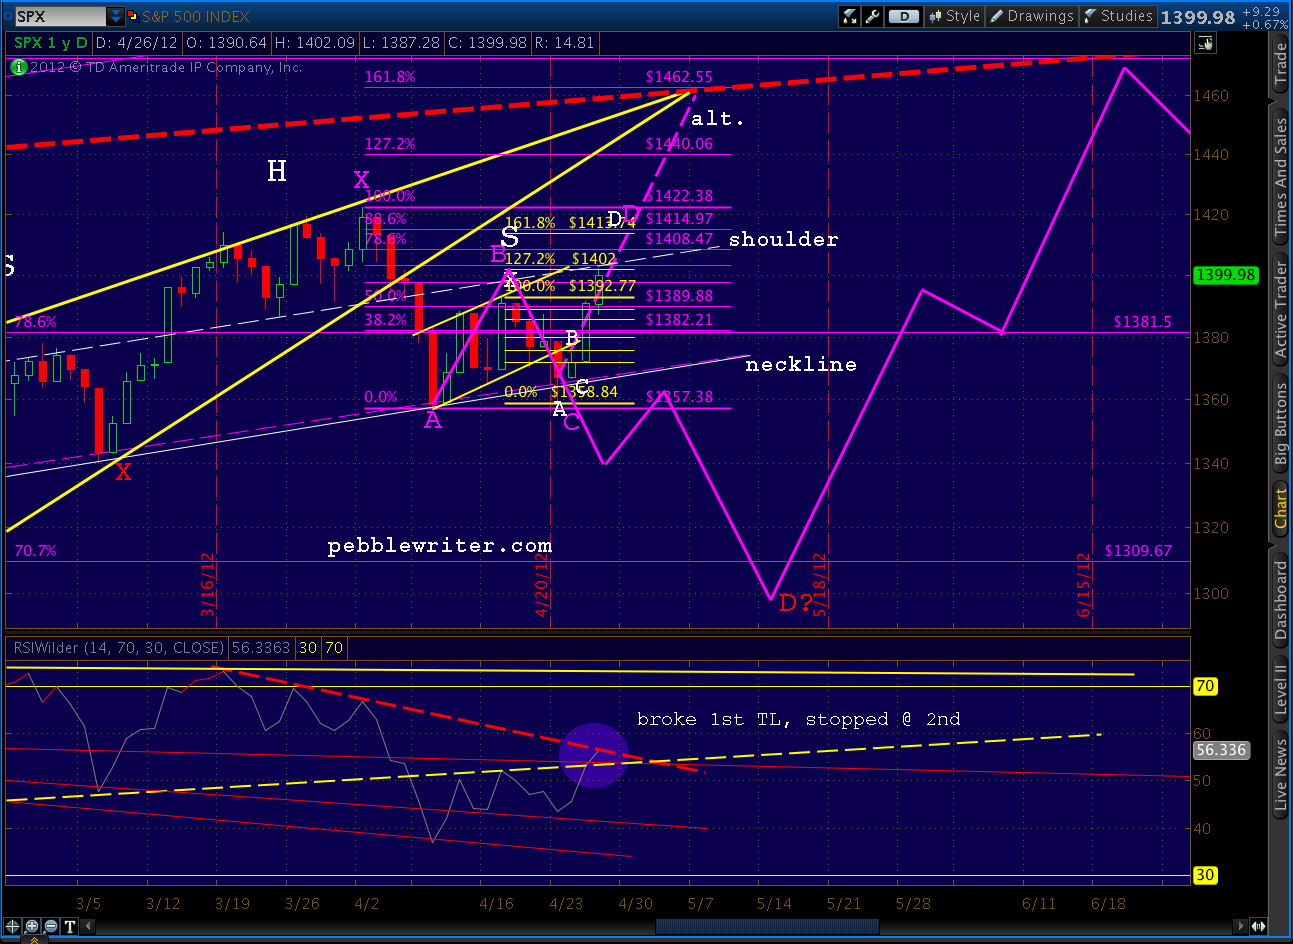
    Here’s the bullish case — a Crab (the larger purple pattern) with the 1.618 At 1462.55.  There’s a good possibility that we’d see a reaction at 1414, which is the .886 of a Bat pattern and the 1.618 extension of the smaller Bat (in red, labeled in white) that’s nestled in the last two legs of the larger purple pattern.

    But the ultimate target is Point D at the 1.618 extension of 1462.  This is the apex of the rising wedge pattern (yellow) we’ve been in since 1074 and intersects with the SPX channel mid line (red, dashed.)

    Yet, there are plenty of reasons for the market to turn down and complete the H&S pattern, including the very faint possibility that reality sets in.  Here’s the bearish case — a Butterfly (in red) — that points to a low of 1305-1317.  BTW,  red Point C can go as high as Point A, but no higher, in order for the pattern to hold.

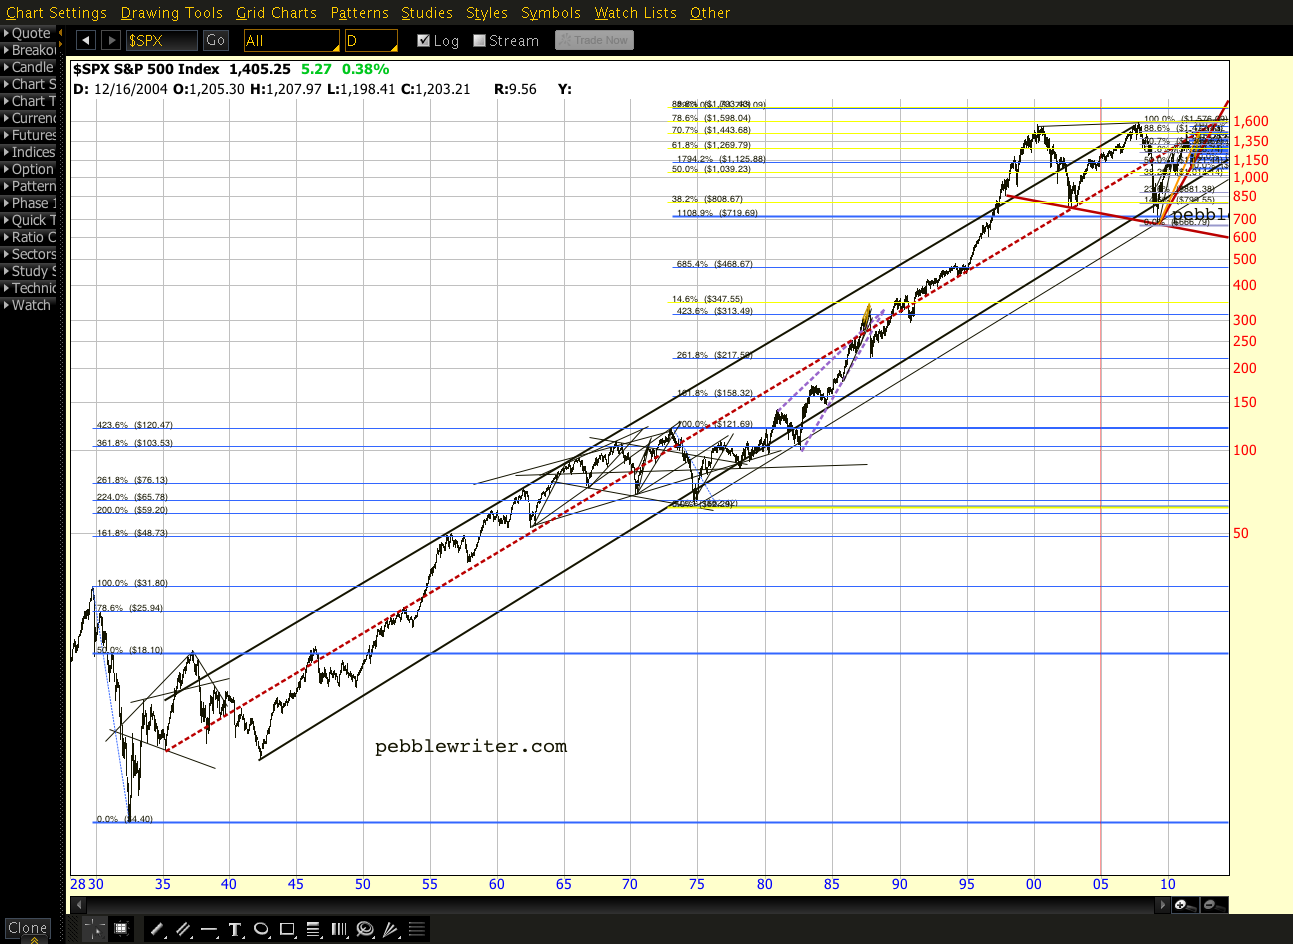
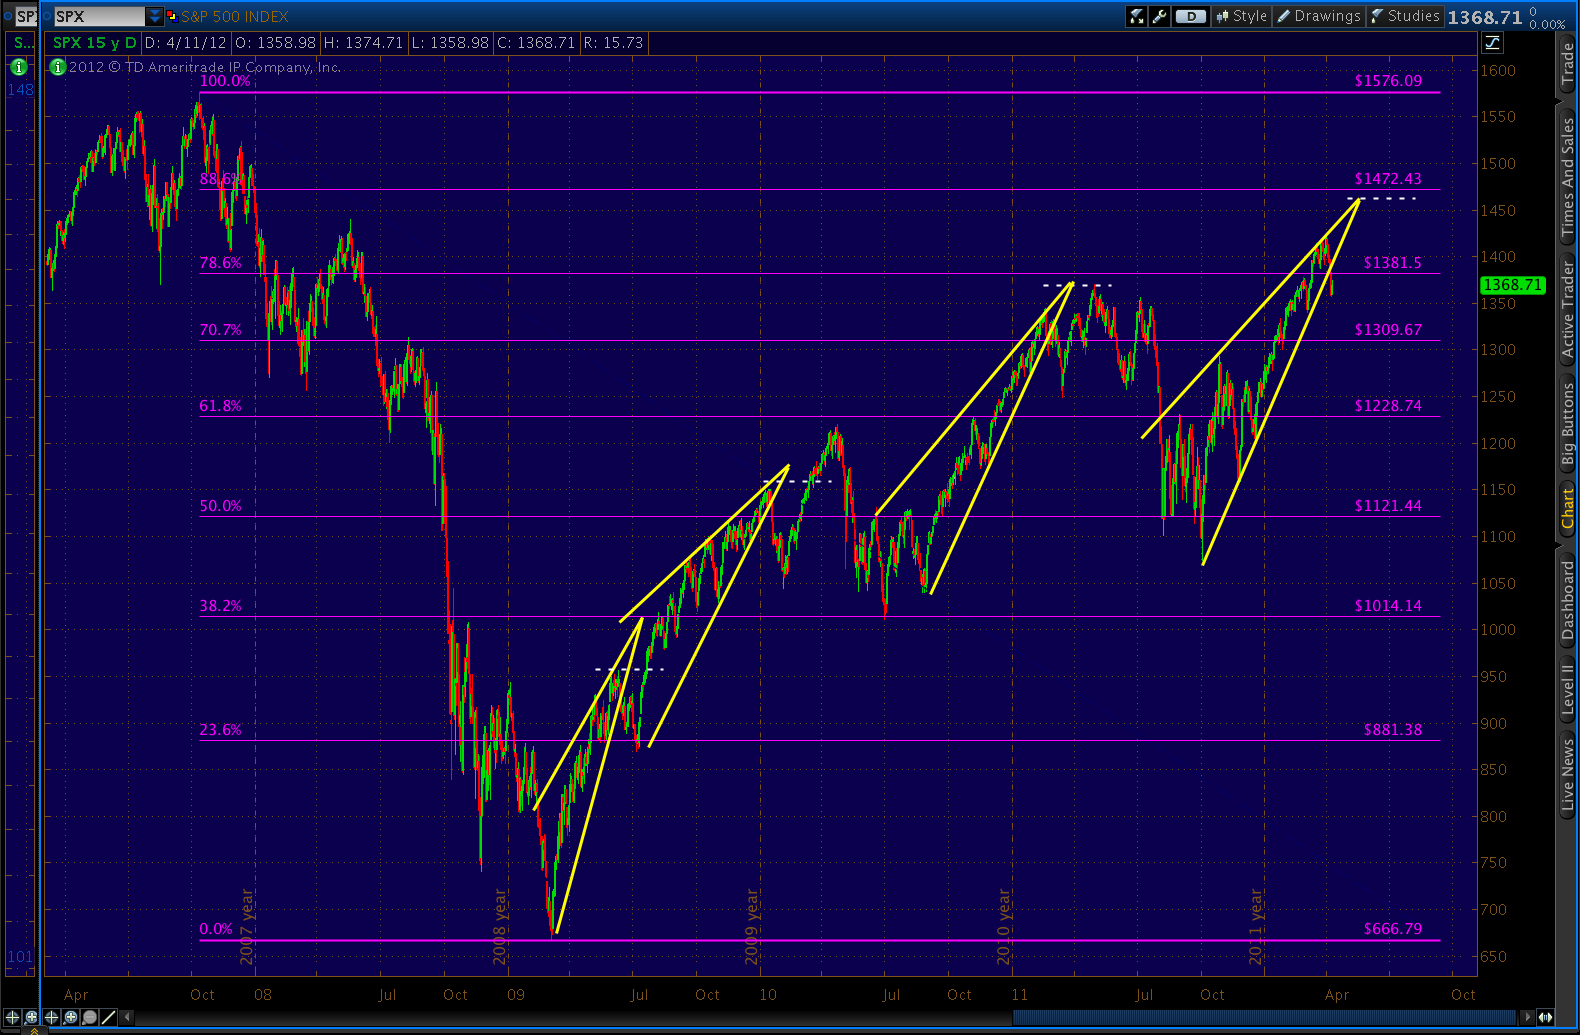
    That red, dashed channel mid line at which either alternative ends is a biggie.  Here’s the view of the past 20 years…

    And, the even more stunning view since 1935…

    There’s the possibility of a slight miscalculation when graphing anything over 77 years.  So, when I say it comes in at 1462, that’s an educated guess based on my best interpretation of what I can see.  But, it’s helpful to know that it corresponds with the Crab patttern 1.618 –and is darned close to the Fibonacci .886 retracement level of the 2007-2009 drop at 1472.

    I believe we’re destined to tag that line again before the next big downturn.  But, whether we get there directly from here or after a more extended wave 4 is not clear to me at the moment.  For now, the momentum is clearly with the bulls, especially when we can rally off of horrid economic numbers.

    Personally, I’m reigned in quite a bit right now — at least until the picture is a little clearer.

    **************

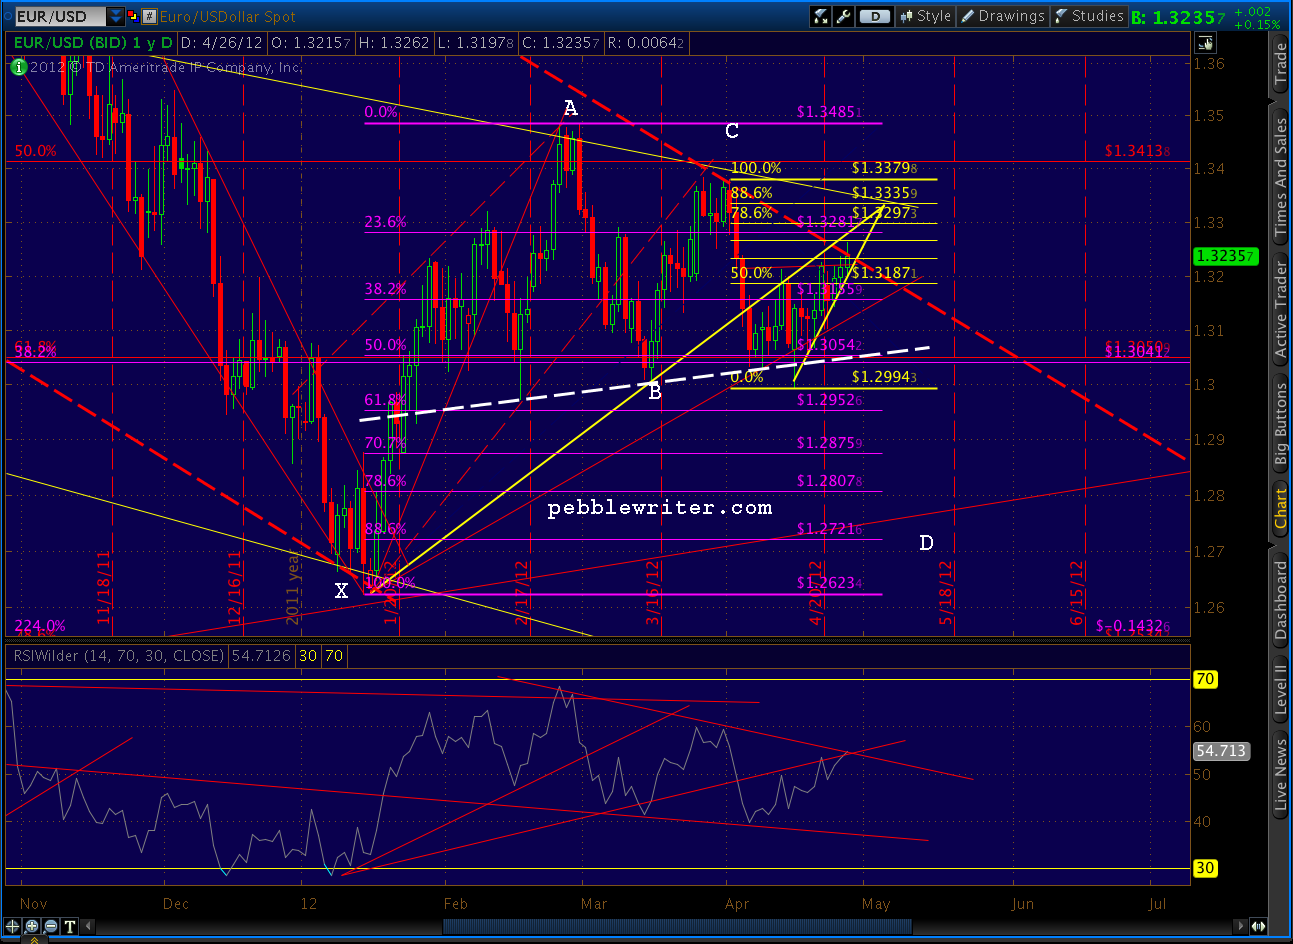
    The EURUSD has also defied logic, gaining slightly on the day to the point where it’s exceeding the channel that’s guided it for over a year.  But, the last month has traced out a Gartley that could see prices reverse around the .786 retracement of 1.3297.  Our high for the day so far is 1.3269.

    Stay tuned.

  • Spain Downgraded: April 26, 2012

    S&P cuts Spain two notches, from A to BBB+, based on contracting economy…cites declining disposable income, private sector deleveraging, front-loaded fiscal consolidation and an uncertain outlook for external demand in many of Spain’s key trading partners.

    This could be the catalyst for the turn we’ve been wondering about.  It could be the difference between the H&S and analog playing out versus our top alternative.  Notice that we did break the RSI trend line identified the other day (yellow, dashed) but were stopped by the 2nd one we discussed earlier today.  Today’s high was right at the shoulder line of the H&S pattern, and retraced a Fibonacci .707 of the recent 1422-1357 decline.

    Keep an eye on the CDS and bond rates for Spain/Portugal/Italy and key regional banks.  Remember, all these rates are available right here, just go to the economics menu and select market data.

  • On the Verge: April 26, 2012

    UPDATE:  5:35 PM

    S&P cuts Spain two notches, from A to BBB+, based on contracting economy…cites declining disposable income, private sector deleveraging, front-loaded fiscal consolidation and an uncertain outlook for external demand in many of Spain’s key trading partners.


    UPDATE:  3:25 PM

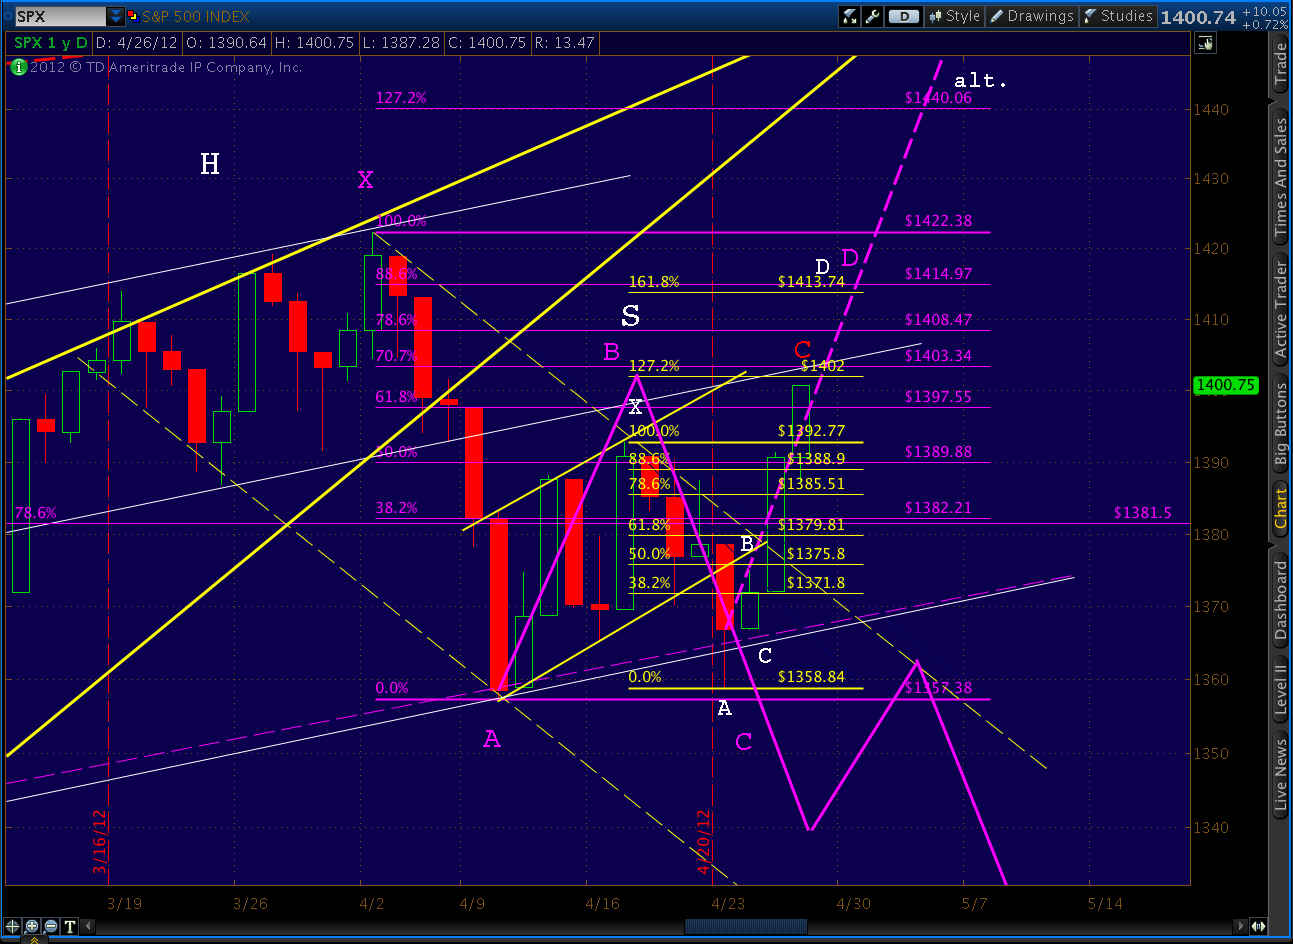
    Here’s a close up of the alternative path, which looks stronger with every uptick.  I haven’t altered its course since first charting it a couple of weeks ago.  Remember, it remains only an alternative until the H&S pattern busts.

    As we originally discussed, the thick, red dashed line is our target.  It’s the center line of a channel that goes back to 1935.  Really.  The rising wedge apex intersects with it at around 1462, which is the 1.618 extension of the purple Crab pattern detialed below (Point X at 1422.38).

    FWIW, it’s also the 3.000 extension of the small Crab pattern (yellow) nestled in the B-C-D legs of the larger Crab.

    UPDATE:  3:15 PM

    Interesting that today’s ramp has come without any help from the euro zone.  EURUSD continues to stall at the channel line discussed in this morning’s update on the euro.

    ORIGINAL POST:  1:45 PM

    Yesterday we examined the fact that SPX had broken a 26-session channel and was in danger of following our alternative forecast higher — the purple dashed line marked “alt.” in the chart below.  Remember, that alternative calls for a strong move to 1462-1472 in short order, while the analog calls for a breakdown first.

    We took a close look at the RSI trend line that, broken back on the 5th when the rising wedge was broken, was being back tested big time.  I mentioned I’d be watching it like a hawk, as I felt it would hold the key to which way this confusion resolves.

    As of right now, that RSI trend line is being broken.  While it’s possible this is an intra-day head fake, I’m not so sure that I’m willing to bet cold, hard cash.  Note the highlighted circle on the RSI portion of the chart below.

    And, expanded here…

    There is the possibility that the downward sloping red, dashed TL will catch it on the way up, but the yellow TL just broken was a major feat.  A close above the TL would imply a definite momentum shift.

    From a bearish perspective, one small Bat pattern that indicated more downside busted when we moved above 1392.  The larger Butterfly (labeled in red) will need its Point C moved over to today’s high, but won’t bust until/unless we exceed 1422 (where C > A.)

    From a bullish perspective, the Bat/Crab pattern marked below in purple correlates very well with the smaller yellow Crab — which, until this morning, was just a Bat.  Remember, Bats terminate at the .886 retracement, and Crabs at the 1.618 extension (or more).

    The small yellow Crab’s 1.618 is 1413.74, while the larger purple Bat’s .886 is 1414.97.  When two targets are in such close proximity, it lends additional credence — all else being equal.    Technically, we could get a move to 1414ish and still have a valid H&S pattern, but as we discussed yesterday, it puts additional strain on the pattern — and the analog — playing out, unless we see a very quick reversal.

    As we approach 1400, the market should at least pause.  It’s the original H&S “idealized” shoulder line, the 1.272 of the small Crab pattern, and a nice round number.  But, unless we reverse in the next hour and see that RSI dip back below the TL, I’m increasingly positive about a move to at least 1414-1415 to fulfill the Crab and Bat.

    Remember, this is still a back test of the rising wedge.  But, I’ve been studying rising wedges a lot lately; and, as we discussed many times [see: In a Fix], it’s not uncommon for a back test to go on up and tag the original apex — faking out all who were playing the broken wedge.

    More later.