Tag: SPX

  • Searching for a Bottom

    UPDATE:  1:45 PM

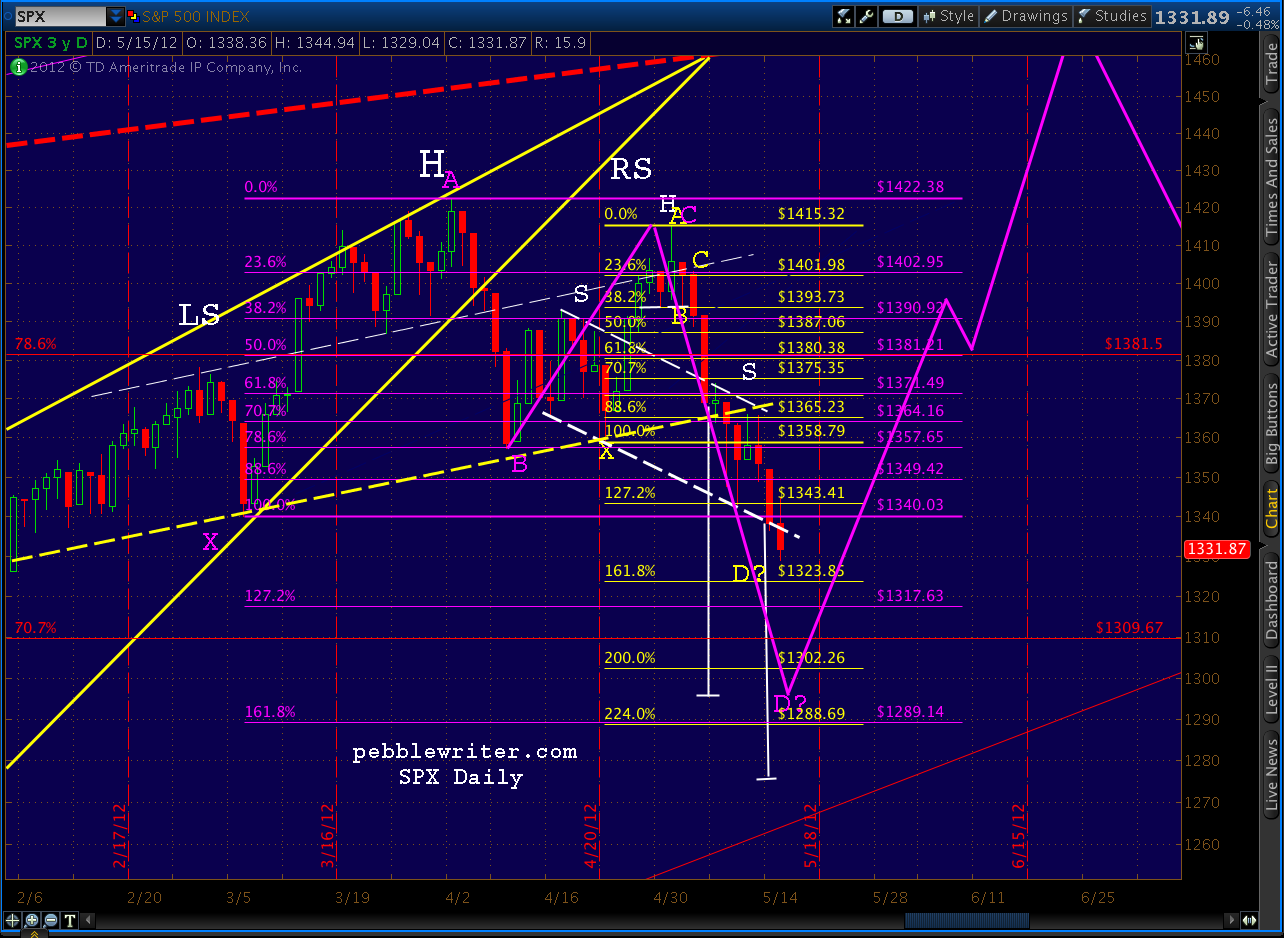
    So far, SPX has obliged us by tagging every one of our targets.  The 1310 Fibonacci .707 retrace [see below] of the 2007-2009 collapse is our current intra-day low, and we’re presently sitting at the 1.272 target of the Butterfly incorporated into the analog I first posted on April 9 [see: New Analog I’m Watching.]

    As I mentioned yesterday, I think there’s a very good chance we get down to 1289-1295 (depending on whether they can defend the very important 1292.)  As oversold as things are getting, I wouldn’t even think about going long except, perhaps, to play a bounce — unless we’re able to break out of the acceleration channel on the 60-min chart.

    It’s the dashed red channel that’s guided prices since 1415 (ignore the solid purple line, that’s just our forecast from April 10.)

    UPDATE:  10:05 AM

    Philly Fed numbers aren’t pretty, with a 5.8% drop versus last month’s 8.5% increase.  Especially troublesome is the 6-month outlook, which has plunged from 33.8 to 15.0.

    A negative 5.8%  is bad enough in and of itself, but it looks especially ugly compared to consensus: +8.8-10.0%.

    The Conference Board Leading Economic Index also missed, showing a 0.1% decline versus expectations of a 0.2% gain.  This is the first drop since last September.

    If it looks like the leading economic indicator line hooked down over the past few months, that’s because it has.  Note the monthly rates of change — trending down from +0.7% in Feb to +0.3% in March and now -0.1% in April (not the sort of behavior you want to see in a recovering economy.)  Here’s the official explanation from the Conference Board:


    ORIGINAL POST:  9:39 AM

    I’m watching the RSI for clues as to which of our targets SPX will settle on.  Remember, the range is 1295-1323, though the number of unfolding events that could overwhelm our forecast is growing.

    The daily chart shows several parallel trend lines that might provide the final stop.  But, of course, lower stock prices often occur on a higher low in RSI — a phenomenon known as positive divergence, and a sign of a potential bottom.
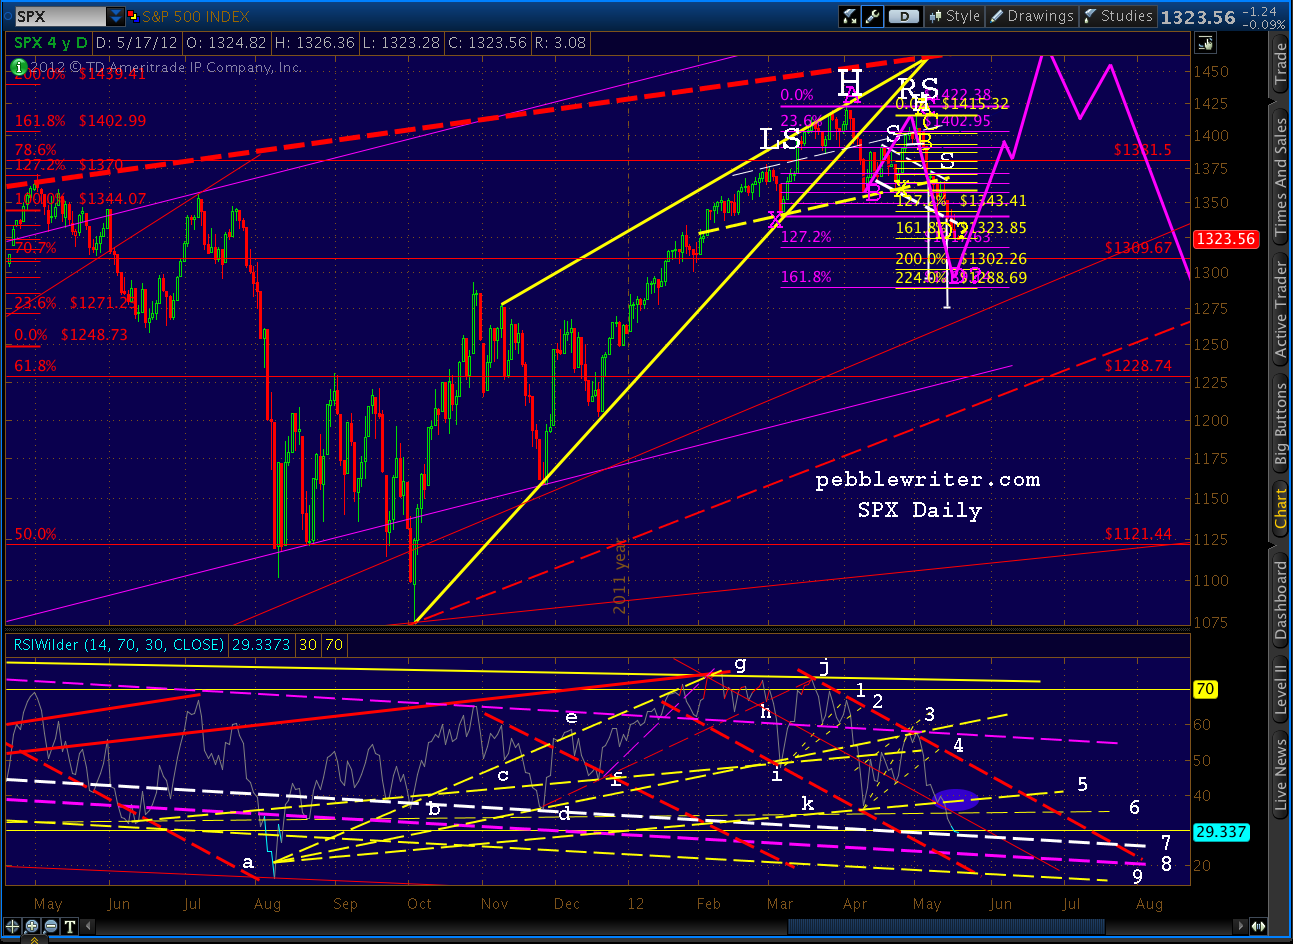
    Here’s a little better detail on RSI:

    The white dashed trend line (7) is next up.  It stopped moderate declines in April, September and November of last year and probably corresponds with our 1317-1323 target.  Remember, 1323 is the small (yellow) Crab Pattern’s 1.618 and 1317 is the larger (purple) Butterfly’s 1.272.

    The purple dashed line (8) is associated with the declines in November of 2010 and a secondary dip in August 2011 and probably corresponds with either 1300 or 1317 on SPX.

    The yellow dashed line (9) stopped the plunges in March and June in 2011, and provided the higher low for the actual August 2011 1101 bottom.  March 2011 is the analogous point in the analog we’re watching.

    Surfing these RSI channel lines is an inexact science, because turns rarely occur exactly in line with previous highs/lows.  There’s a relatively high margin of error, say 5-8%.  So, it’s possible that yesterday’s RSI low could be considered to have tagged the white line.  If we get a strong rally off the Philly Fed survey or Conference Board numbers at 10am, we’ll call it that way.

    There is one other Fib level we haven’t talked about much — the .707 from the 2007-2009 decline is just ahead at 1309.67.   Many investors aren’t even aware of the .707, so it’s often completely left off charts.  But, this is a long-term pattern, so it could easily come into play.

    Last, the 60-min RSI shows a pretty good possibility of a bounce in the 1317 range.  Between 1323 and 1317, 1317 belongs to the larger and more important pattern — the Butterfly.  So, unless the Philly Fed survey is atrocious, we should get some kind of bounce there.

  • Somewhere Out There, Fibonacci’s Having a Good Laugh

    Some of you might remember this post from May 4.  I was struck by the Fibonacci relationships in both time and price between the last two major H&S patterns, and thought it confirmed my view that the H&S top was ready to play out.

    We all know what’s happened since then, of course.

    The reason I bring it up again is that horizontal purple trend line cutting across the chart from the October high (which helped drive prices higher for months.)  I don’t think it’s a coincidence that it’s at the same price as our H&S target — any more than it’s a coincidence that the latest pattern is:

    1.  1.618 the time of the previous pattern; and,
    2.   .618 of the target price range of the previous pattern.

    These Fibonacci relationships don’t tell us exactly what’s going to happen.  But, they’re practically screaming “pay attention! This could be important!”

    The obvious implication is that SPX will find its way down to 1289, the lowest of our targets initially presented over a month ago [see: Analog Details]  — though I continue to believe TPTB won’t allow a dip below 1292  (too many bearish implications.)

    I’ll post more after the close.

  • Slip Sliding Away

    We’re getting dangerously close to our downside target range of 1295-1323, first discussed back in April.

    • 1349.42 — .886 of the purple Butterfly (tagged)
    • 1343.41 — 1.272 of the yellow Crab pattern (tagged)
    • 1340.03 — horizontal support, prev. Point X  (tagged)
    • 1323.85 — 1.618 of yellow Crab (next)
    • 1317.63 — 1.272 of purple Butterfly
    • 1289.14 — 1.618 of purple Butterfly (and 2.24 of Crab)

    I have been viewing the downside as consisting of three basic scenarios:

    (1)  stick save: Fed freaks over Europe, QEish leak limits downside to 1349 (fail)
    (2)  top case: normal Butterfly completion to 1.272 (1317) or 1.618 (1289)
    (3)  panic sets in: crash and test bottom or large red rising wedge around 1200

    The daily RSI has reached an important trend line of support (solid, purple) and, unlike FTSE, has yet to exhibit positive divergence — meaning it could go lower and tag the dashed purple line.

    I suspect the solid line represents 1323 and the lower, dashed line 1289-1295, but that’s pure speculation on my part.  As we approach 100-pts off the 1422 top, look for lots of investors to throw in the towel.  It’s this capitulation that we need if we’re to see a meaningful rebound.

    As I wrote back on April 12 [see: Analog Details]:

    To me, a drop to 1305-1317 seems fairly plausible.  The tricky part comes in calling for a reversal after SPX has fallen 120 points from its recent high.  The timing looks to be early May.

    Will the Fed and ECB come to the market’s rescue yet again?  I think so.  I think they understand as well as the rest of us how close to the precipice we are. It’s stupid economic policy that will make things worse in the long run, but since when did that matter?

    On the other hand, I have no doubt that the looming derivatives disaster [see: There is Nothing Wrong] I’ve been writing about — handily verified by JPM — could be beyond their ability to control (hint: 2008 all over again.)

    Stay tuned.

    **********

    And, for fellow Simon & Garfunkel fans…

  • Analog Update: May 14, 2012

    Today’s action plays out well with the analog I first posted back on April 9 [see: Analog Watch] and charted on the 10th and 11th [Analog Details.]

    At the time, SPX had peaked at 1422, one point above a Butterfly target we identified on March 29 [see: All the Pretty Butterflies] and was on its way to our 1357 downside target (tagged later that day.)

    The subsequent completion of the right shoulder at the .886 Bat pattern target of 1415 [see: A Swing and a Hit] got the downside started on May 1, and it’s been all gravy since then — including the completion and back test (more…)

  • Running on Empty

    UPDATE:  EOD

    SPX went straight to our 1338 target and hung around pretty much all day — closing right on the H&S neckline.

    The analog I first posted on Mar 9 is still very much on track.  It called for the low 1300s by May 16 — which looks doable if we have another day or two like today.  Keep in mind, though, that while I had to pick a particular price target in order to chart the analog, I consider the downside to consist of a range from 1295-1323.

    UPDATE:  10:00

    We got the H&S completion we discussed earlier, seen below on the daily chart.  As expected we also got a bounce at the neckline.


    ORIGINAL POST:  9:20 AM

    With this morning’s continuing fallout from the latest JPM debacle, we should see the completion of the smaller H&S pattern we’ve been watching.  The neckline is around 1338, so look for a bounce there on the opening.

    As we discussed last Thursday [see: Still on Track], the latest H&S pattern targets 1275, but I believe it’ll be a challenge getting below 1292.  Remember, the overall targets I originally laid out on May 6 [see: So Far, So Good]:

    • 1349.42 — .886 of the purple Butterfly  [tagged May 8]
    • 1343.41 — 1.272 of the yellow Crab pattern [tagged May 9]
    • 1340.03 — horizontal support, prev. Point X [should tag this morning]
    • 1323.85 — 1.618 of yellow Crab
    • 1317.63 — 1.272 of purple Butterfly
    • 1289.14 — 1.618 of purple Butterfly (and 2.24 of Crab)

    Completion of the neckline mentioned above around 1338-1340 should also find horizontal support from the previous Point X (Mar 6) in the Butterfly pattern we’ve been watching since March [see: All the Pretty Butterflies.]

    But, my base case remains 1295-1317 for now.  It’s hard to calculate the damage that could be done by JPM’s screw-up.  As discussed last week [see: There is Nothing Wrong] JPM can easily withstand a $2-5 billion trading loss.  The danger is that much more damage lies beneath the surface — not difficult to imagine given the enormity of their $78 trillion derivatives portfolio.

    As I said back on April Fool’s Day [see: The Wipeout Ratio]:

    I fear this is the story of the year, folks.  And, it’s just now starting to get some press.  As we learned with AIG, if one segment of the financial markets suffers huge unanticipated losses, the entire house of cards can come crashing down.

    Such is the nature of today’s leveraged, re-hypothecated securities markets.  And, 99% of this stuff isn’t even quoted or openly traded, so who knows what skeletons are out there?  My gut tells me there’s plenty more where this came from.

    ***************

    And, for you Jackson Brown fans…

  • Still on Track

    ORIGINAL POST:

    In yesterday’s post [see: Two Targets Down], I theorized we would go up and trace out a right shoulder to complete a small H&S pattern in the right shoulder of the larger (completed) H&S.  So far, that’s exactly the way it’s playing out.

    As discussed, the perfectly-formed shoulder would take prices up around 1370 — a shoulder line parallel to the neckline, as well as the neckline of the larger H&S pattern.

    The 60-min RSI chart from May 8 forecast a back test of the solid yellow TL intersecting with the downward sloping yellow channel.  We got that, along with a clear rising wedge in the RSI to go with the triangle in SPX itself.

    From a timing standpoint, the ideal pattern will take 3-4 more days to play out — though there’s enough of a right shoulder now to consider it legit.  The target looks to be about 65 points below wherever we break back through the neckline, probably around 1275 (1340-65=1275).

    This is actually lower than the larger pattern’s target of around 1295.  I favor 1295 simply because I think the bulls will throw a fit if we threaten to take out the 1292 October highs.  Some of you more savvy Elliotticians know better than I what turmoil that would bring to the bullish case.

    More later.


  • Two Targets Down…

    Yesterday, we hit our initial downside target laid out over the weekend [see: So Far, So Good] when we nailed the Fibonacci .886 retracement of the Butterfly pattern (purple) we’ve been following since April 10.

    We bounced hard there, as the RSI chart indicated we might [see: 3rd Time a Charm] and completed a back test of the H&S pattern neckline [see: Back Test Complete] by actually closing on the neckline.

    This morning, we bagged the next target on our list, the 1.272 extension of the smaller Crab pattern (yellow) at 1343, which has me wondering…what’s next?

    Not that it always works this way (enjoy the streak!), but here’s the original list:

    • 1349.42 — .886 of the purple Butterfly
    • 1343.41 — 1.272 of the yellow Crab pattern
    • 1340.03 — horizontal support, prev. Point X
    • 1323.85 — 1.618 of yellow Crab
    • 1317.63 — 1.272 of purple Butterfly
    • 1289.14 — 1.618 of purple Butterfly (and 2.24 of Crab)

    The charts say there’s plenty more downside.  My top case remains 1289-1317.  Though we’re back to that RSI trend line (k-5) that provided yesterday’s bounce.  We can get to 1289 with a cross of that trend line or without. It’s a matter of “recharging” RSI with bounces such as we saw yesterday and this morning.

    At the end of the day, the “bottom” should exhibit positive divergence, and we’re nowhere near that yet.

    So, is it time to pile on more shorts?  If we’ve scored 5 waves down, we should see an a-b-c corrective wave.  As I posted last night, there’s a potential small H&S pattern developing in the right shoulder of the larger pattern.  Prices could loiter in the 1340-1370 area for a day or two and flesh out the small right shoulder before continuing down.  A 7-pt gain at the close would shake out lots of shorts.

    This would offer the added benefit of fully recharging RSI/MACD for the next push down — a very helpful development, should it occur.  I’ll be watching to see if RSI heads up into the intersection of that bold yellow trend line above with the bold yellow channel.

    Good luck to all.

     ********

    Now, we see that the euro zone is considering holding back the next installment of Greece’s bailout, some $5 billion or so. They have this crazy notion that the Greeks might renege on the austerity package/debt restructuring previously agreed to.  All together, now: “duh!”

    Whatever your opinion of why Greece has money problems, the bailout did very little to help the Greek people, who just expressed their heart-felt feelings about austerity in the voting booth. It mostly bailed out the bankers who made too many stupid loans to Greece (gee, where have we seen this before?)


  • 3rd Time a Charm?

    UPDATE:

    Down to 1350.76 so far, getting close to the .886 of the larger purple Butterfly pattern.  We didn’t bounce much at all when RSI first hit its fan line, a show of strength for the bearish case.

    The next test is the 60-min RSI, which has reached 18 — the low since August of 2011 and a sign of short-term oversold condition.  A push into the 17 range would be extremely bearish, though I suspect we’ll get a bounce before too long.

    A reminder of our downside targets posted on the 6th [see: So Far, So Good]:

    • 1349.42 — .886 of the purple Butterfly
    • 1343.41 — 1.272 of the yellow Crab pattern
    • 1340.03 — horizontal support, prev. Point X
    • 1323.85 — 1.618 of yellow Crab
    • 1317.63 — 1.272 of purple Butterfly
    • 1289.14 — 1.618 of purple Butterfly (and 2.24 of Crab)

    I talk a lot about bounces, but watch the market’s momentum.  If we slice through one level, consider adjusting stops rather than closing out positions.  We’ve seen it happen often enough on the upside — where logical reversal points were routinely ignored by a runaway bull.  The same thing can happen on the downside.  It’s just been so long that it’s easy to forget, LOL.

    ORIGINAL POST:

    This push below the neckline looks rather convincing, but — as before — the key is a close below it, currently around 1364.  The fly in the ointment is the RSI, which just tagged the fan line from Aug 2011.  It should provide at least a bounce.

    More shortly.

  • So Far, So Good

    Over the past 5 weeks, our forecasts have been remarkably accurate.

    The Butterfly pattern identified back on Mar 29 [All the Pretty Butterflies] correctly called the 1422 interim top.  As anticipated on Apr 10, we got a bounce at 1357 (the .786 of the 1340-1422 rise) and began tracing out a head & shoulders pattern that fit with an analog of the Feb-May 2011 topping pattern [Analog Details].

    The analog been very accurate thus far, although the initial right shoulder bounce had us wondering whether the alternate path to 1462 was playing out.  Our RSI indicators kept us on the right path.  Instead, we got a complex H&S pattern, with a second test of the neckline and subsequent round trip to the shoulder line, accurately forecast in both time and price.

    Friday’s bounce at 1367 was within 2 points of our 1365 target [2d Time a Charm], with a nice little back test — as forecast — to the neckline, where we closed out the week.  The only reason I mention all the above is that, while this degree of accuracy is always desirable, it’s not typical and should not be expected.

    Regardless of how well your investments have performed the past five weeks, don’t forget that they are out to get you.  Even now, as it appears that the analog is playing out nicely, the financial establishment is working overtime to separate you from your money.  There will be more times, such as in January, when perfectly good harmonic and chart patterns don’t play out as they should.

    Always use stops!

    Now, with that out of my system, it looks like the results of the Greek and French election, on top of Friday’s dismal non-farm payroll numbers, is going to provide the push we need to get on with the downside.

    Remember, our target is 1288-1323, although 1288 has been fudged to 1295 simply because a dip below 1292 would be problematic for the bulls from a wave count perspective;  i.e., I think they’ll pull out all the stops to avoid it.

    Potential bounces along the way include:

    • 1349.42 — .886 of the purple Butterfly
    • 1343.41 — 1.272 of the yellow Crab pattern
    • 1340.03 — horizontal support, prev. Point X
    • 1323.85 — 1.618 of yellow Crab
    • 1317.63 — 1.272 of purple Butterfly
    • 1289.14 — 1.618 of purple Butterfly (and 2.24 of Crab)

    But, I divide the downside into three basic scenarios:

    (1)  stick save: Fed freaks over Europe, QEish leak limits downside to 1349.
    (2)  top case: normal Butterfly completion to 1.272 (1317) or 1.618 (1289.)
    (3)  panic sets in: crash and test bottom or large red rising wedge around 1200.

    I expected to be able to update all of the charts today, but my youngest daughter has been home with stomach flu while my wife and daughter #2 were at an all-day volleyball tournament.  Needless to say, it wasn’t as productive a day as I expected.  Look for updated charts Monday.

    *****************

    Over the next couple of days, I’ll finish converting the new website to a premium site.  Many thanks to those of you who have joined up.  I hope you’ve been able to act on my forecasts; if so, you’ve more than earned back your subscription costs in the first week.

    To anyone still thinking about it, the end is near.  The old site will still display articles of general interest and delayed market updates.  But, members of the new site will enjoy the first and best of what I can put out.  To join now, click here.

    Good luck to all.

  • Random Walk, My A$$

    As we close precisely on the trend line between the Oct 27 high (which kicked off a 112-pt Inverse Head & Shoulders pattern) and the just completed (for the 2nd time) Head & Shoulders pattern, I’m reminded of how little fundamentals have come to matter.


    Oh, and for any Fibonacci haters out there, check out the time and price relationships between the two patterns.